Great Lakes Weather

Although the Great Lakes are a system of lakes, and not vast oceans, their waters and their 10,000 miles (16,000 km) of shoreline are subject to many hazards, many of which can be harmful or even deadly to those living and working around the Great Lakes ( 4 , 53 ) . Many of these hazards are weather-related and are a result of changes in wind speed, wind direction, atmospheric pressure ( 53 ) , air and water temperature ( 33 ) , or water quality ( 58 ) . When these changes occur, the Great Lakes can experience many dangerous events. Living with Weather explores those events, safety, and hazards.
Great Lakes Hazards and Impacts
Storm Surge
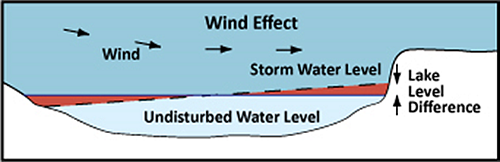
Figure 1: Storm surge depiction courtesy Michigan Sea Grant.
Description:
A storm surge is an event that occurs when strong storm winds flow over long stretches of open water for extended periods of time, pushing the water’s surface and increasing the amount and height of the surface water downwind ( 53 , 60 ) (Figure 1). The storm surge will continue for as long as the robust storm winds blow water towards the shore ( 53 ) .
The height of the storm surge depends on the speed of the wind producing it, and stronger winds produce higher surges. Typically, winds can produce storm surge ranging from one to eight feet on the Great Lakes. Out of all the Great Lakes, Lake Erie’s western and eastern shores are particularly prone to high storm surge, and bays with shallow depths are also susceptible ( 53 ) . Storm surge can occur unexpectedly, and major events can cause the beaching of, damage to, or the loss of ships, as well as the additional problems of flooding and shoreline damage ( 52 ) .
Impacts:
Halloween of 2014 brought a high wind event to Lake Michigan and in particular, Chicago, Illinois. Winds over 58 mph (93.3 km/hr) gusted over Lake Michigan, causing wave heights to reach 21.7 ft (6.6 m) at an offshore buoy – the second highest wave event since buoy observations of Lake Michigan began in 1981. As a result, storm surge covered Lakeshore Drive’s northbound lane (Figure 2) just as evening rush hour approached. Bridgeman, Michigan, also felt the effects of the storm surge when a local nuclear plant had to be closed down for several days because of a combination of the effects of already high water levels and storm surge that blocked up its intake tunnels ( 45 ) .
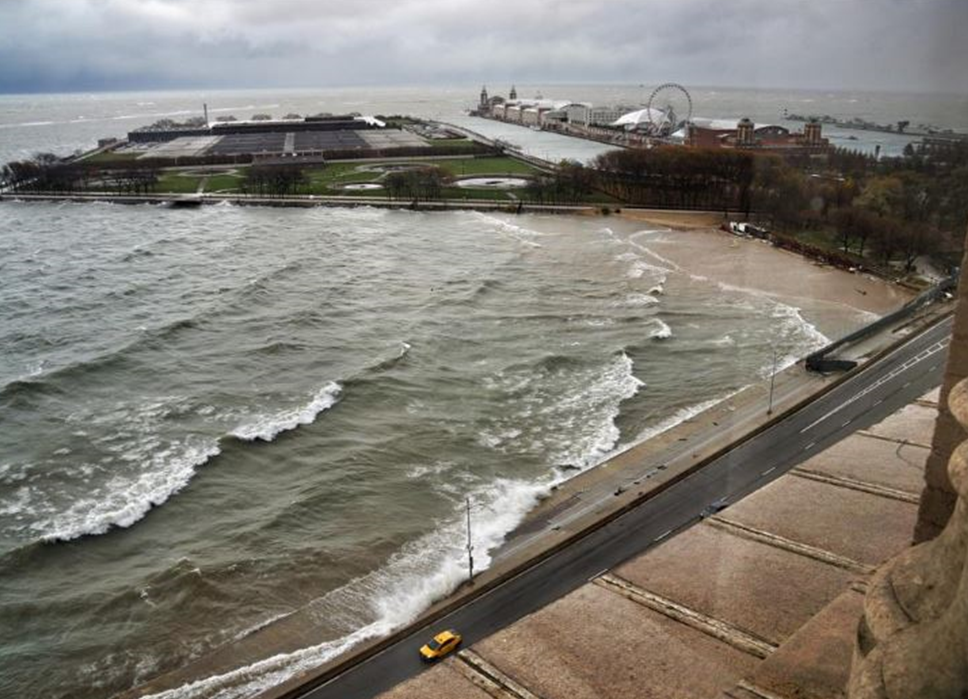
Figure 2: Storm surge on Lakeshore Drive in Chicago, IL on October 31, 2014. Photo credit: Todd Arkenbauer, WGN Weather Center Blog .
On November 19-20, 2016, incredibly strong winds blew across the Great Lakes with such force that 24 ft (7.3 m) waves were kicked up on Lake Superior, causing an increase in coastal erosion and damage to waterfront infrastructure ( 47 ) .
Seiches
Description:
A seiche (sounding like “saysh”) is similar to storm surge, but it is unique in that it must occur within a confined body of water, such as a lake, and involve a wave-like oscillation of water height between the two opposite ends of that body of water ( 35 , 52 ) . In other words, a seiche is created when a severe thunderstorm, or any other weather event that causes a change in air pressure and wind speed, exerts a force on the lake and pushes the water to one end of the lake, creating a water surplus on one end and robbing the other end of its water. When the weather event has passed, the water surplus that was compressed in one end of the lake rushes back out into the lake and towards the opposite shore. The movement then causes the water to splash back and forth across the length of the lake in a see-saw-like manner for some length of time on the order of hours to days ( 31 ) (Figure 3).
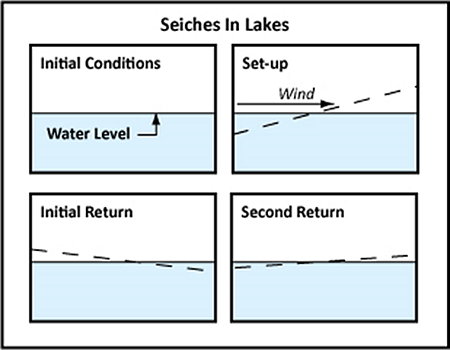
Figure 3: Seiches in Lakes, courtesy Michigan Sea Grant
("Surges and Seiches").
All of the Great Lakes experience seiches. However, Lake Erie is the shallowest of all the lakes and, as a result, experiences the biggest and greatest number of seiches within the Great Lakes system.
Impacts:
People living around the Great Lakes run the risk of being impacted by a seiche event. In particular, Buffalo, New York, and Toledo, Ohio, are highly vulnerable to seiche events due to prevailing wind patterns, their locations on Lake Erie’s eastern and western banks, and because of Lake Erie’s shallowness ( 52 ) .
One night in 1844, a seiche measuring 22 ft (6.7 m) high killed 78 people in Buffalo, New York, after a 14 ft (4.3 m) sea wall failed to halt the seiche ( 62 ) . In 2014, The Buffalo News ran a reprint of an article from 1914 that related a remembrance of this event and its terrible aftermath in Buffalo, New York ( 36 ) .
On January 30, 2008, Lake Erie had 12-16 ft (3.7–4.9 m) waves accompany a record-breaking seiche event that flooded a residential area close to Buffalo ( 35 , 62 ) . Lake Erie’s lake height exceeded its flood stage by 11 ft (3.4 m) and stayed that way for more than three hours. This seiche caused increased erosion along the shoreline, displaced docks, flooded a peninsula, destroyed lakeside ice dunes, and brought 5-6 ft (1.5-1.8 m) of storm water to Presque Isle Bay ( 35 ) .
Meteotsunamis
Description:
Meteotsunamis are one type of Great Lakes hazard that until recently, have received very little attention or study. As might be guessed from the name, meteotsunamis possess certain traits concerning their size and lifespan that are comparable to the traits of tsunamis, which are initiated by seismic events. Meteotsunamis can occur in both oceans and in confined bodies of water, like the Great Lakes. Their effects on the Great Lakes are far from insignificant, and they do in fact have a history of causing great damage and loss of life ( 4 ) .
The term “meteotsunami” is short for “meteorological tsunami” ( 5 ) , meaning that they are waves of water that are created by changes in wind flow or air pressure. Fronts, meteorological gravity waves, and storms (e.g., a derecho), all have the potential to act as a source of a meteotsunami. Atmospheric events like the ones just listed are capable of transferring a large amount of energy into the water beneath them, which is then transferred into building up waves. A meteotsunami wave with a height of about 1-ft (0.3 m) or greater is considered to be hazardous on the Great Lakes ( 4 ) , but it is recorded that meteotsunami waves have reached heights of approximately 20-ft (6 m) in other areas around the world ( 5 ) . The timing between meteotsunami waves can range anywhere between 2 minutes and 2 hours ( 4 ) .
A meteotsunami can be produced in two ways. The first way involves the formation of a long wave in the water below the atmospheric disturbance that is not confined by any physical boundary such as a coastline. In other words, the wave forms in open water. The wave then grows in height by traveling at about the same speed as the storm, gaining more energy from it ( 5 ) .
The second way for a meteotsunami wave to grow is by existing as an edge wave, which is a wave that travels parallel to the shoreline in a more confined environment. In this case, the wave is able to grow if its speed and its wavelength are the same as those of the atmospheric disturbance producing it ( 5 ) . The height of a meteotsunami wave upon making landfall is also subject to shoreline shape, depth, and topography ( 4 ) .
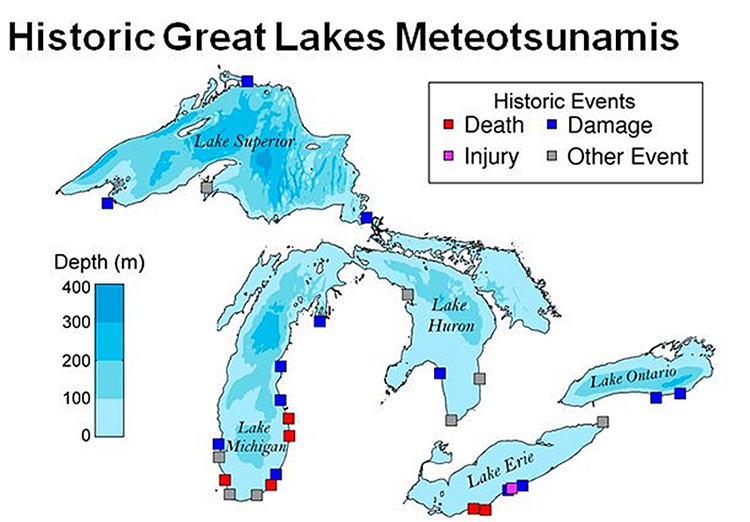
Figure 4: Impacts of historic meteotsunamis on the Great Lakes. The events shown span from 1882-2015.
(Image source: GLERL, Data source: Bechle, A.J. et al. (2016) Meteotsunamis in the Laurentian Great Lakes)
Meteotsunamis occur every year on all of the Great Lakes, with Lake Michigan experiencing them most often and Lake Ontario the least often, with the entire Great Lakes basin experiencing a yearly average of about 106 meteotsunamis ( 4 ) .
Impacts:
Meteotsunamis have received little attention until recently. As more work is being done to understand them, researchers are beginning to realize that many events that were attributed to seiches or storm surge in the past may have actually been caused by meteotsunamis ( 60 ) . The difficulty in distinguishing among these events is a result of the fact that meteotsunamis, seiches, and storm surge are all products of atmospheric disturbances that bring high winds to the Great Lakes ( 60 ) . In the past, numerous injuries, deaths, and other damages have now been attributed to meteotsunamis (Figure 4).
In 1954, two major meteotsunami events hit the shores of Chicago on June 26 and July 6. The June 26 meteotsunami landed on Chicago’s north shore, where fishermen at Montrose Harbor were washed off the piers. Seven drowned, lifeguards and police evacuated the shore, and flooding occurred on the beaches. Some floodwater traveled about 164 ft (50 m) inland. Residual wave oscillations and strong currents still impeded recovery and rescue activities 34 hours after the event had passed ( 3 ) . It was initially thought to be a seiche at the time; however, this event is now believed to have been a meteotsunami ( 52 , 60 ) . A second meteotsunami arrived at Chicago’s lakefront on July 6. The highest waves in this event were in excess of only 4 ft (1.25 m), but the effects of the event were felt for more than a day as 1-ft (0.3 m) waves continued on after these wave maximums. Reportedly, the conditions on Lake Michigan were worse than on June 26, but this time people were not caught off guard. Warnings were able to be issued, and no lives were lost ( 3 ) .
A series of meteotsunami events occurred on May 27, 2012 on Lake Erie’s south shore during Memorial Day weekend. A 6-ft (1.8 m) wave came ashore, causing a boat to capsize near Lakewood, OH. The three people in the vessel were rescued, according to the U.S. Coast Guard. About 2.5 hours afterwards, the shoreline near Madison, Ohio, experienced a sudden rise in water, which was followed by a drop in the water level that carried three swimmers out into the lake where they were retrieved by boaters ( 1 ) . The Coastal Management Program (CMP) has created a fact sheet " What is a Meteotsunami? " which contains more information and resources.
Currents
Rip Currents:
Rip currents occur on all five of the Great Lakes and can pose major hazards for the inexperienced swimmer. A rip current is a narrow jet of water moving swiftly offshore, roughly perpendicular to the shoreline ( 65 ) (Figure 5). As the waves break across the shore, a surplus of water is created that must be returned to the ocean, and one way the water can be returned is via a rip current ( 65 ) . Shallow and sandy, uneven shorelines are more prone to rip currents, which are most prevalent after storms. Typically, rip currents in the Great Lakes will often appear in channels passing through sandbars or at points where the water is deeper than the surrounding areas ( 51 ) .
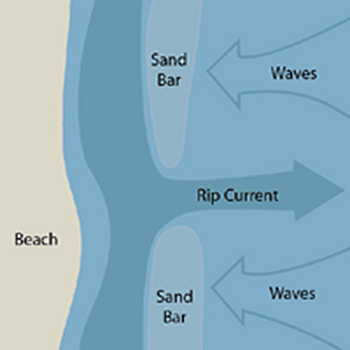
Figure 5: Rip current diagram, courtesy
Minnesota Sea Grant ("Rip Currents" 2015).
On average, rip currents move at a rate of about 1.4 mph (or around 0.5-1.0 m/s). However, rip current flow rates are variable, and it is known that they are capable of speeds of roughly 5 mph (2.2 m/s), much faster than the world’s fastest swimmers! Additionally, rip currents can have widths ranging anywhere from 10 to 100 ft (3.0-30.5 m) and lengths as long as 1000 ft. (304.8 m) ( 51 , 65 ) .
Other Currents:
A rip current is not the only type of current that occurs on the Great Lakes ( 11 ) . Longshore and structural currents are actually just as common as rip currents. Other currents include channel and outlet currents. Longshore currents flow parallel to the coastline, and often can form between multiple sandbars present just off the shore (Figure 6). Structural currents occur alongside manmade structures such as break walls or piers (Figure 7). These currents can be exceptionally strong, making them very dangerous ( 57 ) .
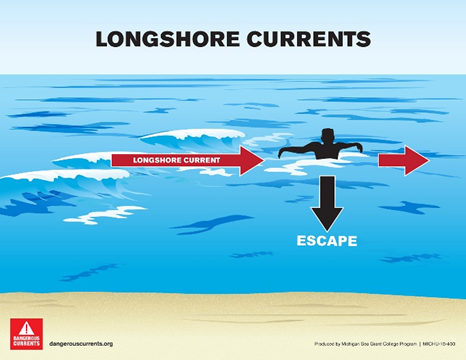
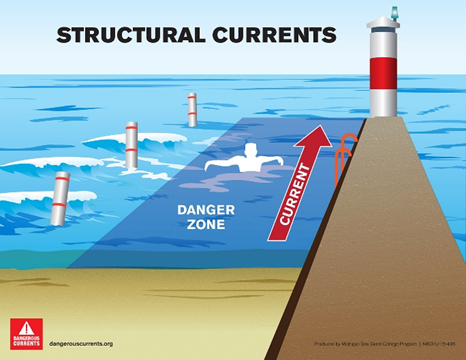
Figures 6 (left) and 7: Longshore current and structural current diagrams, courtesy Michigan Sea Grant ("Types of Currents").
Outlet currents are caused by the faster-moving waters pouring from stream or river mouths into a slower-moving ocean or lake (Figure 8). This water is able to flow for some distance into the lake before it slows down, creating a current. Lastly, channel currents, like longshore currents, run parallel to the shoreline. A channel current can arise when some natural structure, such as a rocky outcrop or an island, is present just off shore (Figure 9). As lake water flows parallel to the shore, it is compressed between the rocky outcrop/island and the shoreline, causing the water to speed up. Intense wind conditions can also intensify the wave action, causing the channel current to become more powerful ( 57 ) .
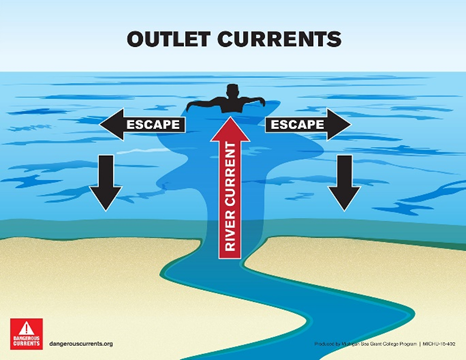
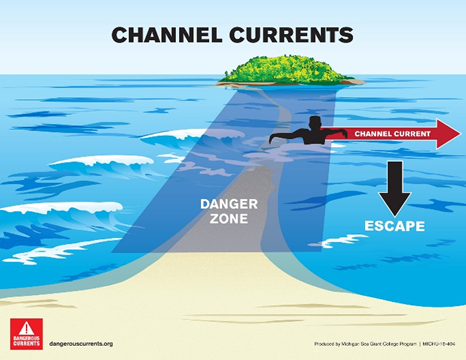
Figures 8 (left) and97: Outlet current and channel current diagrams, courtesy Michigan Sea Grant ("Types of Currents").
Impacts of Currents:
According to the Great Lakes Current Incident Database , the Great Lakes had an estimated total of 164 current-related fatalities between 2002 and 2016. An estimated 350 people were also rescued from currents during this time period as well. Lake Michigan greatly exceeds the other lakes in annual average number of current-related incidents, with an average of 24.4 such incidents per year. The other lakes reportedly had much lower average incident rates, with Lake Erie averaging 4.5 incidents per year, Lake Superior 2.9 incidents per year, Lake Huron 1.3 incidents per year, and Lake Ontario 1.1 incidents per year ( 20 ) . For more information on types of currents and their hazards, visit the Michigan Sea Grant Dangerous Currents website.
Lake-Effect Snow
Description:
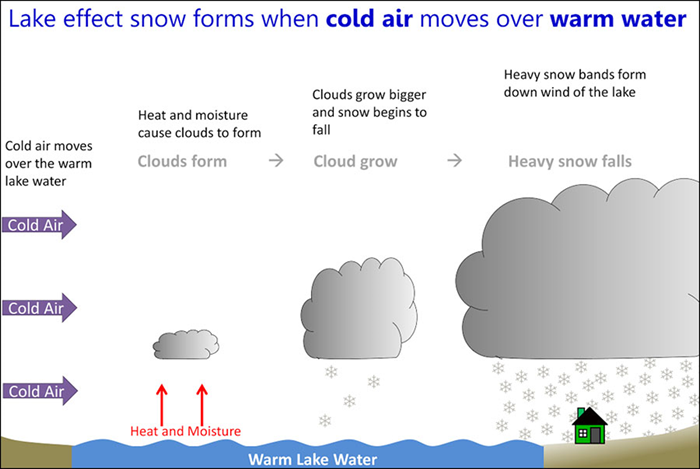
One of the most distinct meteorological events present in the Great Lakes region is lake-effect snow, which occurs during the autumn and winter months ( 6 ) . It is formed due to differences in the temperature and humidity characteristics of the air over the land and water in the Great Lakes region ( 32 ) (Figure 10).
As the chillier months of the year approach, cold, Canadian air begins to travel south towards the Great Lakes ( 59 ) . As the air flows over the lakes, it comes into contact with warmer waters below it. An energy exchange occurs between the air and water in which the cold air begins to warm, becoming more humid, making the air less stable, and causing it to rise and form clouds that can produce precipitation ( 6 ) . The clouds eventually form a line, or band, that can allow for a snowfall rate in excess of 2 to 3 in/hr (5.1-7.6 cm/hr) ( 59 ) (Figure 9). Lake-effect snow can vary in intensity based on how the air travels across the lakes (i.e., is it taking the long way or the short way across the lake?) ( 6 ) . Wind is also very important in determining where the snow falls, as it can essentially steer the snow towards a location. Lake-effect snow is also affected by the water and land topographies ( 59 ) . Visit the MRCC Living with Weather: Winter Storm page to learn more!
Impacts:
A significant lake-effect snow event hit Buffalo, New York from November 17-21, 2014. Some places received 88 in (223.5 cm) of snow, with snowfall rates an astounding 6 in (15.2 cm) per hour (Figure 11)! Lake-effect snow also affected regions east of Georgian Bay and lakes Ontario, Huron, and Superior. In Buffalo, 14 people died, roofs and structures collapsed and failed, snow removal budgets were exhausted, schools were closed for over a week, roads were shut down, and driving restrictions were put in place, stranding motorists by the thousands ( 45 ) .
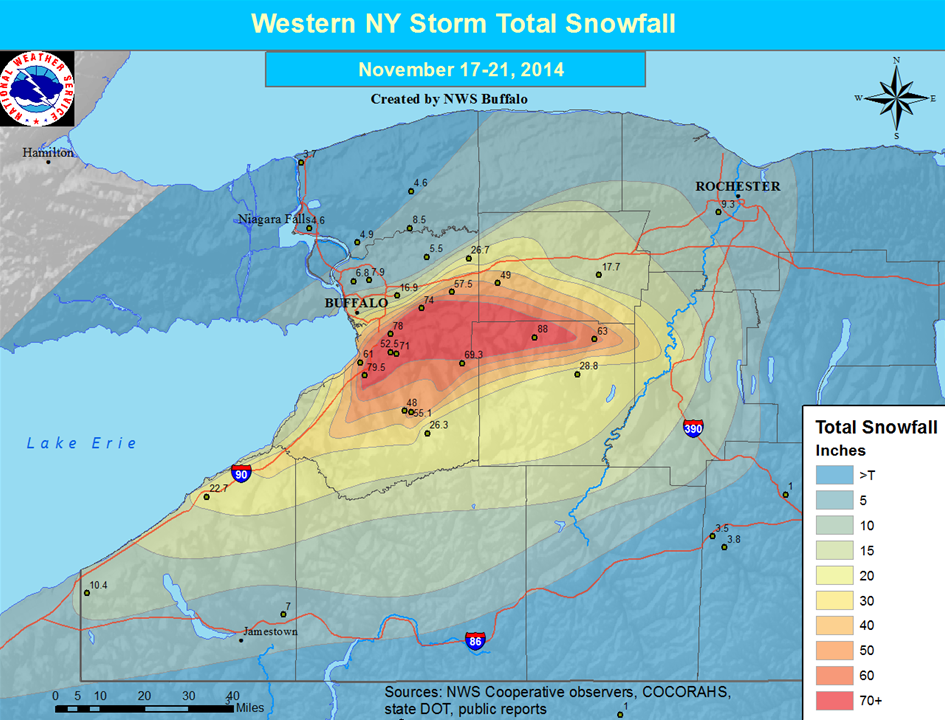
Figure 11: Western New York total observed snowfall (in) from November 17-21, 2014 (Graphic courtesy Buffalo NWS)
The winter of 2016-17 brought several rounds of lake-effect snow to the Great Lakes. On January 5, 2017, Buffalo, New York was hit with 2 feet (61 cm) of snow over a 6-8 hour window, which caused traffic to halt during peak evening hours. Because buses could not run, hundreds of schoolchildren did not get home until hours later. Also, over the period from February 1-4, lake-effect snow caused a state of emergency situation on the eastern shore of Lake Ontario in Oswego County, New York, when 76 in (193 cm) fell ( 48 ) .
Lake Ice
Description:
Beginning in the fall and early winter, the water in the Great Lakes begins to cool, and soon after, ice begins to form and continues until the peak ice cover is in place ( 2 ) . The upper Great Lakes tend to have peak ice cover towards the end of February and the beginning of March, while the lower Great Lakes tend to have peak ice cover between the middle and end of February ( 24 ) . Then, as spring approaches, the ice begins to melt ( 2 ) .
For the entire Great Lakes system, 1979 saw the highest annual maximum ice cover on record with a maximum extent of 94.7%, and 2002 saw the lowest annual maximum ice cover on record with a maximum extent of only 11.9% (Figure 12). Lake Erie, the smallest and shallowest of the Great Lakes, has frozen over completely on three separate occasions: in 1978, 1979, and 1996. Although it is much deeper and larger, Lake Superior also froze over completely in 1996 ( 24 ) . Ice consistently forms in more shallow regions of the Great Lakes, in places like the Apostle Islands and Whitefish Bay in Lake Superior, the Straits of Mackinaw in Lakes Huron and Michigan, and between Long Point and Buffalo, New York, in Lake Erie ( 2 ) . Based on 20-year averages, beginning in 1973, it appears that yearly ice cover extent on the Great Lakes is decreasing with time ( 24 ) .
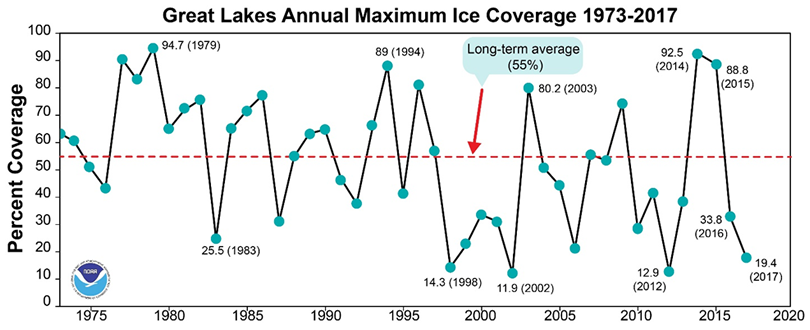
Figure 12: Historical annual maximum ice cover on the Great Lakes from 1973-2017 (Source: GLERL)
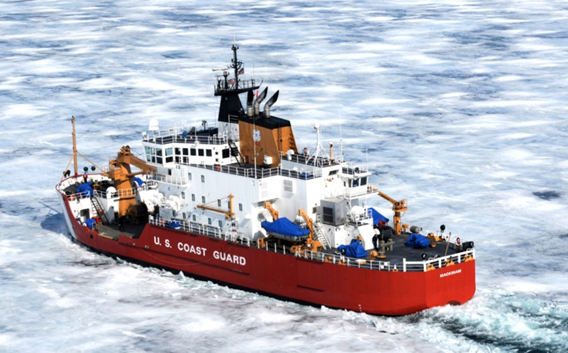
Figure 13: The U.S. Coast Guard ice breaker Mackinaw . (Photo: U.S. Coast Guard Flikr)
Impacts:
The winter ice that forms on the Great Lakes has far-reaching effects on life and industry in that region. The extent of the ice varies every year, and this fluctuation affects such things as commercial shipping, hydropower, and the fishing industry. Ice data collection allows scientists to monitor and forecast the ice activity. By doing this, they can provide beneficial information that helps coastline management, weather forecasters, navigators, fishermen, and lake safety workers ( 22 ) .
However, there are everyday hazards associated with the ice itself that can cause major problems for shoreline property owners and navigators. For instance, many ships, often commercial carriers, are not able to break through the ice due to their rounded bows and lack of power. These vessels must rely on the more powerful U.S. Coast Guard boats that cut paths for the ships through the ice (Figure 13). However, the paths through the ice can quickly close due to wind activity, which can trap ships and damage their hulls. Winds can even move the ice fields, along with the trapped ships, to more dangerous, shallow waters where the ships can be run aground ( 2 ) .
Ice jams are another hazard that causes areas upstream of the jam to experience flooding and areas downstream to have lower water levels. Ice jams are a threat that lasts all winter, but they are more common in the spring when the ice is beginning to move around and breakup. Ice can also destroy docks that become frozen in the ice. Once frozen, the docks are then at the mercy of the movements of the ice, which has been known to tear docks apart. Additionally, ice can invade the shore and plow through anything standing in its path ( 2 ) . On April 5, 1984, a record ice jam formed on the St. Clair River. It lasted 24 days and costed shipping companies whose ships were stuck on either side of the jam about $1 million per day ( 2 ) .
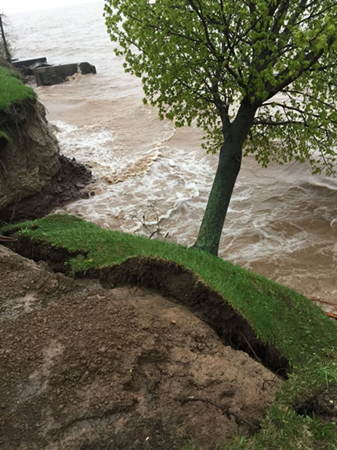
Figure 14: Erosion of beachfront property in
Lyndonville, NY. (Photo: Alicia Bonanza)
Erosion
Description and Impacts:
Erosion and flooding regularly occur along the perimeters of the Great Lakes, generating hundreds of millions of dollars in losses of homes, businesses, and recreational facilities ( 9 ) . Shoreline erosion has many causes that are rooted in the movements of people, wind, rain, frost, groundwater, and water levels ( 28 ) . Erosion plus high water levels can mean higher erosion rates, which can result in a loss of beaches, structures, and beachfront properties ( 9 ) (Figure 14).
Not every Great Lakes shoreline is eroding at the same rate. Some areas are designated as “high risk erosion areas”. This means that those areas are losing ground at a rate averaging 1 foot (0.3 meters) or more per year over the last 15 or more years. However, some areas can experience a loss of 17 feet (5.2 meters) per year ( 28 ) . More on erosion can be found here .
Winter lake ice normally helps preserve habitats and beaches around the Great Lakes. However, the 2016-2017 winter was so mild that the ice cover was not extensive and only was present at the surface of the lakes near the shorelines. Instead of protecting the shores, the ice eroded them, causing the Presque Isle State Park officials in Erie, Pennsylvania, to take additional measures to ensure the beaches would still be usable ( 48 ) .
Harmful Algal Blooms
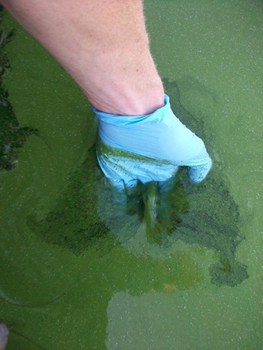
Figure 15: Harmful algal bloom in Lake Erie
during July, 2015. (Photo: Ohio Sea Grant)
Description:
The growth of harmful algal blooms is one Great Lakes hazard that does not stem directly from a meteorological event. Instead, harmful algal blooms are the result of the growth of blue-green bacteria called “cyanobacteria”. As these small organisms grow in the water, they can either disperse throughout the water column or they can clump together to float close to or at the water’s surface, essentially forming a mat of blue-green algae (Figure 15). Harmful algal bloom events can come in many colors as well, including brown, white, blue-green, red, purple, black, or green ( 39 ) .
Harmful algal blooms can occur for various reasons, one being a sudden input of nutrients such as nitrogen or phosphorous into their environment. These nutrients can come from many sources including farm fields, lawns, precipitation, sewers, septic systems, and wastewater treatment plants ( 39 , 58 ) . Ultimately, these nutrients find their way into the bodies of water such as rivers, lakes, bays, and oceans where they then proceed to provide an excess of nutrients for the algae living there. In addition, an event can be initiated if the temperature of the water is abnormally high, if the circulation of the water is extra slow, or if a flood, hurricane, drought, or other intense weather event occurs ( 58 ) .
Harmful algal bloom events have become more prevalent in recent years largely due to the loss of natural buffer and filter zones that are provided by wetlands and forests. The loss of these environments has given nutrients easier access to the waterways where they can cause these algal events. Lake Erie has seen some significant harmful algal bloom events, including one in 2011 that was caused by excessive phosphorous transported to the lake as fertilizer runoff from an agricultural field ( 39 , 58 ) .
Impacts:
Harmful algal blooms can take a toll on many different areas of society and industry in the Great Lakes including tourism, agriculture, and fisheries. One of the largest effects, however, is on water quality ( 7 ) . Drinking water supplies can be tainted by their presence, as they give water a bad taste and cause scummy buildup and bad odors. In 2014, a harmful algal bloom in Lake Erie contaminated the drinking water supply in Toledo, Ohio and the mayor announced a drinking water ban from August 2-4 ( 44 ). Public areas used for recreation can be spoiled if harmful algal blooms are present, and fish kills can occur if the fish are in competition with the algal blooms for oxygen.
Unfortunately, algal blooms can prove to be harmful or even fatal for some land dwellers as well. Some, but not all, cyanobacteria can be toxic, producing poisons that are some of the most potent in existence. The toxicity can kill pets and livestock, and it can poison humans, causing illness. Children are especially susceptible to toxic cyanobacterial blooms because they are smaller than adults and so the toxins can produce a greater effect in them. Being able to recognize harmful algal bloom events is crucial as there are no antidotes for cyanobacterial poisons. However, not all harmful algal blooms will be toxic. Blue-green algae occurs naturally and it depends on species type, location, timing, and site conditions to determine if a bloom will be toxic or not ( 17 ) (Figure 16). For more information on harmful algal blooms, visit the Great Lakes Environmental Research Laboratory (GLERL) website to learn more.
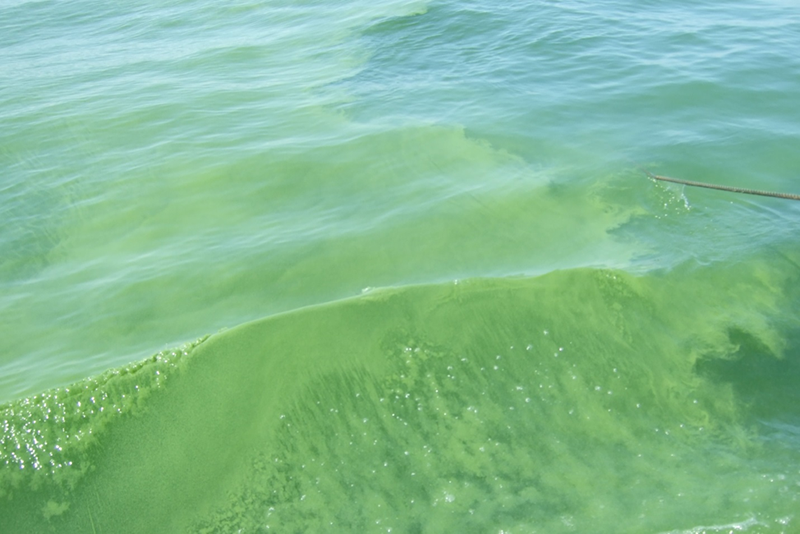
Figure 16: Algal bloom on August 16, 2013. (Photo: Ohio Sea Grant & Jeff Reutter)
Great Lakes Hazard Safety
Drownings are all too common on the Great Lakes. Even knowing how to swim cannot prepare all swimmers and beach-goers for the unexpected wave or current that could drag them from the beach. The Great Lakes Water Safety Consortium is dedicated to promoting knowledge of safe water practices with the goal of eliminating the threat of drowning in the Great Lakes. On their website, it says that there have been over 530 drownings in the Great Lakes between 2010-2016 (Figure 17).
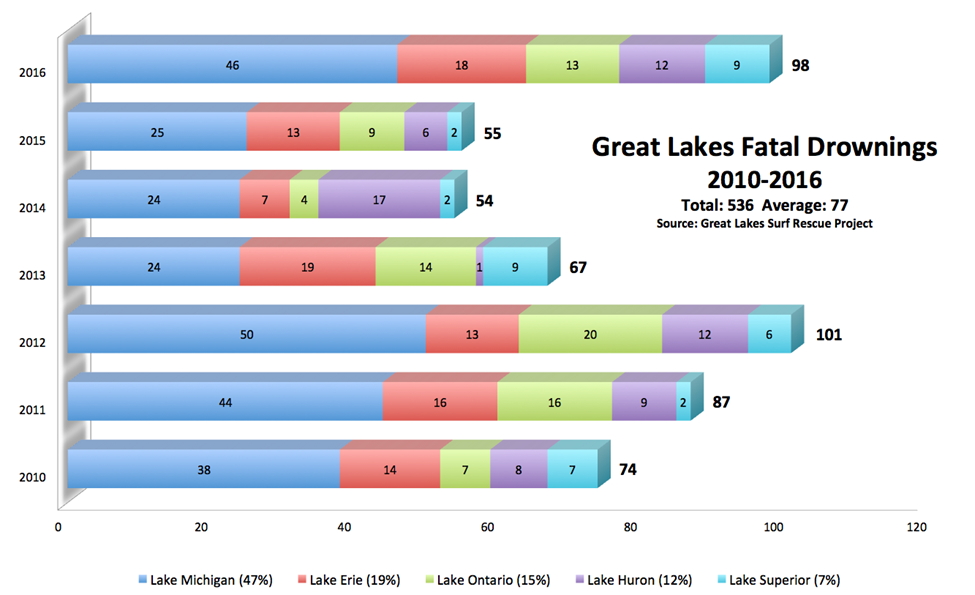 Figure 17: Great Lakes fatal drownings from 2010-2016. (Source: Great Lakes Water Safety Consortium)
The U.S. National Weather Service (NWS) is an excellent source of safety information for the Great Lakes Region. In fact, the NWS hosts the Great Lakes Portal . This service allows users to very easily access information and visual tools for topics such as the latest flood warnings, severe storm watches, areal flood advisories, and small craft advisories for all five lakes. Users can also see forecasts for wave height, wave period, wind speed, wind gust, predominant weather, and lake water temperature.
Beach Safety
The NWS Great Lakes Beach Hazards page provides the current status of swim risk conditions (Low, Moderate, or High) under the Beach Forecasts tab for the U.S. coastline in the Great Lakes region (Figure 18). This page also informs the user of any beach hazards statements that are currently in effect. Additionally, users have access to information on current-related incidents, beach safety, Great Lakes water quality, as well as additional resources. A user guide to the Beach Hazards page can be found here .
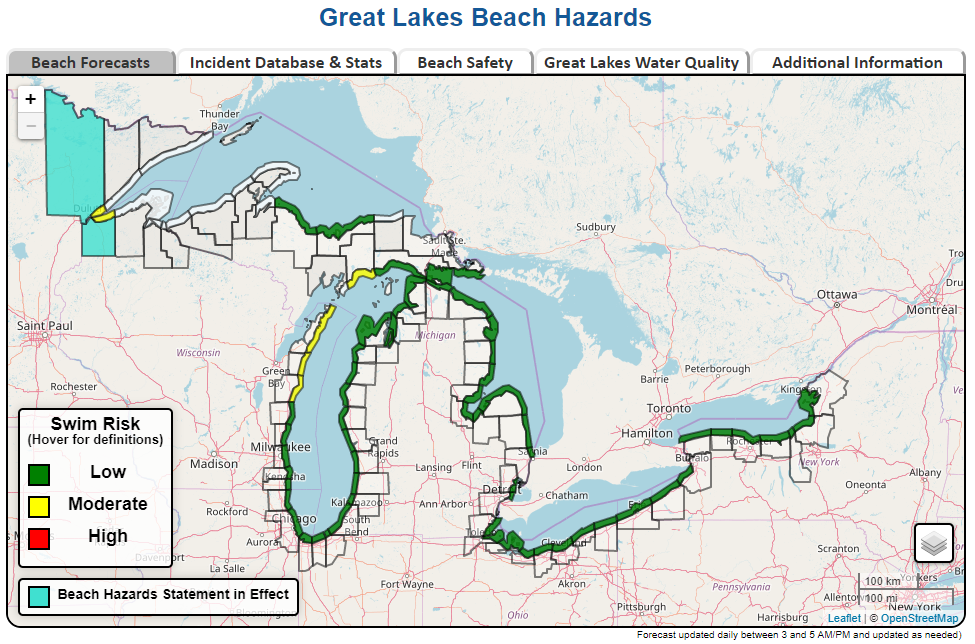 Figure 18: An example of the Great Lakes each Hazards page from the National Weather Service.
For a general guide to beach safety and to learn how to handle a rip current, visit the NWS Weather Ready Nation WRN Rip Currents page about beach, surf, and rip current safety. This page provides tips and helpful videos for surviving rip currents and dangerous beach conditions ( 63 ) . There are also personal stories from people who have been caught in rip currents.
The following guidelines are taken from the Minnesota Sea Grant page on rip currents ( 51 ) :
To avoid being caught in a rip current , know the signs for spotting the dangerous channels. Some basic signs are:
- A channel of churning, choppy water.
- Different-colored water from stirred sediment.
- A break in the incoming wave pattern.
- Foam, plants, or other objects moving away from shore.
Apart from natural signs, other people have set precautions to make sure the public knows about rip currents. Here are some ways you can utilize these efforts:
- Look for rip current warning flags at your beach. These are visible at some beaches in the Great Lakes region. A green flag means low risk, a yellow flag means moderate risk, and a red flag means high risk.
- Use flotation devices such as boogie boards when swimming.
- Note the location of the nearest lifeguard in case of an emergency.
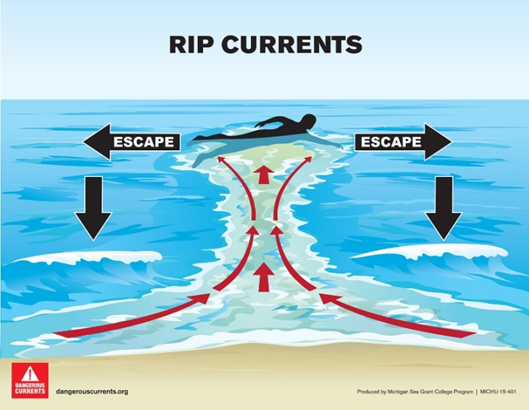
Figure 19: Rip current escape route diagram, courtesy
Michigan Sea Grant ("Types of Currents").
If caught in a rip current, do not try to swim against the current. Instead, do the following (Figure 19):
- Stay calm. Trying to swim against the current will expend energy and lead to drowning.
- If you know the direction of flow, swim perpendicular to the current until you are free, and then swim toward shore at an angle away from the current.
- If you do not know the direction of flow, float on your back until the rip current dissipates, and then swim back to the shore at an angle away from the current.
- Remember the three "F"s of rip current safety: Flip, Float, and Follow. Flip over onto your back. Float to conserve energy and keep your head above water. Follow the current until it dissipates. Then swim to shore at an angle.
- If you feel you will not be able to reach shore alone, face the shore and draw attention to yourself, if possible ( 51 ) .
Hazardous Water and Marine Safety
As discussed above, storm surge, seiches, and meteotsunamis hazards are particular hazards in the Great Lakes. People can guard against the impacts of these hazards by staying informed. The NWS provides forecasts for the Great Lakes coasts and offshore waters, and marine forecasts from the NWS can be found here . This portal allows users to select any area on the Great Lakes and view nearshore marine text forecasts, special marine weather warnings, statements, and messages, point forecasts, as well as open lake forecasts and other resources (Figure 20).
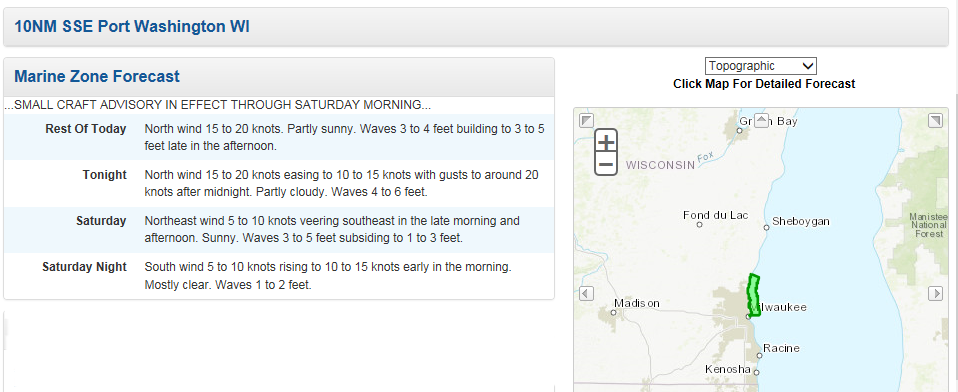
Figure 20: An example of a Marine Zone Forecast from the MWS Marine Forecast Page.
The Great Lakes Portal , mentioned previously, is also an excellent resource for quick information on wave activity and water conditions (Figure 23). This portal provides a launch point for accessing forecast graphics and coastal and marine forecasts for locations in the Great Lakes region. From this site, users can also access the websites of NWS offices that provide forecasts for the Great Lakes region and stay up to date on potentially hazardous conditions. These and other resources, such as NOAA Weather Radio, can be found under the Additional Resources for Great Lakes Graphical Forecasts section.
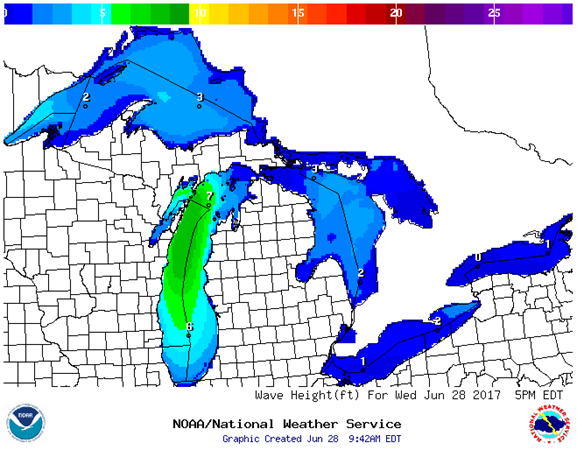
Figure 21: An example of a wave height (ft.) forecast available from the NWS Great Lakes Portal.
A great resource for accessing both current and forecasted weather conditions on the Great Lakes can be found on the Data & Products page of the GLERL Great Lakes Sea Grant Extension Office. This useful page contains links to a large variety of Great Lakes monitoring sources, including ones that offer marine observations, buoy data, water level data, and forecasts.
There is actually no forecasting system at the present time for predicting meteotsunamis. However, a system is currently being developed through the efforts of scientific researchers, the National Oceanic and Atmospheric Administration (NOAA), and the National Tsunami Hazard Mitigation Program (NTHMP) that would enable scientists to forecast and issue warnings for meteotsunamis. However, NOAA and NTHMP suggest that “In the meantime, the public should heed warnings issued by local National Weather Service Weather Forecast Offices, which can identify a potential coastal threat based on weather conditions” ( 61 ) . More on meteotsunamis. .
For information on boating regulations and safety, visit the official website of the U.S. Coast Guard’s Boating Safety Division . To learn more about the Coast Guard’s role on the Great Lakes, visit Coast Guard Great Lakes , the official blog of the 9th Coast Guard district. This site allows the public to engage with the Coast Guard and to learn more about how safety is coordinated in the Great Lakes region.
Winter Weather Safety
To stay informed about lake-effect snow and other hazardous wintry weather conditions, visit the NWS Weather Ready Nation WRN Winter page . This portal provides explanations for many winter events such as lake-effect snow and ice storms. The “forecasts and observations” menu option gives users a bird’s-eye view of current weather conditions and hazards for the entire United States and access to local NWS forecasts (“WRN Winter”). Local weather forecasts are always available through the National Weather Service .
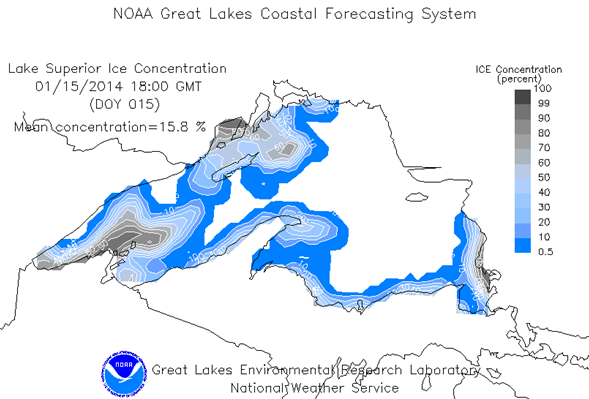
Figure 22: An example of ice concentration forecasts from GLERL.
Ice Conditions and Safety
To keep up to date on current ice analyses and forecasts, visit the NOAA Great Lakes Environmental Research Laboratory (GLERL) Great Lakes Ice Cover page (Figure 22). This source is an excellent tool for learning more about Great Lakes ice cover in both the past and the present and for keeping up to date with ice cover nowcasts and forecasts.
Harmful Algal Bloom Safety
The NOAA Great Lakes Environmental Research Laboratory (GLERL) is home to the Great Lakes HABs and Hypoxia page. There, website visitors can see the latest harmful algal bloom research and tracking being done on the Great Lakes and sign up for the Lake Erie HAB Bulletin .
The CDC Harmful Algal Bloom (HAB)-Associated Illness page provides a good summary of harmful algal bloom health hazards, impacts, and risks. It also provides information on basic steps that can be taken to avoid harmful exposure to harmful algal blooms. In addition, local communities will issue bans on drinking water and beach closures as necessary for harmful algal blooms. Therefore, pay attention to your local news outlets for this information.
A Short History of Great Lakes Sailing and Shipping Safety
History

Figure 23: A timeline of the federal marine agencies in U.S. history
that have kept the Great Lakes safe (MRCC). Click for large version .
Dennis L. Noble wrote of the Great Lakes, “The chain of lakes making up the region encompasses 94,510 miles. Indeed, it does appear that the lakes are, in the words of one writer, the ‘Eighth Sea.’” Protecting people and watercraft from the dangers of these vast lakes has been a priority of the U.S. Coast Guard , or its predecessors rather, since the early 1800s (Figure 23).
One of the first safety services on the lakes was the U.S. Lighthouse Service. The U.S. Revenue Cutter Service began patrolling the lakes in the 1820s to provide aid for those in distress. By 1854, the government had established the U.S. Life-Saving Service, whose rescue crews, in honor of the public’s perception of their gallant duty, became known as “surfmen,” “‘storm warriors,’” and “‘soldiers of the surf.’” The Steamboat Inspection Service also came into existence and became an organization that enforced rules and regulations throughout the Great Lakes. The U.S. Coast Guard was established in 1915 as a merged form of the U.S. Life Saving Service and the U.S. Revenue Cutter Service. Shortly before World War II, however, the U.S. Coast Guard took over the operations of the U.S. Lighthouse Service, and then during World War II, the Steamboat Inspection Office was subsumed into the U.S. Coast Guard as well ( 38 ) .
The mid-1800s saw the building of the Soo Canal and a rise in shipping activity on the lakes as iron ore, coming from the port in Marquette, became a major economic driver ( 26 ) . Copper mining, lumberjacking, and fishing also worked to further economic prosperity ( 18 ) . As shipping traffic increased on the lakes, the need for lighthouses and navigational aids increased as well. Lake Erie’s Presque Isle lighthouse is believed to have been one of the first on the Great Lakes (Figure 24). By 1866, 72 lighthouses were in existence and over 100 by the turn of the 20th century ( 38 ) . There were also vessels called lightships that were steam-powered (Figure 25). These ships stood watch in dangerous areas, and in all weather conditions, in places where it was not possible to put up a signal light. With the establishment of the U.S. Coast Guard, rescue and navigational equipment and techniques became more sophisticated as helicopters, new boats, and automation came to the Great Lakes ( 38 ) . An early history of safety on the lakes can be found here.
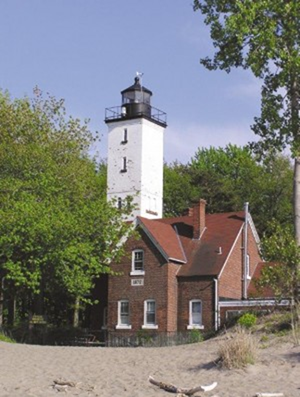
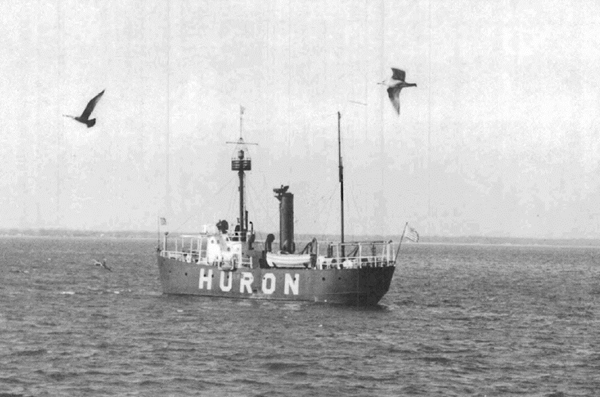
Figure 24 (left): Presque Isle Lighthouse building in 1872-1873 (Source: PresqueIsleLighthouse.org). Figure 25 (right): The Lightship Huron was
the last of her type on the Great Lakes. She left her station on August 21, 1970, replaced by a horn buoy (adapted from Nobel 1989).
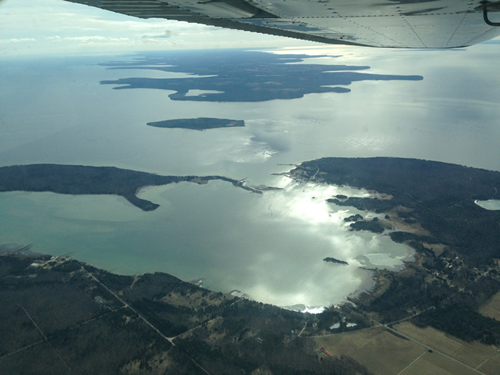
Figure 26: Aerial view of the infamous Death's Door Passage, looking from
the northeast. Lake Michigan lies to the left, and Green Bay to the right.
(Photo: Matthew Thibault, March 20, 2016)
Noted Rescues and Tragedies
A passage used by boats and ships to sail between Lake Michigan and the Bay of Green Bay is famously known as “Death’s Door” (Figure 26). Legends about the treacherous passage are believed to have existed even before 1728. One story suggests that the name came about because a large group of Native Americans met their deaths on the rocks. Another story suggests that the French made up the name to discourage the English from venturing into the region. Between 1837 and 1914, 24 brigs, barks, and schooners were wrecked there, and 40 additional vessels were lost to nearby hazardous areas. Other vessels, numbering in the hundreds, have also been rescued from the clutches of Death’s Door. Fortunately, thanks to the U.S. Life Saving and Light House Services, other vessels, and nearby residents, no lives were actually lost to the strong currents and rocks of Death’s Door during the 1800s ( 12 ) .
During the winter of 1870-1871 alone, 214 people lost their lives due to accidents on the lakes ( 38 ) .
On May 11, 1890, Maebelle L. Mason, the 14-year-old daughter of the lighthouse keeper of the Mamajuda Light, rowed herself to a spot a mile away from the lighthouse to save a man whose rowboat had capsized. After successfully reaching him, Maebelle rowed the tired man back to shore. She was afterwards the recipient of the Silver Lifesaving Medal ( 38 ) .
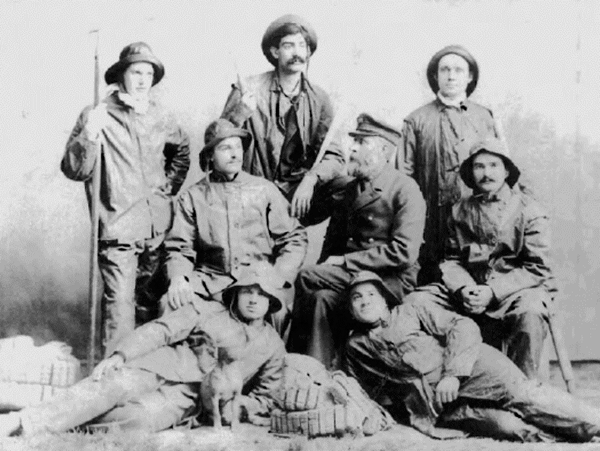
Figure 27: Crew of the Evanston, Illinois U.S. Life-Saving Station. Keeper Lawrence O. Lawson
(center row, facing left) was in charge of the station from 1880 to 1903. Under Lawsons'
leadership, the station is credited wit the rescue of 447 people from over 35 shipwrecks
(adapted from Noble 1989).
On November 8, 1889, Lawrence O. Lawson, a U.S. Life Saving Services keeper of Evanston Station, led his team of surfmen, who were all Northwestern University students, to save all 18 crewmembers of the Calumet , which had wrecked near Fort Sheridan (Figure 27). After transporting the crew of Evanston Station and their boat via the railway to the spot, Lawson then led his team down to the beach after maneuvering their boat over a cliff. The rescue succeeded after the Lawson crew battled against a raging storm, sleet, and tall waves to reach the stranded men. The Gold Lifesaving Medal was presented to the entire Evanston Station crew for their heroic efforts ( 38 ) .
During a November storm in 1913, 250 people were killed and 19 ships were lost ( 30 ) . The Armistice Day storm of November 11, 1940 killed 65 people and claimed five vessels throughout the Great Lakes ( 30 ) .
On November 10, 1975, the largest ship ever claimed by the Great Lakes, the Edmund Fitzgerald , went down with her entire crew of 29 men in Lake Superior near Whitefish Point. The Edmund Fitzgerald , a carrier ship that was a legend in her own time, had been working on the Great Lakes since 1958 ( 56 ) . While hauling over 26,000 tons of cargo made up of iron ore pellets, called taconite, the Edmund Fitzgerald became a victim of a November gale, an extreme type of storm associated with the autumn months in the Great Lakes. Incredibly high waves, believed to have exceeded seven meters, aided Lake Superior in sinking the Edmund Fitzgerald ( 30 ) . More information on marine forecasting advancements can be found here .