Drought
Drought: A Complex Definition

In simple terms, drought is caused by too little precipitation over an extended period, often accompanied by high temperatures. For the atmospheric scientist, drought is defined as a period when precipitation is significantly less than normal over several months or more. However, the declaration of drought is made not only on the basis of meteorological or climatological values.
Even though precipitation may be deficient over a period of time, the true existence of a drought is not evident until water supplies or other parts of the environment experience stress from the water deficiency. Different areas of the country vary in their susceptibility to effects from water deficiencies. Some soils withstand dry weather better than others, and some areas are more dependent than others on surface water sources (lakes and rivers) which are more susceptible to drought than groundwater sources.
The "socioeconomic" aspect of drought for a particular area often changes with time as new water supplies are developed or other means, such as new water conservation measures, are used to delay or mitigate the effects of a rainfall deficiency. Further, what is a drought for farmers may not be one for urban residents. For example, hot dry weather in July and August, a critical part of the growing season, may seriously impact agricultural productivity, but have little effect on water supplies in communities in the same area. The opposite may also be true; winter drought may seriously affect communities with marginal water supplies and have little effect on agriculture.
When does a drought begin?
It is often difficult to detect since the effects of a growing precipitation deficiency appear slowly. There may be signs a drought is under way, but often little attention is given to it until the effects become very serious. There is no single indicator of drought that works in all cases, so planners, policy makers, and others impacted by drought use a variety of calculated indices to determine the status of drought in their area.
What Causes Drought?
The Climate Factors
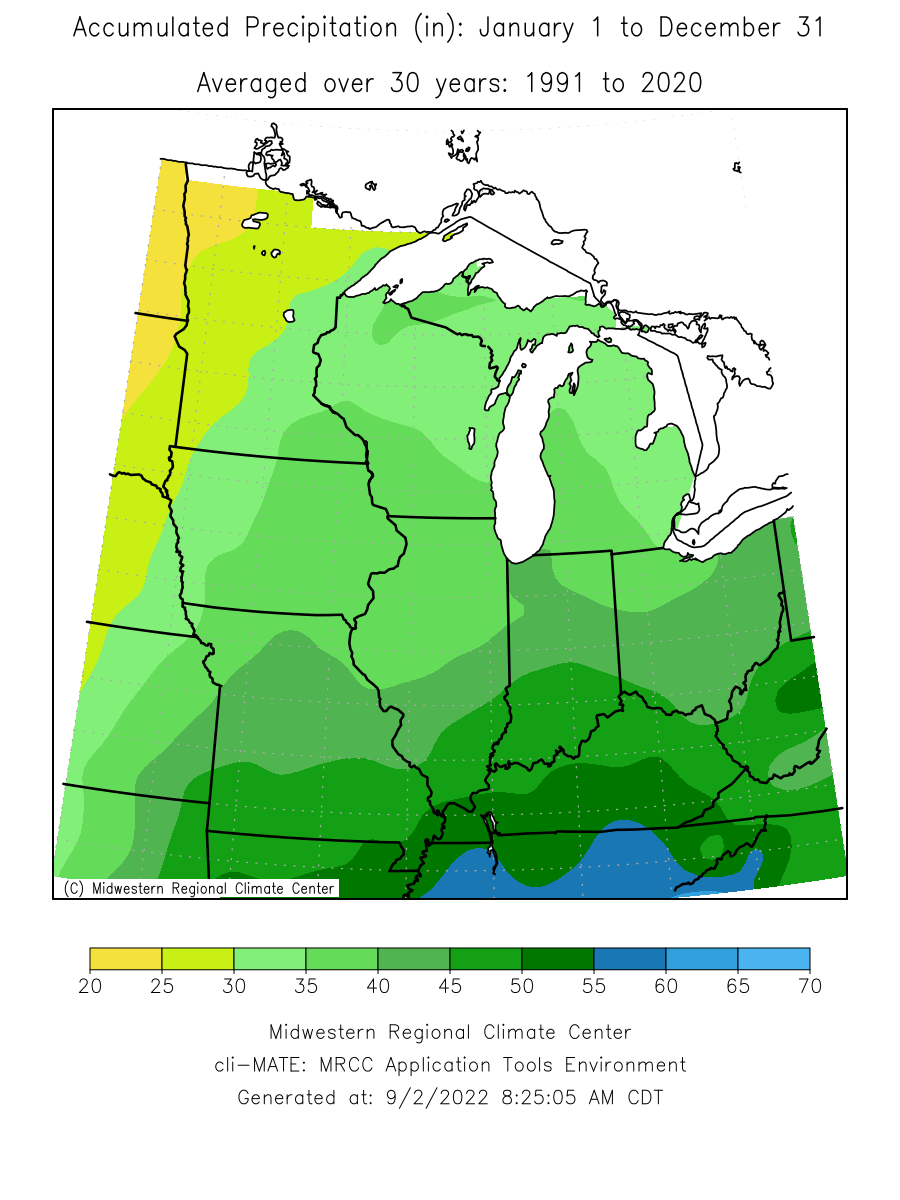 To understand how weather factors influence drought, one needs to consider important aspects of the Midwestern climate. The average annual precipitation across the Midwest ranges from around less than 25 inches in extreme northwestern Minnesota to over 50 inches in southern Kentucky. The annual variability of rainfall in the Midwest is largely a result of the distribution of thunderstorms. Areas with a high frequency of thunderstorms have more rain but more variability in their annual rainfall. A dry period often has a near normal number of days with measurable rain, but when it rains, the rains are often more spotty and less intense than in wetter periods.
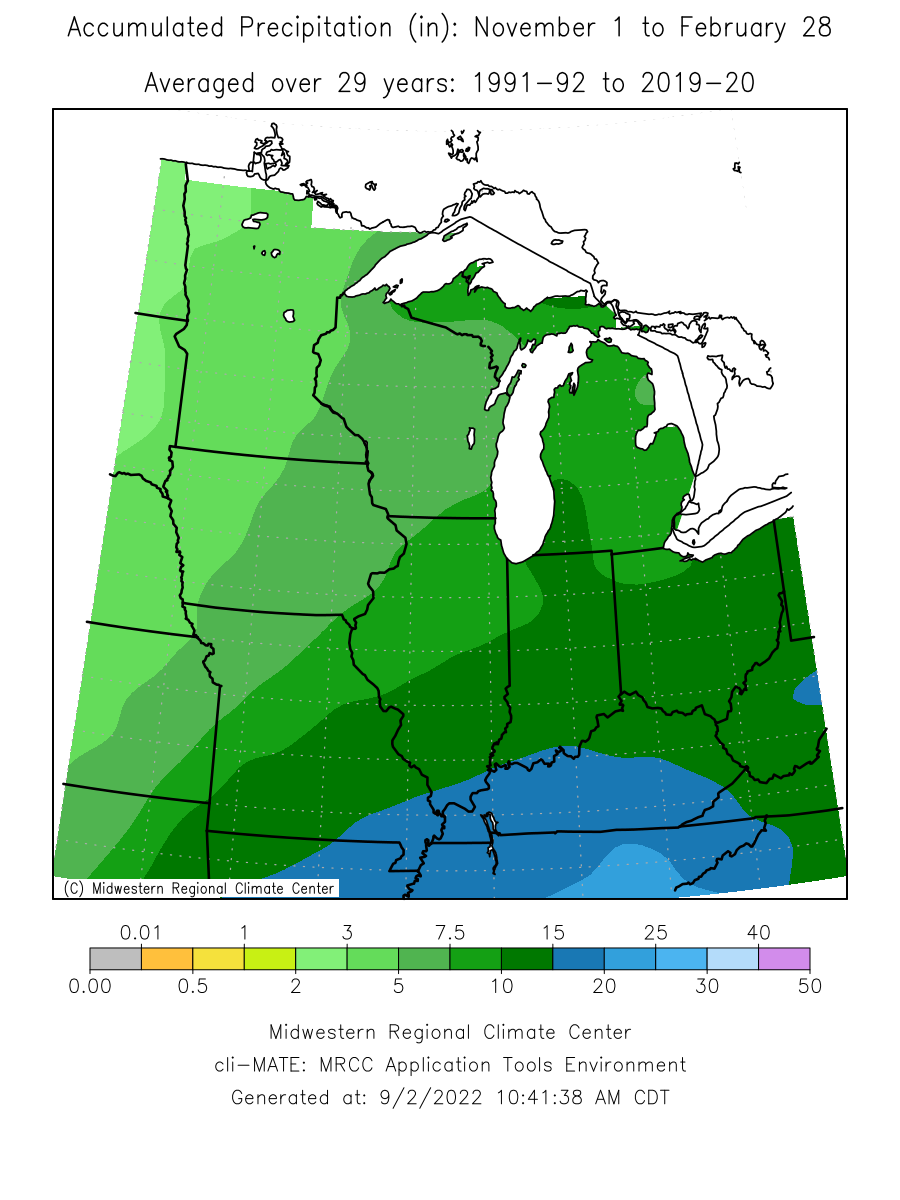
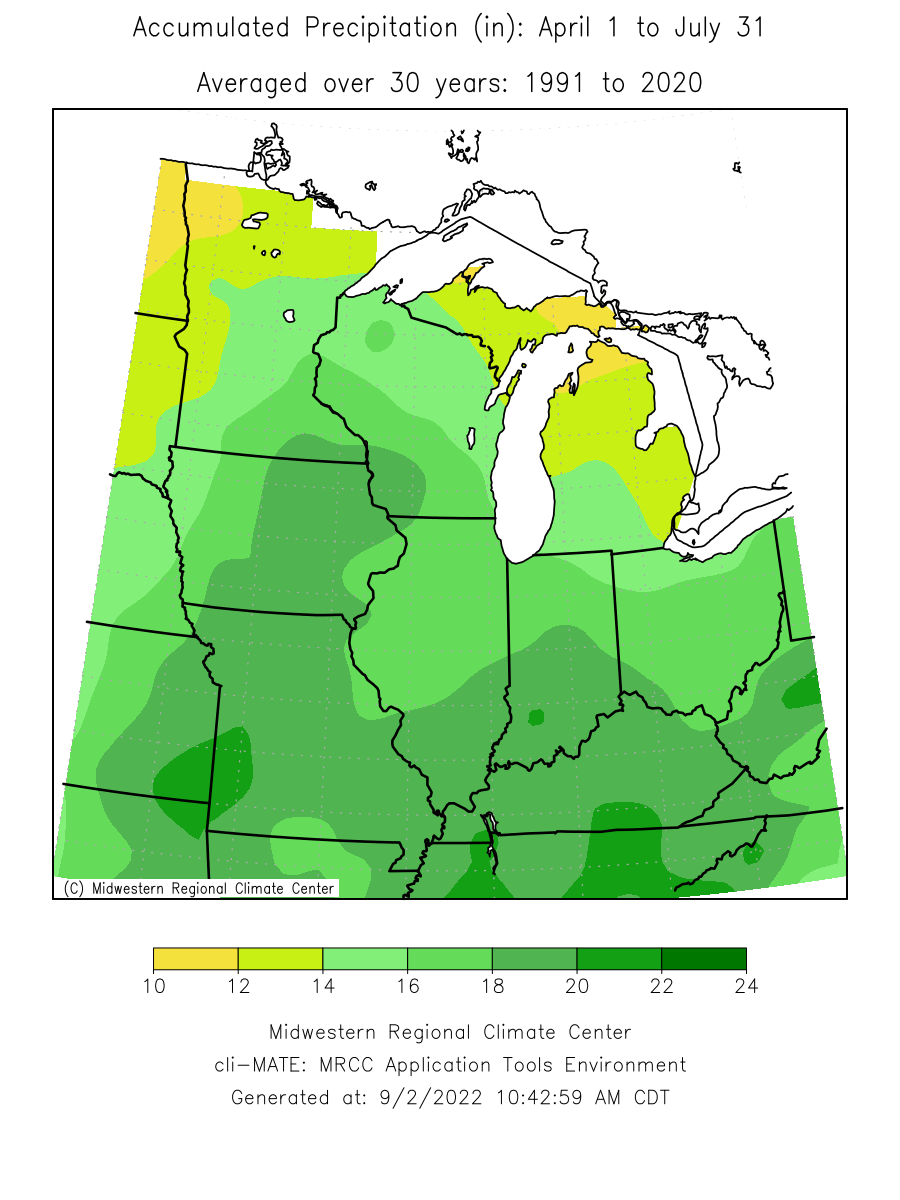
The winter months typically have less precipitation than other months with the lowest average monthly precipitation in January or February. April, May, June, and July are typically the wettest months. In the past, droughts have been more severe where the difference from warm season to cold season is the greatest.
The Weather Factors
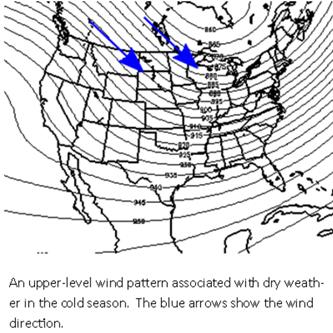 Several atmospheric conditions help cause a drought. Wind patterns four to five miles above the ground affect the speed and orientation of rain-bearing frontal systems as well as the flow of moisture into the Midwest. Dry weather is most likely in the cool season when winds in the upper atmosphere over the Midwest blow from the northwest to southeast. If this pattern persists, dryness can develop.
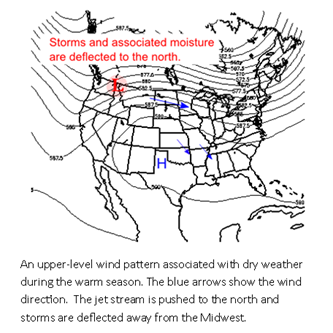 During the warm season, fronts trigger most showers and thunderstorms. Drought can be initiated or worsened when a large, warm high pressure system settles in over the Midwest and Central Plains. Storm systems and fronts which normally might bring showers and thunderstorms are either deflected to the north or are weakened considerably by the high pressure system. In addition, the high pressure can prevent the flow of moisture from the Gulf of Mexico into the Midwest. Even when frontal systems do move through, there may not be enough moisture available for heavy widespread rain to develop.
The Role of Temperature and Evapotranspiration
Temperature also plays a role in drought severity. Droughts often, but not necessarily, are associated with periods of excessive heat, which in turn causes more evapotranspiration.
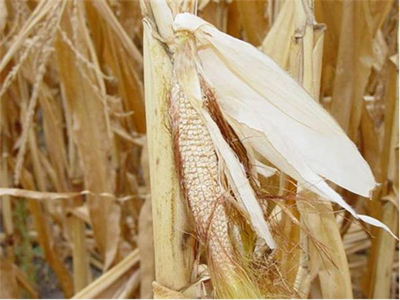
Evapotranspiration (E-T) is the combination of evaporation from the soil and transpiration from plants. Soils begin to dry and plants are affected when the rate of E-T exceeds the rate of precipitation accumulation. Often there is a feedback effect that helps to further the development of drought. As soils dry there is less water available for plants to transpire into the atmosphere. During the growing season, especially in the Midwest, corn and soybeans can make a significant contribution to atmospheric moisture. When that source of moisture is  reduced, there is less moisture available for the development of showers and thunderstorms.
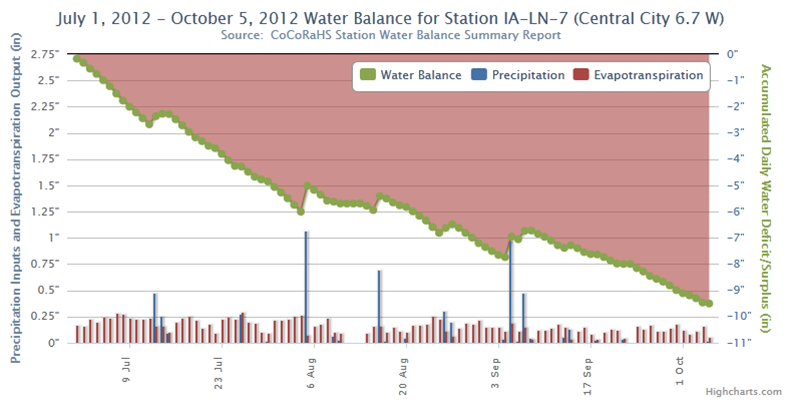
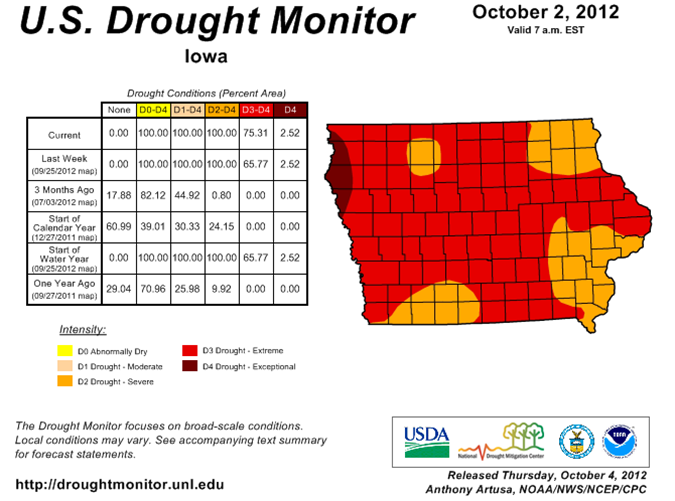
The role of E-T can be seen in the chart [below]. This chart depicts both E-T and precipitation over a period of four months during the growing season at a location in Linn County in eastern Iowa. When the water balance (precipitation minus E-T) is negative, net drying is occurring. This location has a water balance of –9.29 inches, meaning the E-T has exceeded precipitation by that amount over the course of this period. The U.S. Drought Monitor correspondingly shows that Linn County, Iowa is experiencing Extreme Drought.
The Environmental Factors
The deficiencies in precipitation and higher than normal temperatures which bring on drought conditions are first seen in other parts of the hydrological cycle. Initially, less surface runoff occurs and less water percolates into the ground. The first major environmental effects that are evident are lower soil moisture and reduced streamflows. Relatively higher temperatures lead to more evaporation. As a result less water flows to urban and recreational reservoirs and farm ponds.
The decreased soil moisture means less water into shallow groundwater aquifers that supply many wells, which in turn reduces the groundwater recharge to streams. It also leads to poorer plant growth, affecting crops, gardens, and other plant life. Drier conditions lead to increased numbers of certain insects and to more wind erosion.
The Human Factors
Many times a drought is aggravated by human activities, or lack of them. A drought for a municipality occurs with a public water supply shortage. This results from reduced streamflow to a reservoir, but the "drought" will appear sooner if the reservoir has become heavily silted, or if usage of water has increased with time. What may be a drought for one city or village may not be for another if their supply lakes are different in size or condition. Inadequate maintenance of reservoirs, leaky distribution systems, waste of water, and lack of adjustment to population and industrial growth are some of the things that can make a municipality more susceptible to drought.
What Makes a Dry Period a Drought?
Drought is a period when precipitation is significantly below normal. Percentage of normal precipitation is often used to define drought severity, since this allows a comparison of both relative and absolute magnitudes of precipitation deficiency.
Frequencies of droughts of various lengths and their severity across the region are important considerations in the design of water structures. Droughts may last only a season, or they can span multiple years. A “flash drought” is one that develops quickly over a period of weeks, usually as a result of high temperatures and high rates of evapotranspiration, and little rainfall.
Streams and Rivers 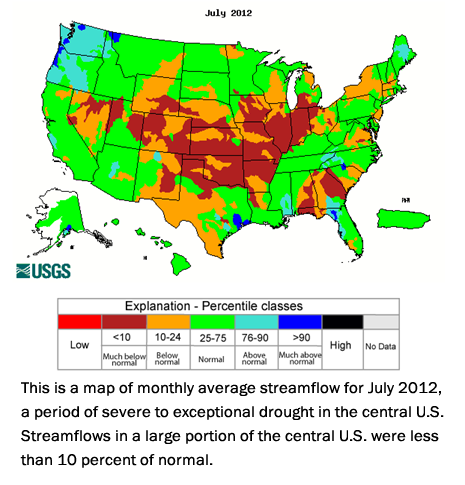
Streamflow normally varies seasonally reflecting normal variations in precipitation, evapotranspiration, and the storage of groundwater and soil moisture. The base flow of a stream is the water in a stream that results from subsurface runoff (groundwater and soil moisture).
During the cold season (October-March) when evapotranspiration is low, soil moisture usually builds up to nearly saturated levels. By February and March, when soil moisture is usually very high and/or the ground is frozen, about 60% of all precipitation becomes runoff and the flow in rivers and streams is high. During the warm season (April-September) when transpiration from plants and evaporation from surface water is high, groundwater and soil moisture levels are reduced. This is why the flow in streams is normally the lowest during the summer. In August and September, when evapotranspiration is high and soil moisture is being used by growing crops, streamflow volume is normally less than 10% of rainfall volume. This is why many droughts, as measured by streamflow, begin in the warm season.
These relationships between precipitation, water storage, evapotranspiration, and streamflow change markedly during a drought. In the early months of a drought, runoff becomes less and soil moisture is depleted because rainfall is below normal. As the soil moisture to supply plants and shallow groundwater decreases, a higher percentage of whatever precipitation occurs goes toward replenishing the soil moisture and thus a lesser amount goes to runoff and streamflow. The effect on streams is more serious in areas where the highest proportion of streamflow comes from surface runoff, and less serious where a greater percentage of streamflow comes from groundwater.
Urban water shortages during drought are most likely and droughts more severe in areas where the public water supplies are from surface impoundments.
Lakes and Reservoirs
Most lakes and reservoirs used for public water supplies are fed by streams. Large reservoirs supplied by major streams are able to withstand most droughts. However, smaller reservoirs and farm ponds used as water supplies are susceptible to drought-induced deficiencies. They depend on the high streamflow that usually occurs in the spring. If low streamflow conditions develop in the spring, there is a risk that they will continue into the summer and fall, when runoff from even normal precipitation is relatively small. These smaller water supplies are likely to suffer shortages that could persist until the following spring, when conditions would again be favorable for surplus streamflow. Low streamflows in the spring are uncommon, but when they do occur they indicate that a serious drought condition exists.
Groundwater Conditions During Drought
As with surface water, groundwater is affected by precipitation, but the effects are not as immediate and are prolonged to a greater extent. Groundwater levels are affected not only by precipitation, but also by evapotranspiration, runoff to streams, and pumpage from wells. In general, recharge to groundwater occurs whenever precipitation exceeds evapotranspiration and soil moisture demands.
Recharge to shallow aquifers near the surface can occur at relatively high rates, especially when the aquifers are composed of thick deposits of sand and gravel, which can rapidly store large amounts of water. Shallow aquifers, therefore, respond relatively quickly to precipitation events. When recharge ends, water levels in these aquifers begin to decline as groundwater moves toward discharge areas or is depleted by plants or pumpage. Prolonged dry periods significantly affect water levels in shallow aquifers.
By contrast, aquifers are often buried below materials that do not allow percolating water to pass through them rapidly. This material, called drift, was deposited by glaciers to thicknesses which often exceed 50 feet. During wet periods, the rate of recharge to the shallow aquifers may far exceed the rate at which water can move downward through drift material to the deeper aquifers. This excess is either stored in the shallow zones or runs off to streams. The shallow aquifers, in essence, act as reservoirs from which the groundwater can percolate slowly downward to replenish the deeper aquifers. Thus, recharge to deep aquifers is buffered from short-term precipitation events and deficits, and there is a lag time before these aquifers begin to show the effects of extended drought.
Drought Impacts
 The severity of a drought is usually defined by its impacts on the water needed by man and the environment. How fast conditions reach serious levels depends on the severity of the weather and on the area's soils, physiography, natural vegetation, human settlement, and land uses. The National Drought Mitigation Center (NDMC) maintains the Drought Impact Reporter , a comprehensive database of drought impacts collected from a variety of sources, including the general public.
A drought’s harmful effects are often accompanied by certain benefits. Those who can haul water and drill wells often reap financial gain. Droughts also often cause certain affected communities to make needed improvements in their water supplies. These can include dredging silt out of a reservoir, increasing the spillway level, repairing leaks in the urban supply systems, or developing a major new supply, such as a larger lake or new wells. Such efforts cost money, but provide immediate employment opportunities and financial benefits to contractors. More importantly, the improvements make the community more resistant to the effects of future droughts.
Response to Drought
There are both immediate and long-term responses to drought. Immediate actions are those employed to cope with the acute problems caused by drought. These might include water use restrictions in urban areas, or hauling water in rural areas. Long-term responses are those used, for example, after a drought to lessen the impacts of a subsequent drought. The remedial activities fall into two broad categories:
• Conserving water
• Obtaining new sources of water
Conservation of Water
Conservation, unfortunately, is often only employed during drought. It can be attained by a variety of voluntary actions, by legislative incentives and by pricing of water. In households, flow restrictors can be installed on faucets, toilet tank capacities reduced, and if necessary, certain waste water caught and reused. In cities, water use can be restricted at car washes and for lawn watering, and water use in schools and other institutions can be reduced. Leaks in urban supply systems can be located and repaired.
Conservation can be voluntary, but often needs encouragement from local government or the water supplier. Urban and county government agencies can set fines for wasting water and set limits on usage. Water companies can also set higher rates that lead to reduced usage. A sustained conservation effort in non-drought periods employing the above actions, however, requires public education about the value of water, an understanding of the relationship between water quality and quantity, and awareness by municipalities and private water companies of more correct water pricing.
Finding More Water
In some cases, cities critically affected by drought can obtain larger supplies of water by effectively enlarging their reservoirs (by raising the spillway level or by dredging the silt from the reservoirs), by drilling new wells, and by constructing pipelines to larger water supplies. Most of these projects usually take months to years to accomplish, however, and therefore require advance planning and sources of added funding.
Rural dwellers, especially farmers, have sought more water by other means. They too drill more or deeper wells, and pay to have water hauled. They have also utilized cloud seeding projects to increase summer rainfall, have switched to irrigation, and in some cases have used monomolecular chemical films (hexadecanol) that can be spread over farm ponds to reduce evaporation.
A sustained conservation effort in non-drought periods requires public education about the value of water.
Dealing with Drought
The Federal Emergency Management Agency estimated in 1995 that drought costs the United States an average of $6 to 8 billion a year. The 1988 drought cost an estimated $71.2 billion and 7,500 heat-related deaths. Reacting after the fact is expensive, while planning and mitigation are usually more efficient and cost-effective in dealing with drought. We cannot prevent drought, so the best way to deal with drought is to plan for it.
 An excellent resource for drought planning is the National Drought Mitigation Center (NDMC) . The NDMC has information on the planning process, a list of and links to state drought management plans, and information on Drought-Ready Communities. There are also sector-specific resources for farmers, ranchers, and homeowners, and water conservation information. The NDMC web site also provides basic information on drought and drought monitoring tools. The NDMC also hosts the U.S. Drought Monitor .
 The National Current Conditions is part of the National Integrated Drought Information System (NIDIS). NIDIS is a multi-agency partnership that coordinates drought monitoring, forecasting, planning, and information at national, state, and local levels across the country. Develops leadership and partnerships to ensure successful implementation of an integrated national drought monitoring and forecasting system at federal, state, and local levels. Collects and integrates information on the key indicators of drought to make usable, reliable, and timely drought forecasts and assessments. Fosters and supports a research environment that focuses on risk assessment, forecasting, and management. Provides accurate, timely, and integrated information on drought conditions and associated risks to facilitate proactive decision making. Offers a framework for increasing public awareness and education on how and why droughts occur, and how they impact human and natural systems.
Other Drought Resources
Drought-Ready Communities: A Guide to Community Drought Preparedness
The guide is the result of a two-year pilot project to develop “drought-ready” communities . The Guide can help communities identify their drought monitoring resources so they can spot emerging drought. A planning section helps communities determine steps they can take to reduce their drought risk ahead of time. It also recommends planning responses to drought before the next one happens. The Guide includes case studies and an extensive resource collection on how other municipalities have planned for drought, including both processes and solutions.
Ready.gov Kids Pages - Ready Kids!
Emergencies can be scary, but the more you know about them, the better you can deal with what comes your way! This Ready.gov section also has games plus info geared toward parents and educators.
When Every Drop Counts: Protecting Public Health During Drought Conditions—A Guide for Public Health Professionals
This publication, prepared by the Centers for Disease Control is intended to assist public health officials, practitioners, and other stakeholders in their efforts first to understand and then to prepare for drought in their communities.
Drought Preparedness
Information from the American Red Cross on drought and how to prepare your home and your family for drought.
USDA Emergency Preparedness and Response— Drought and Drought Assistance
This is a resource for farmers, ranchers, and others in agriculture.
USDA Farm Service Agency— Disaster Assistance Programs
A complete resource for learning about and applying for disaster assistance.
MRCC Drought Information Page
Maps and Information for drought including soil moisture, precipitation, crop moisture index, estimated precipitation needed, Palmer drought severity and z-index, and drought/precipitation outlooks.