Winter
Winter Tools
Snowfall Climatology Toolbox
 Analyze Midwest snow data |
Accumulated Winter Season Severity Index (AWSSI)
 Determine severity of the winter season |
Daily Snowfall Maps
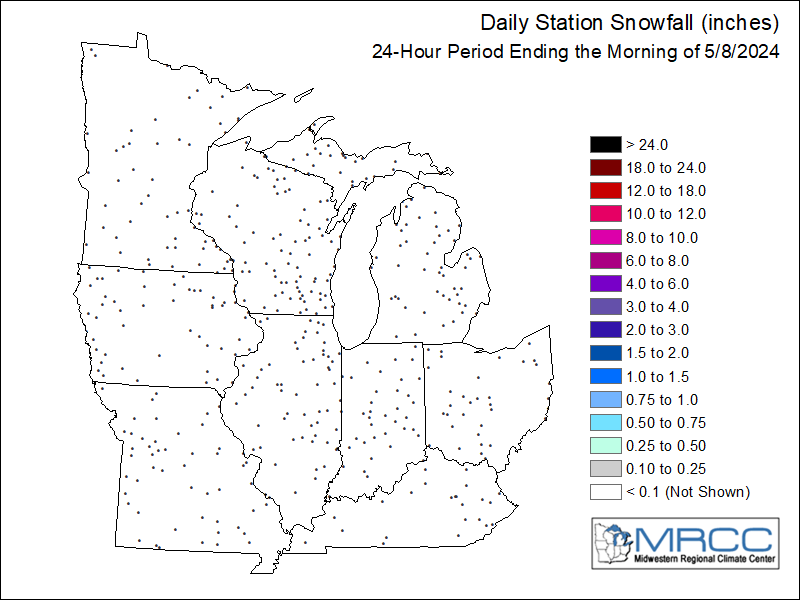 Midwest (Station) |
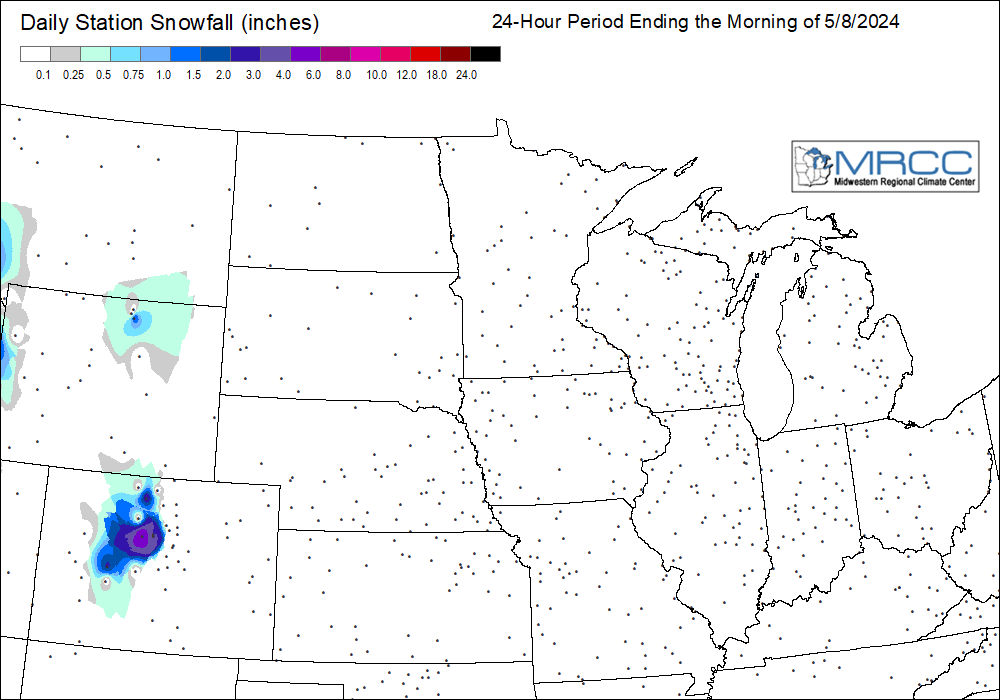 Central (Station) |
 Midwest NOHRSC |
 Central NOHRSC |
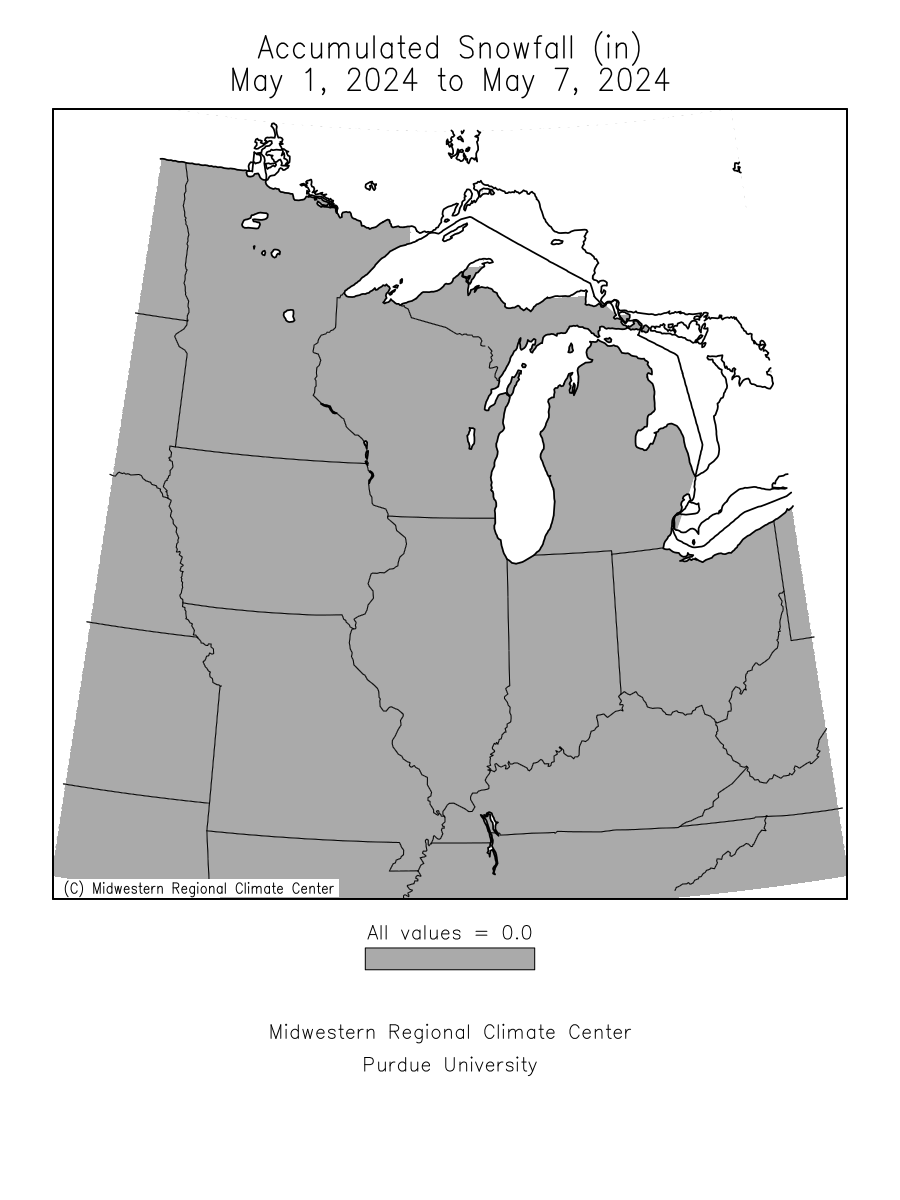
Weekly Snowfall Maps
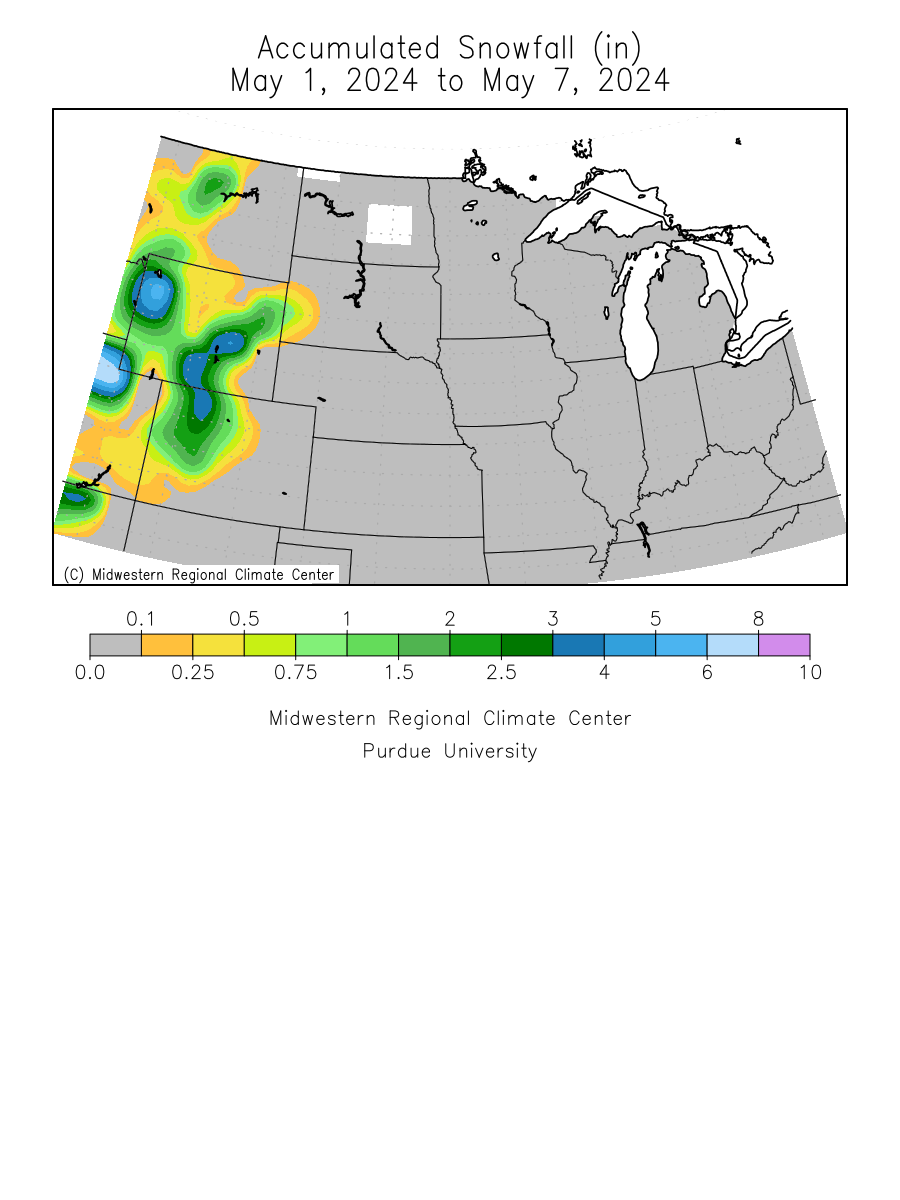
 Midwest Accumulations (Gridded) |
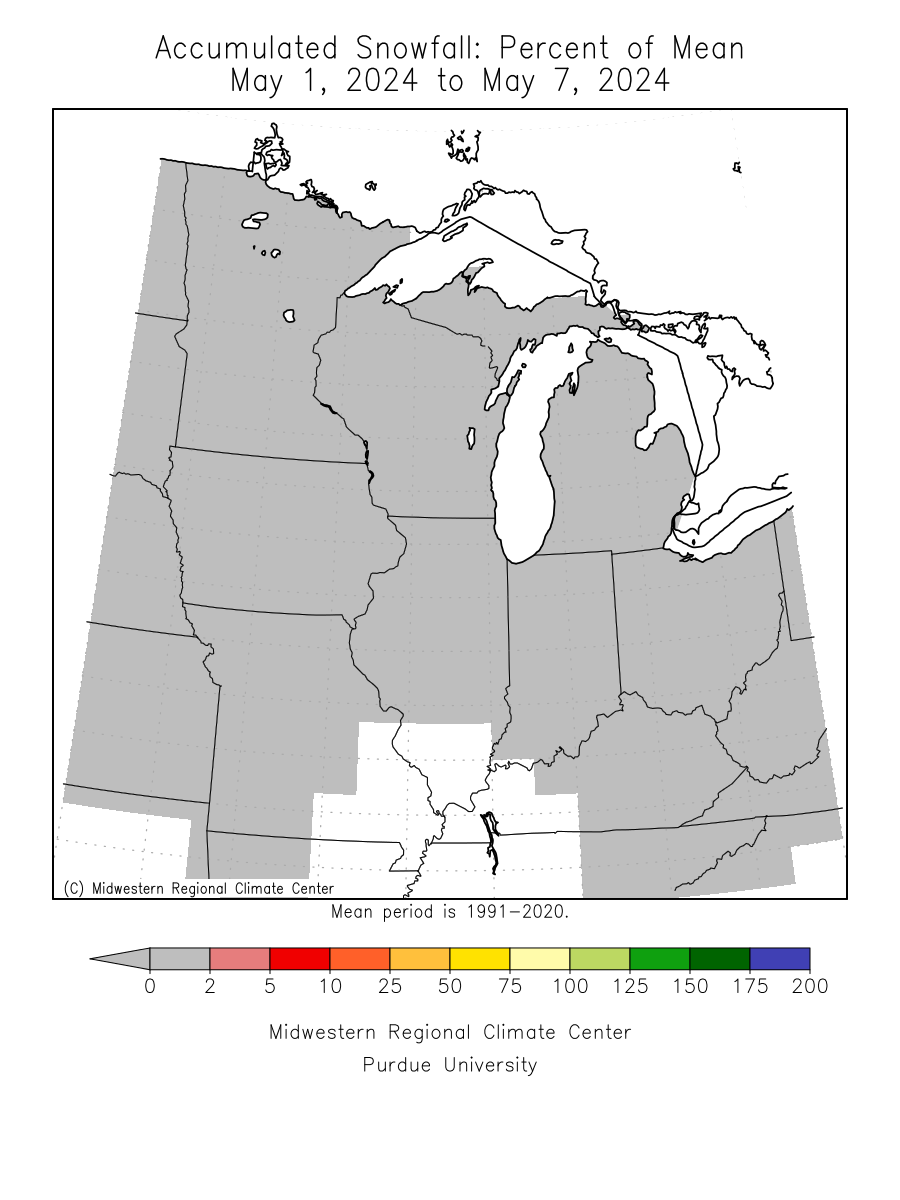
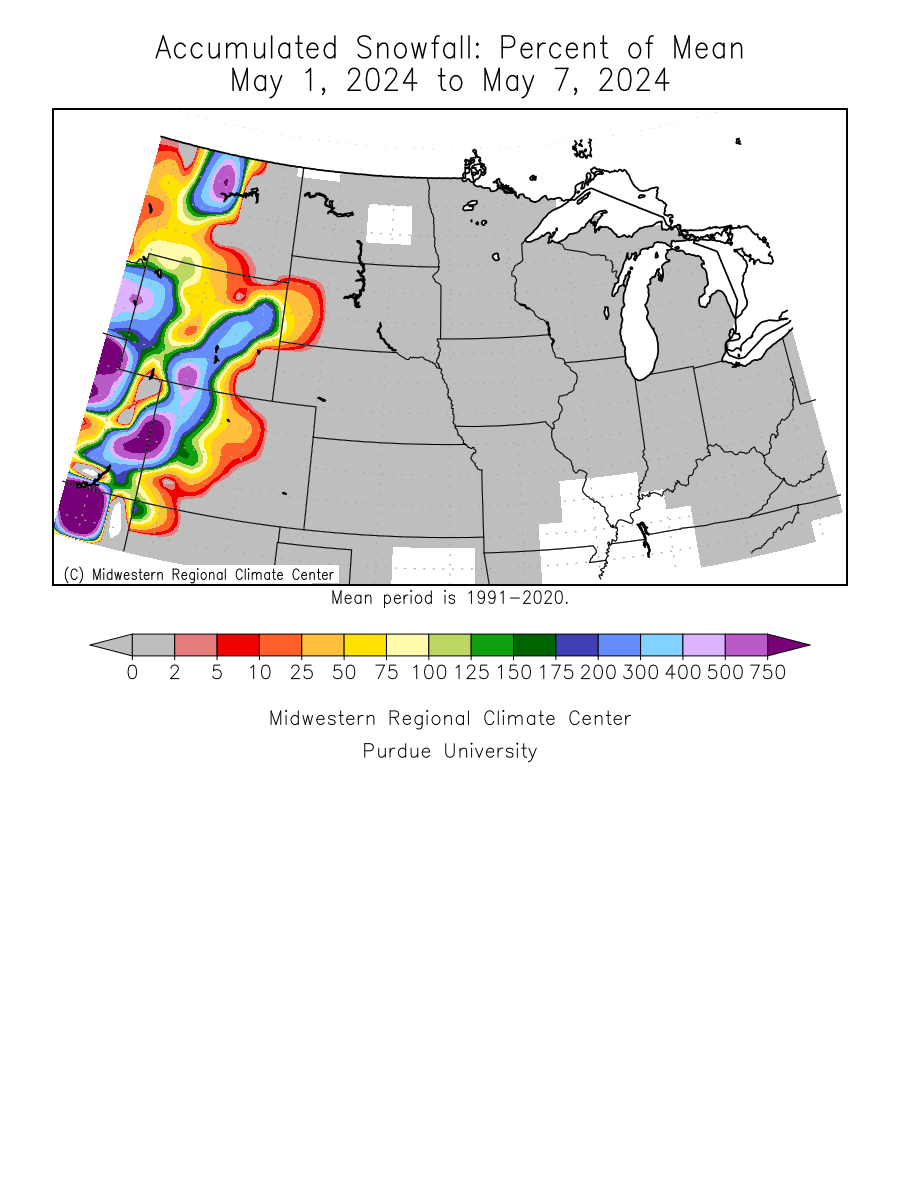
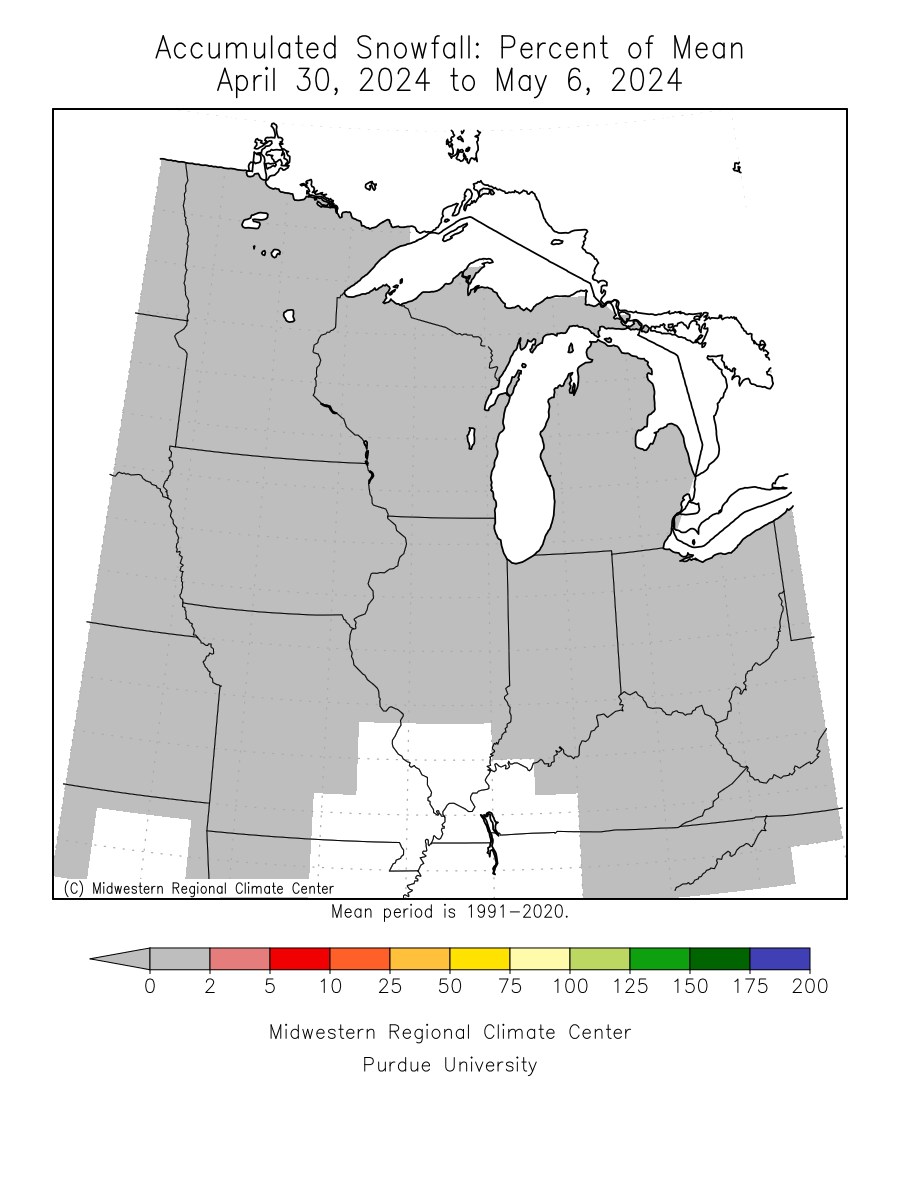 Midwest Percent of Mean Accumulations (Gridded) |
Month-to-Date Snowfall Maps
 Midwest Accumulations (Gridded) |
 Midwest Percent of Mean Accumulations (Gridded) |
 Central Accumulations (Gridded) |
 Central Percent of Mean Accumulations (Gridded) |
Season-to-Date Snowfall Maps
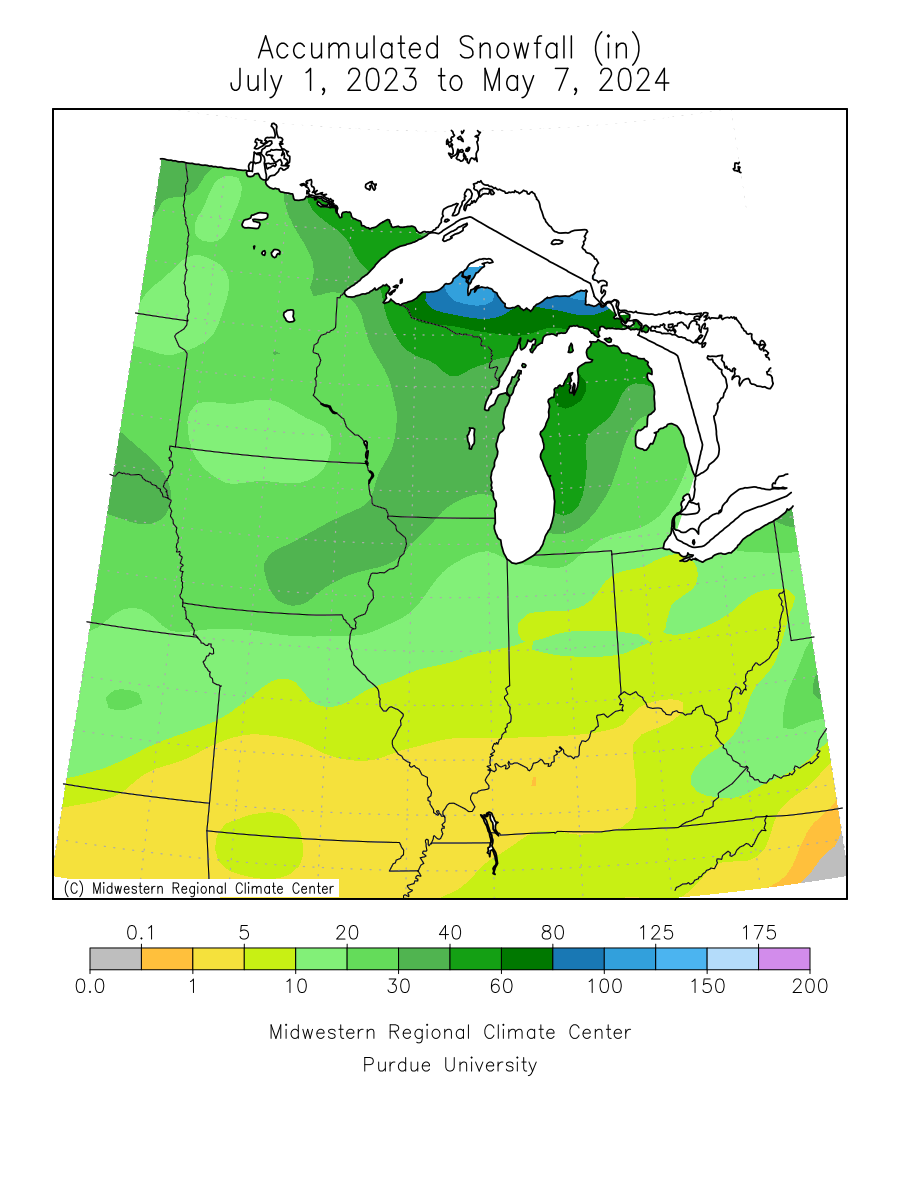 Midwest Accumulations (Gridded) |
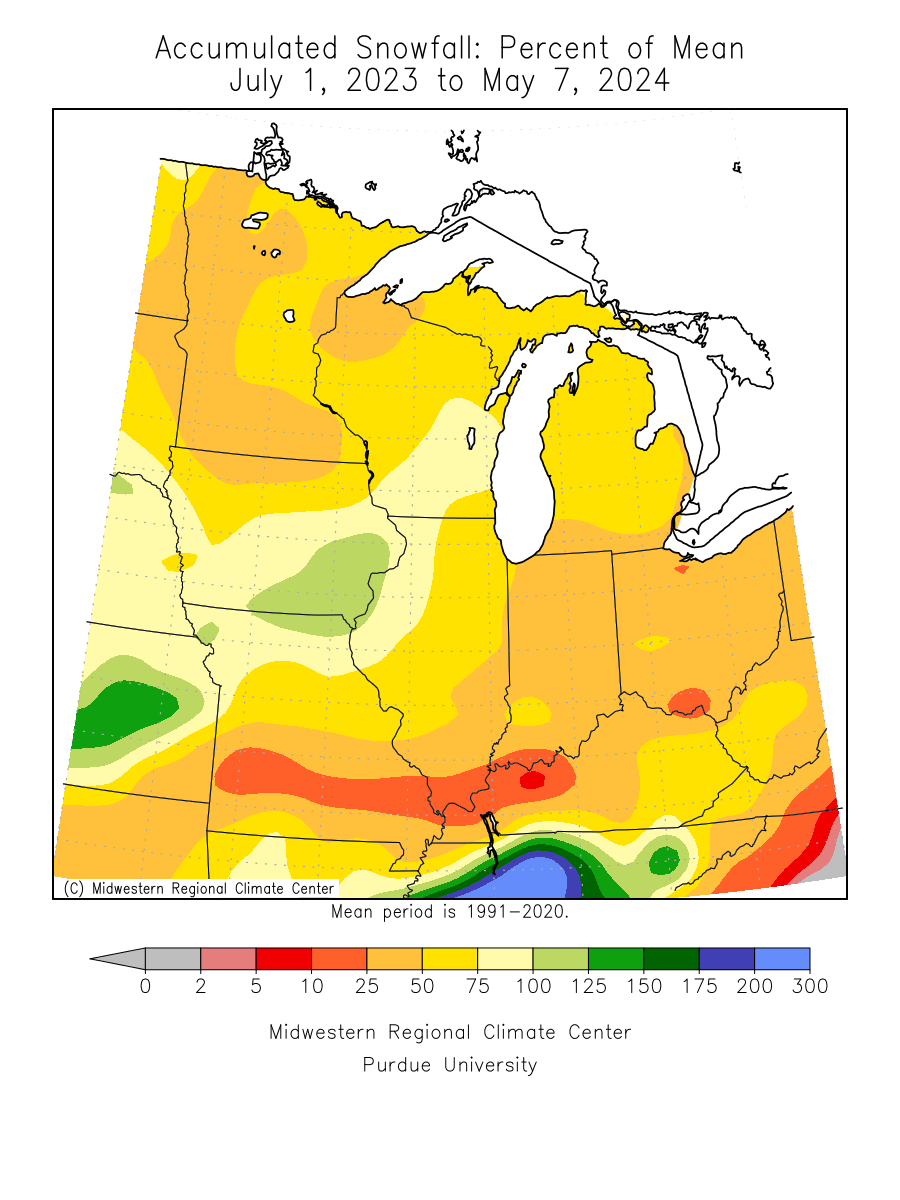 Midwest Percent of Mean Accumulations (Gridded) |
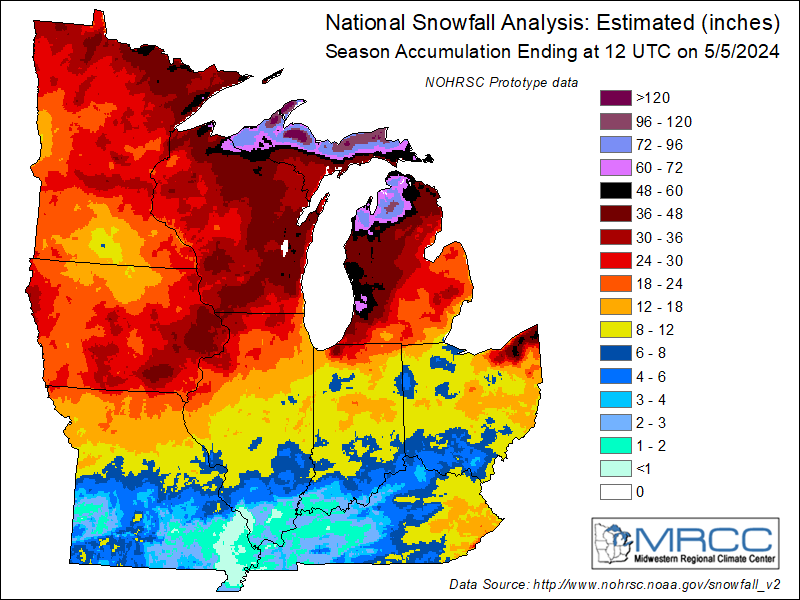 Midwest NOHRSC |
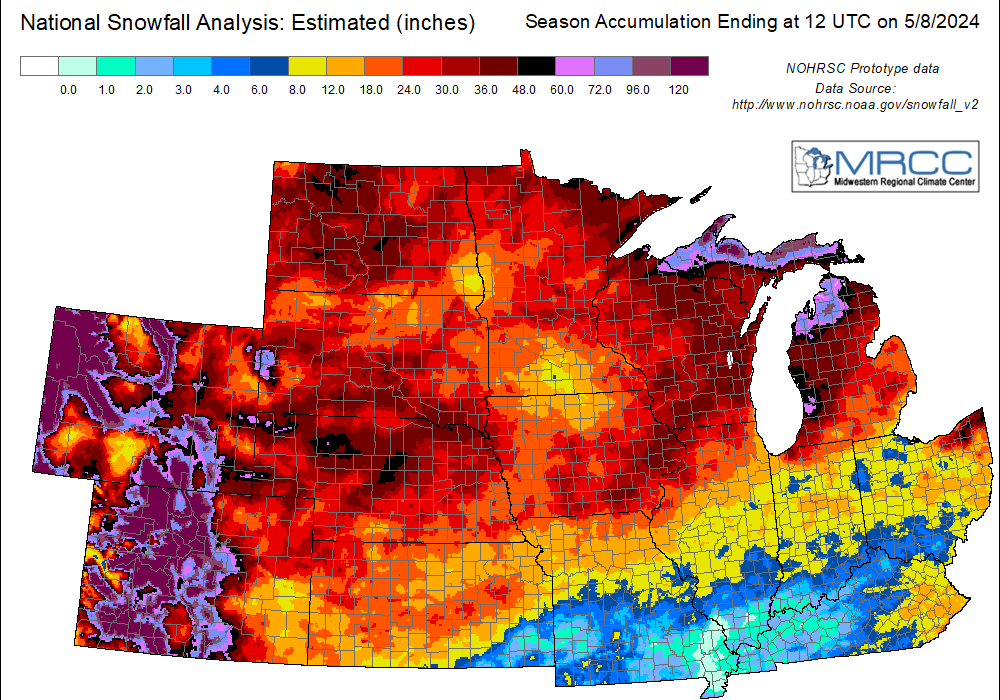 Central NOHRSC |
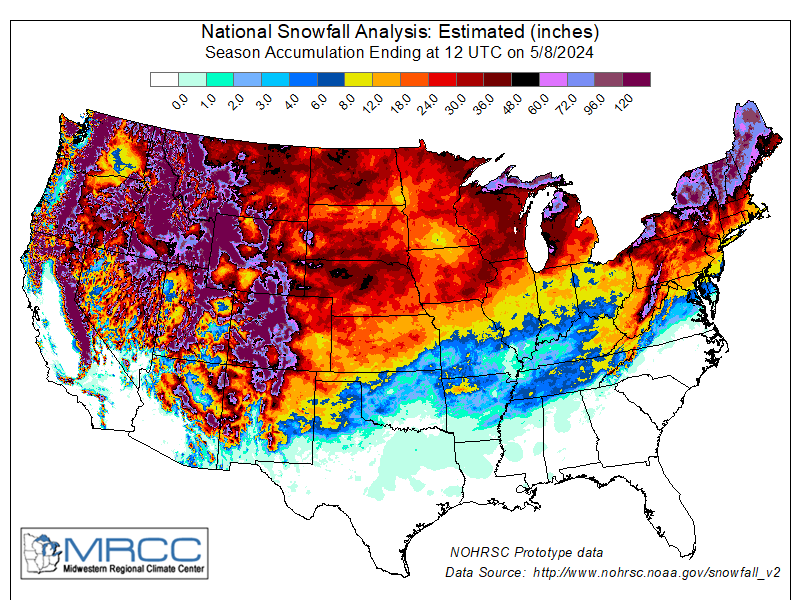 US NOHRSC |
Daily Snow Depths
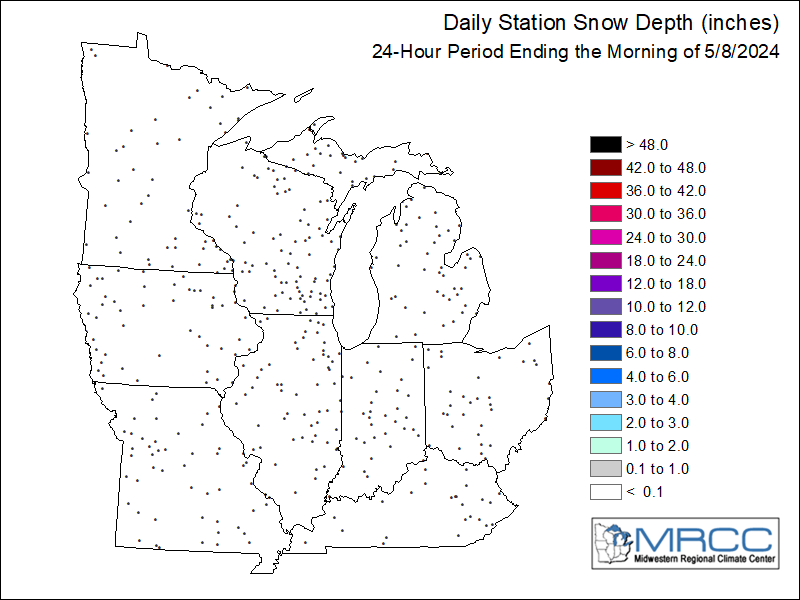 Midwest Station |
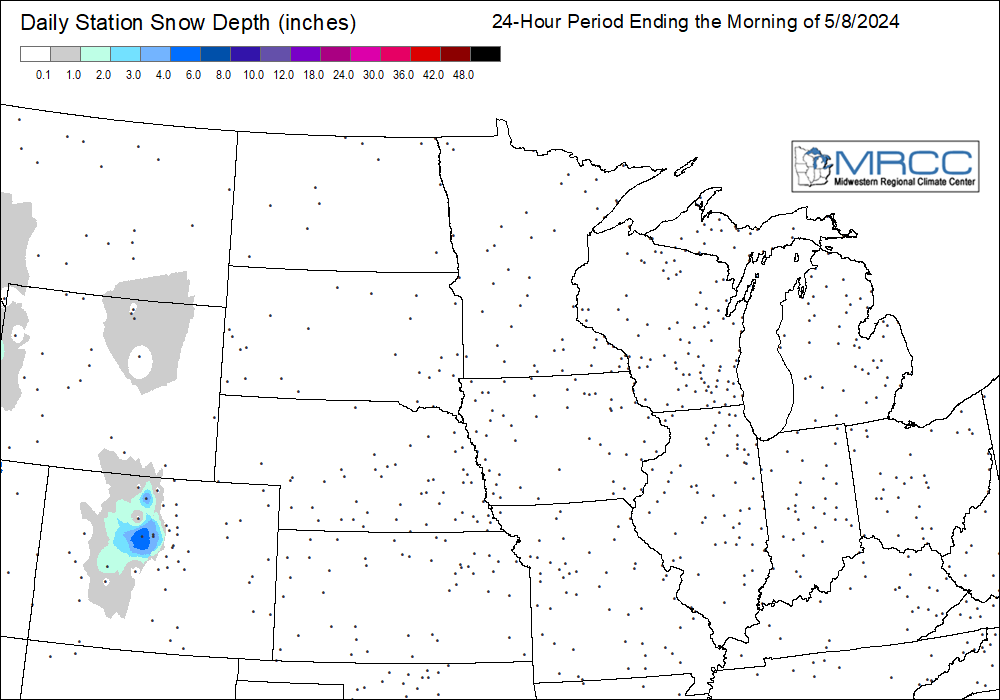 Central Station |
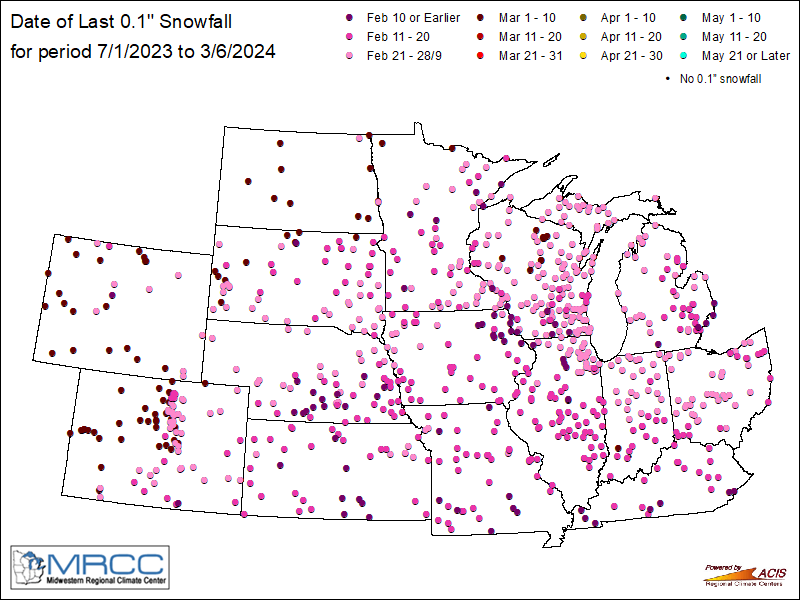
First & Last Snow
| Midwest | 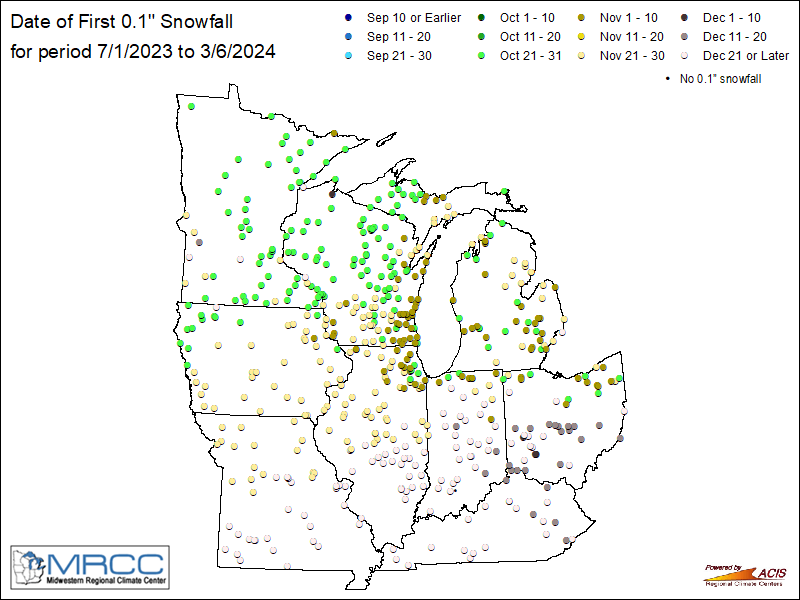 First Snow Current Season |
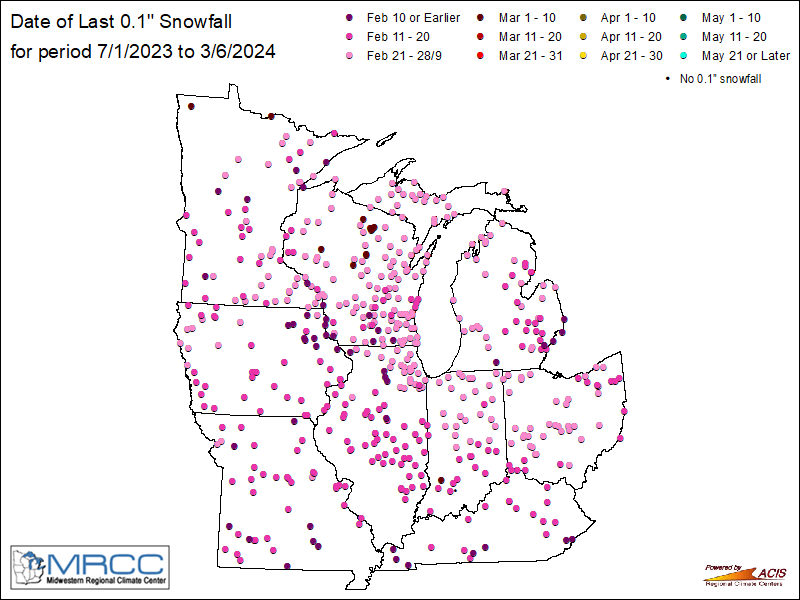 Last Snow Current Season |
|
| Central | 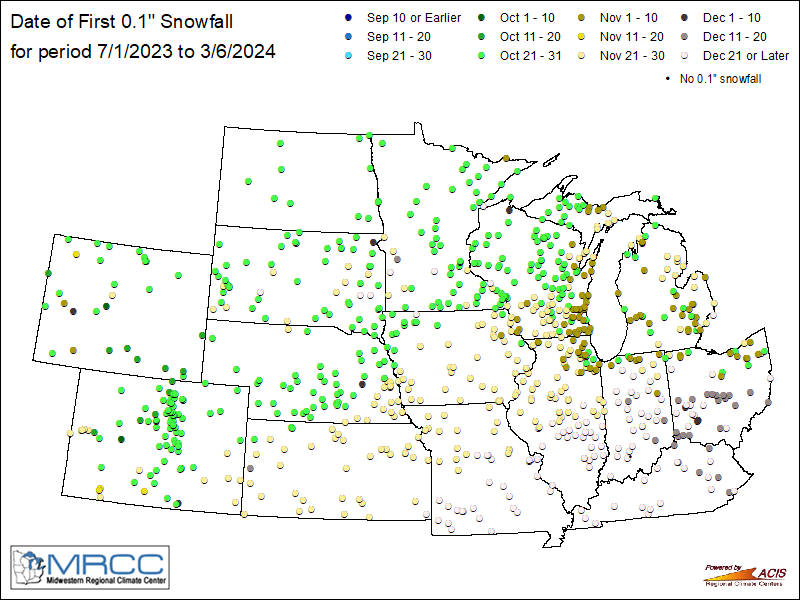 First Snow Current Season |
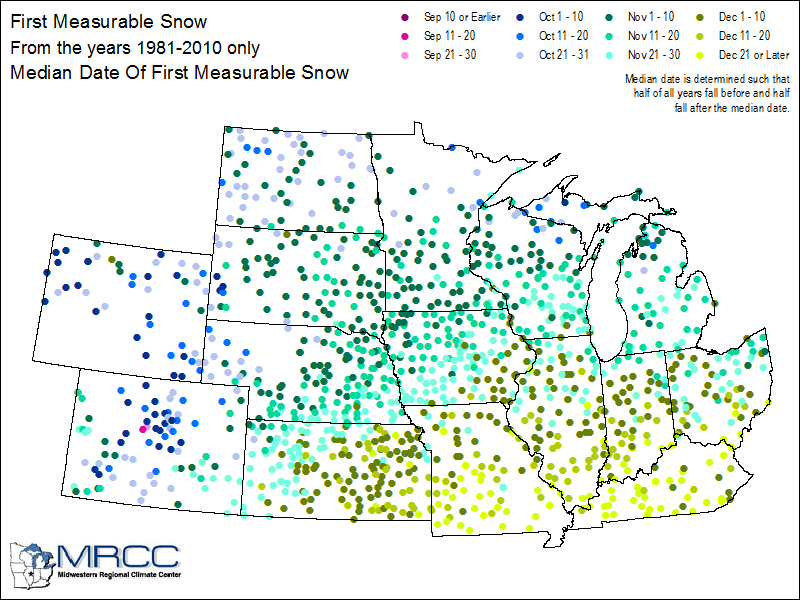 First Snow Climatology |
 Last Snow Current Season |
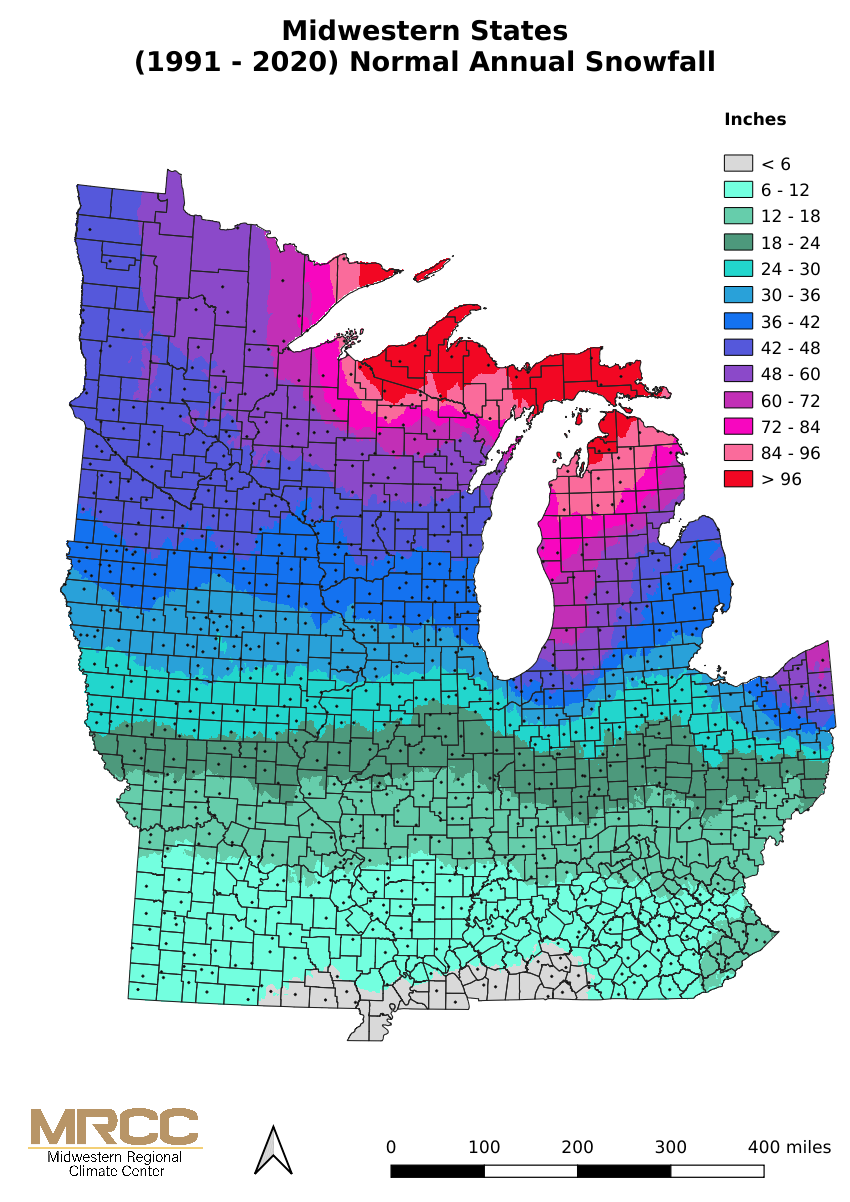
Midwest Normal Annual Snowfall
Spring & Fall Freeze Resources
 Spring Freeze Maps |
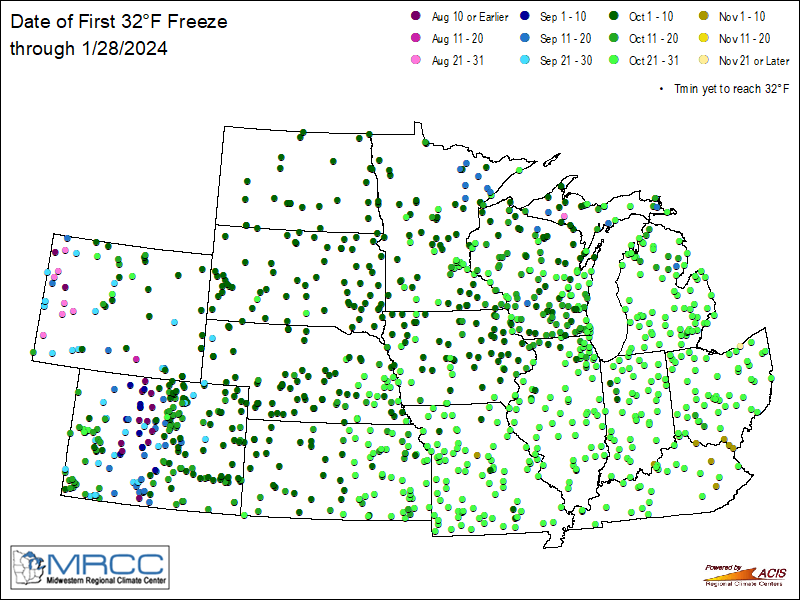
 Fall Freeze Maps |
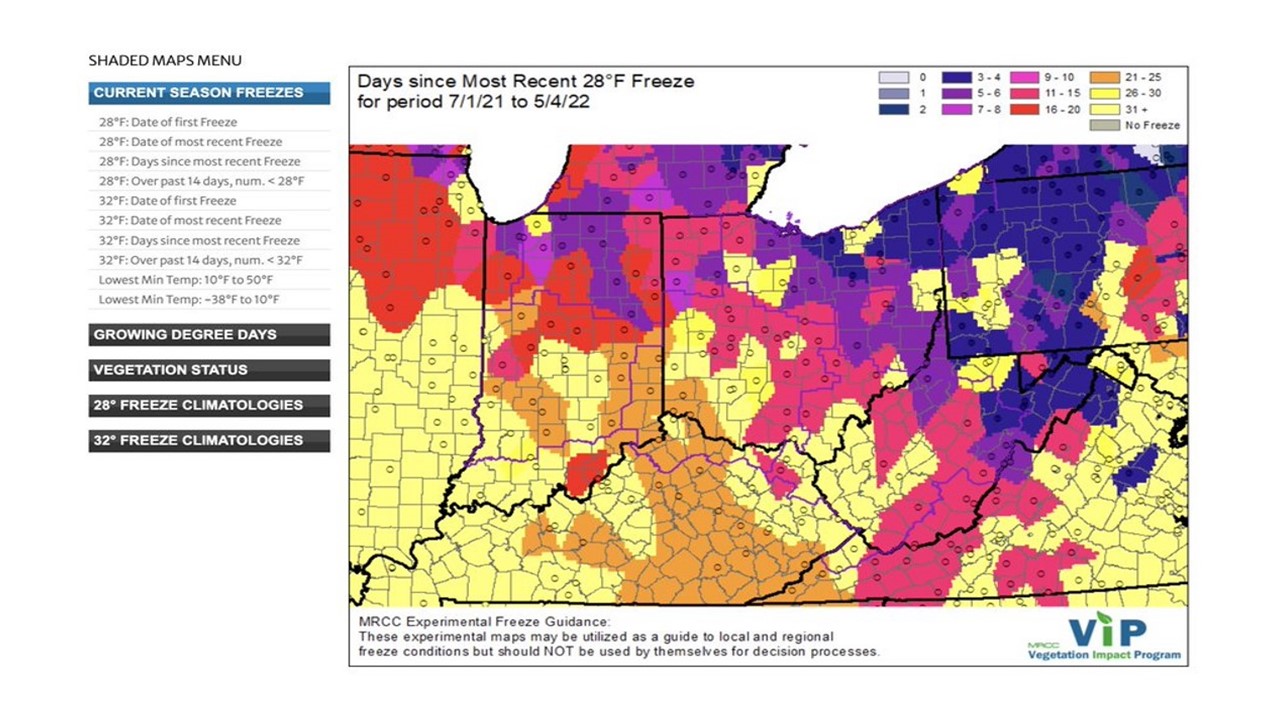 Vegetation Impact Program Vegetation Impact Program |
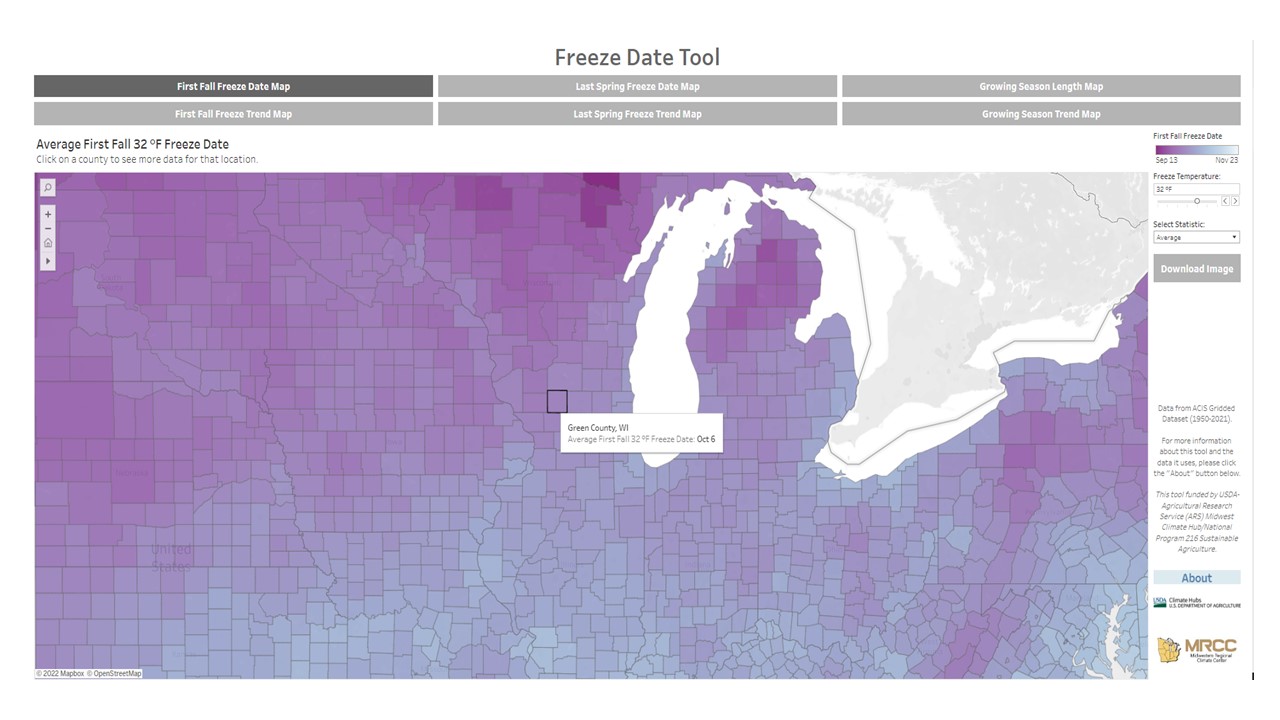 Freeze Date Tool Freeze Date Tool |
Heating Degree Days
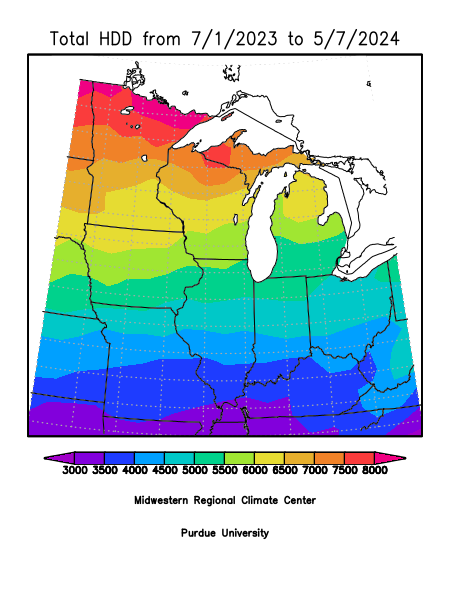 Current Season HDD |
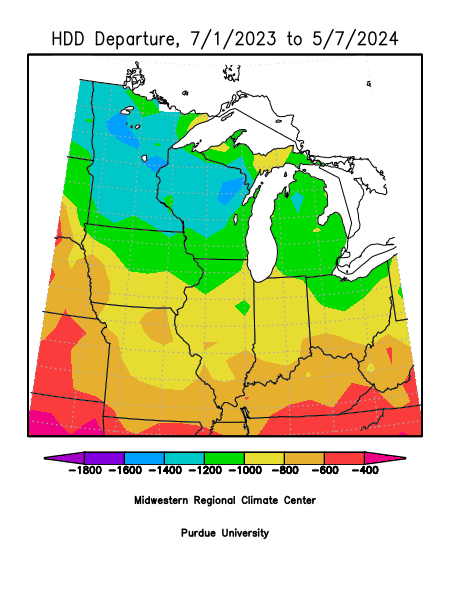 Current Season HDD Departure |
Great Lakes Ice Cover
 Surface Environmental Analysis |
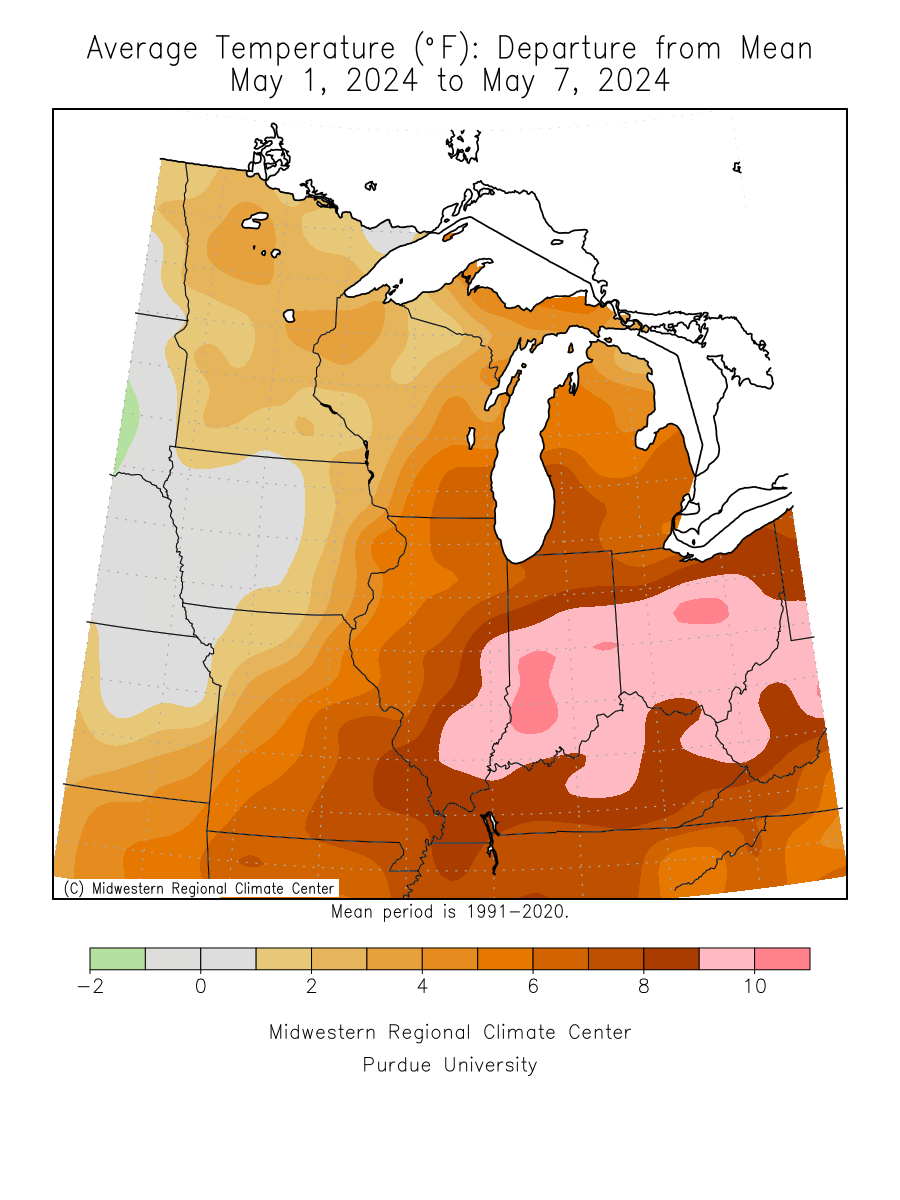
Temperature & Precipitation Maps
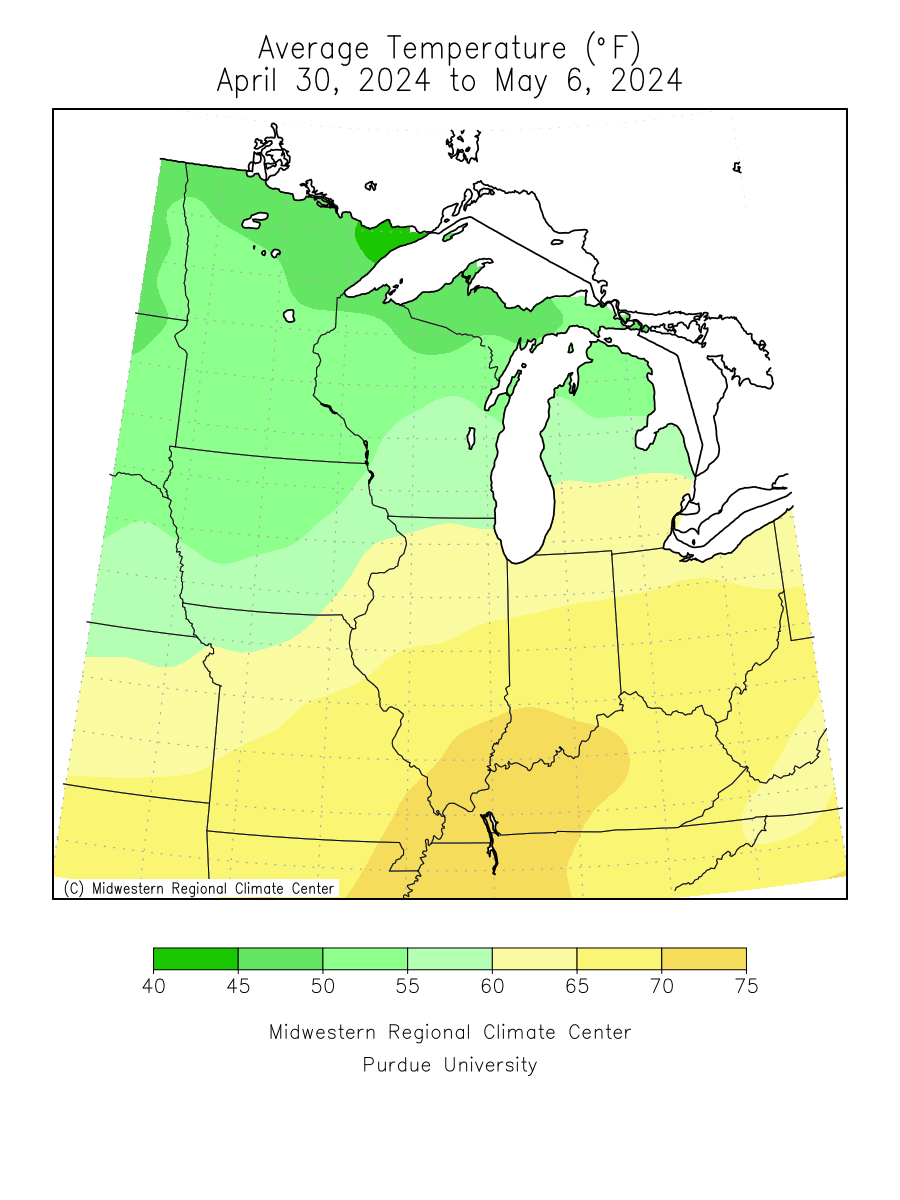 Average |
 Average |
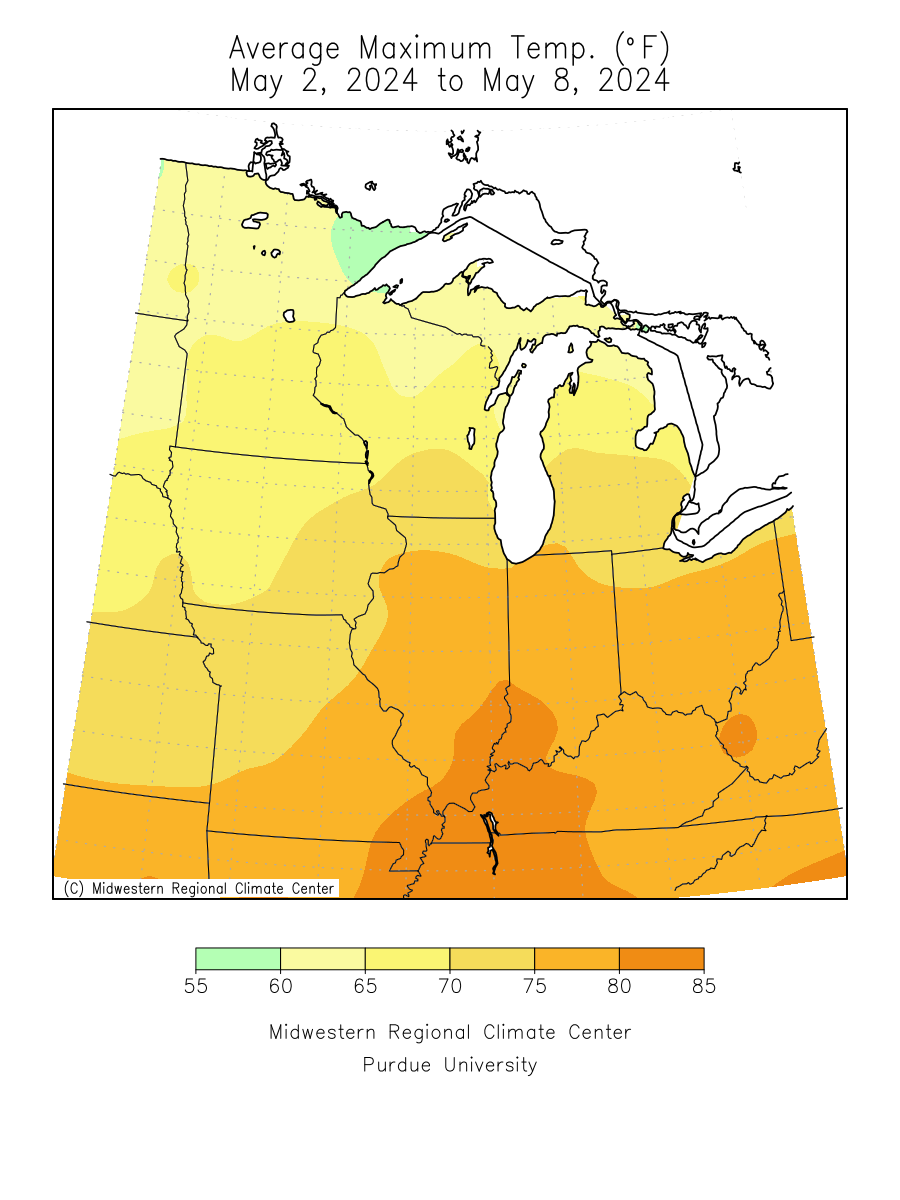 Max |
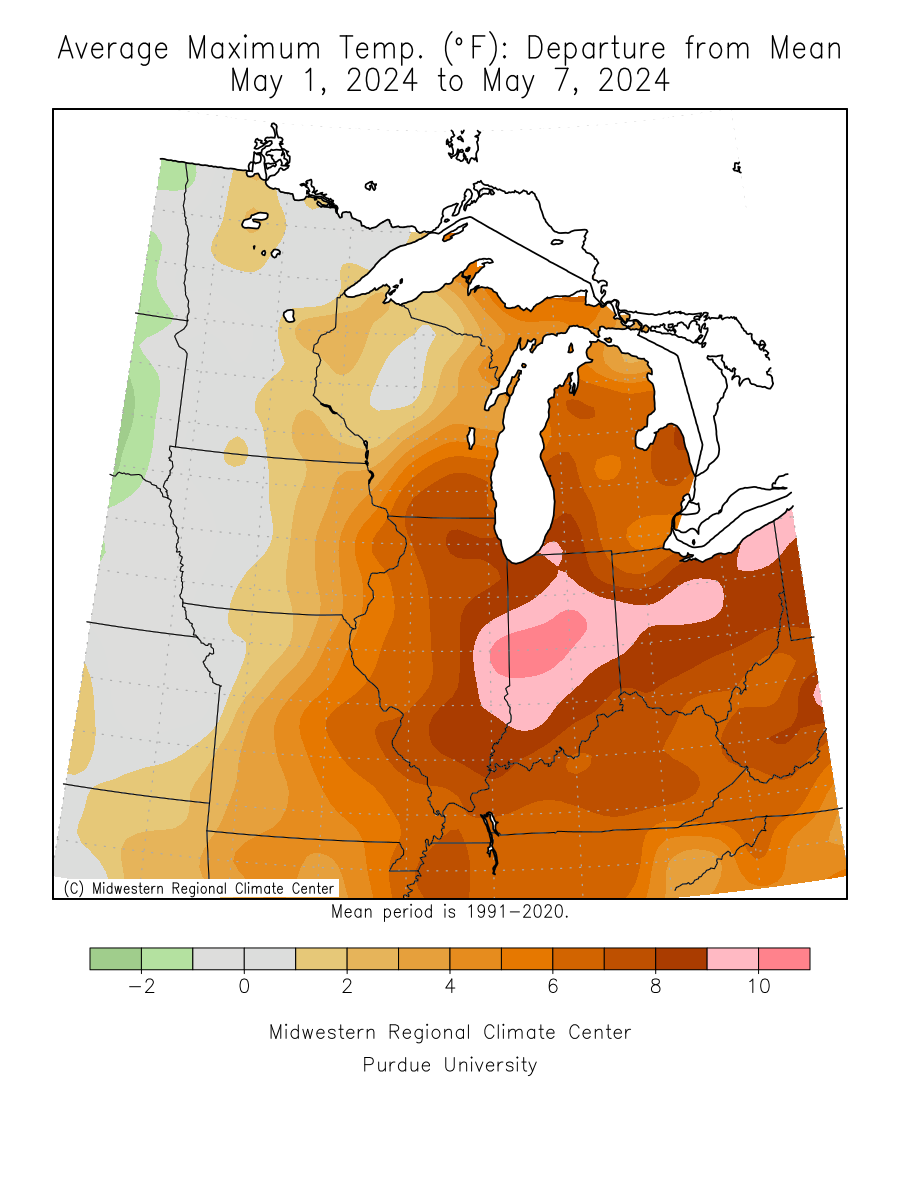 Max |
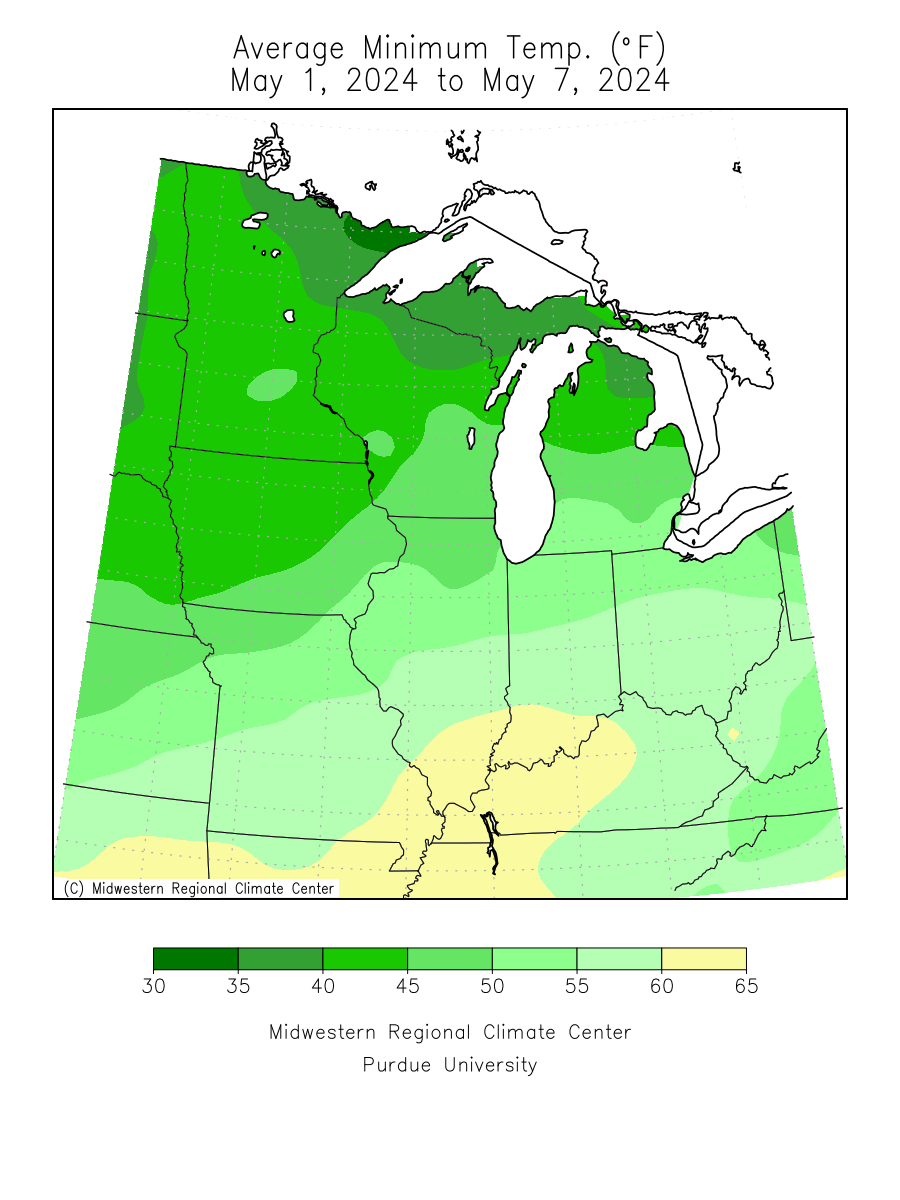 Min |
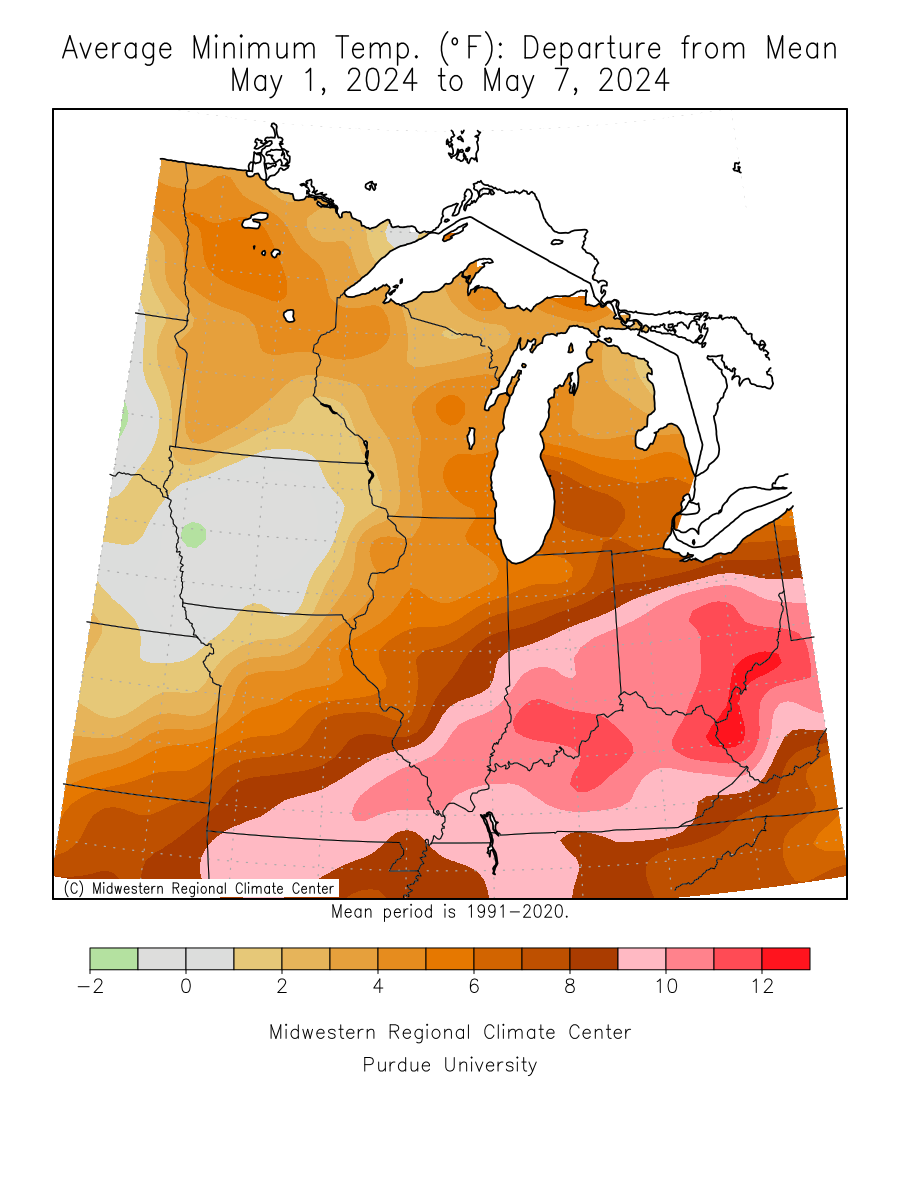 Min |
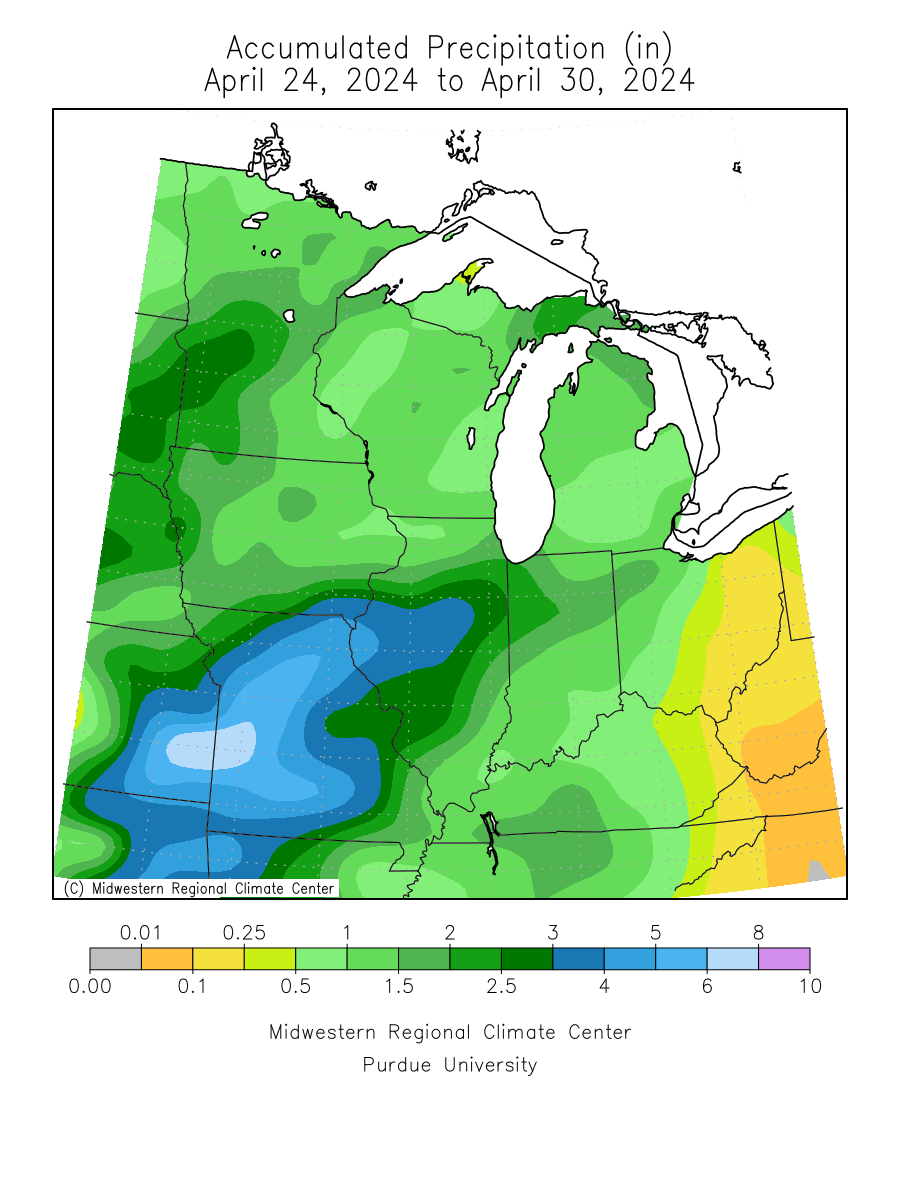 Precipitation |
 Precipitation |
|
7 Days 30 Days Month to Date |
7 Days 30 Days Month to Date |
7 Days 30 Days Month to Date |
7 Days 30 Days Month to Date |
7 Days 30 Days Month to Date |
7 Days 30 Days Month to Date |
7 Days 30 Days 90 Days 180 Days |
7 Days 30 Days 90 Days 180 Days |