Agriculture
US Ag Commodities in Drought
 Monitor US Ag Commodities in Drought |
NASS Crop Progress Reports
 Track US Crop Progress |
Soil Temperature Maps
) |
) |

|
||
| 4" Soil Temp: Under Bare Soil |
4" Soil Temp: Under Sod |
Regional Mesonet Program (RMP) | ||
| For
2", 4" 7-day averages, and PET, see the Regional Mesonet Program (RMP) |
||||
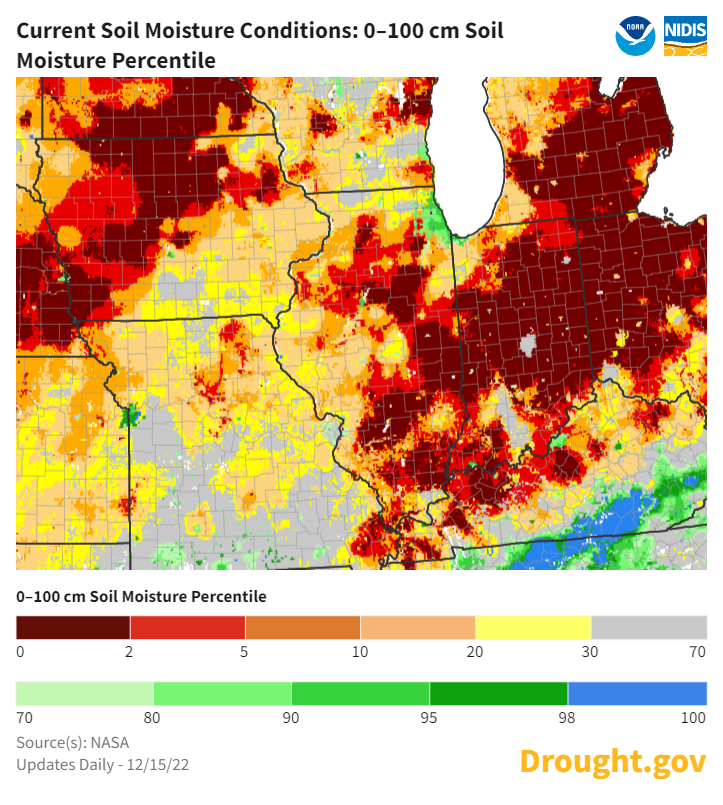
Soil Moisture Monitoring
 |
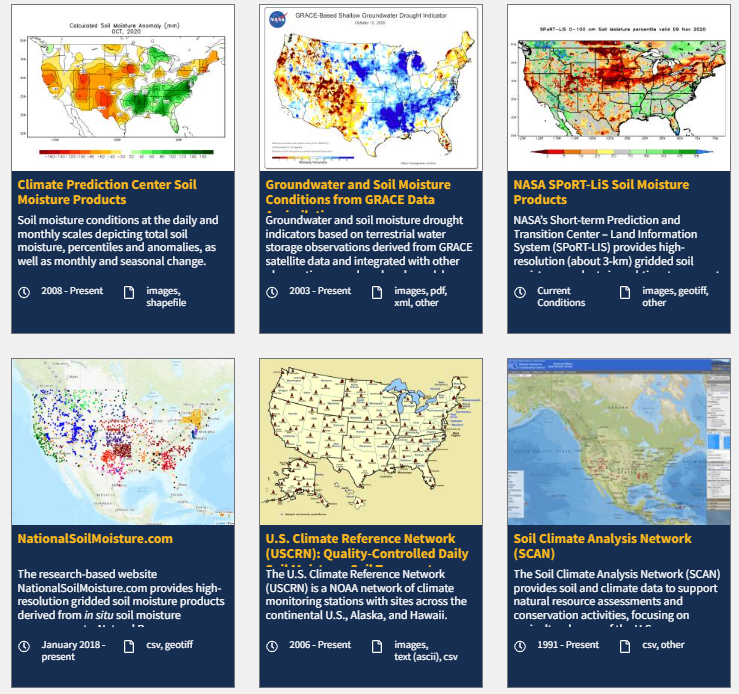 |
| Drought.gov Soil Moisture Dashboard | |
Modified Growing Degree Days
) Total MGDD Since April 1 |
) Total MGDD Departure from Mean Since April 1 |
) Total MGDD Since May 1 |
) Total MGDD Departure from Mean Since May 1 |
Modified Corn Stress Degree Days
) |
) |
|||
| Modified SDD for corn plants base 86°F |
Modified SDD for corn plants Departure from 1991-2020 Normal |
Additional products in the Vegetation Impact Program |
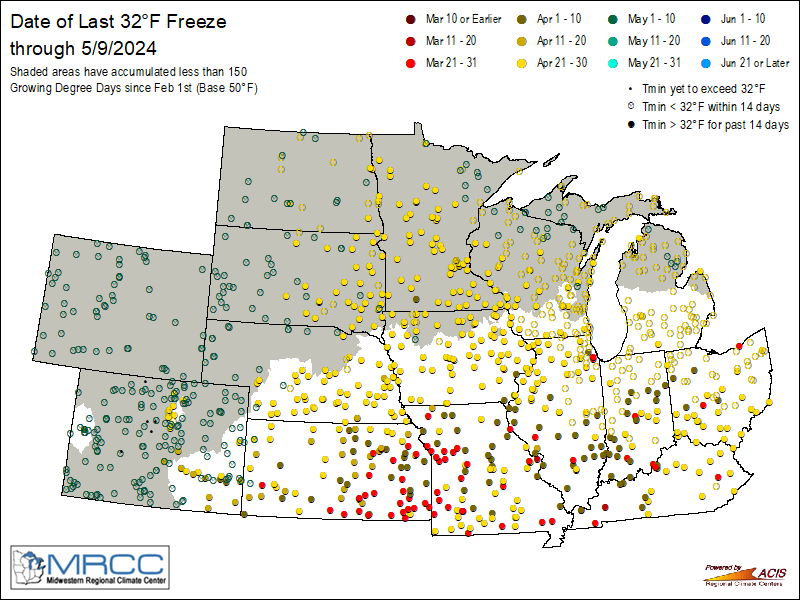
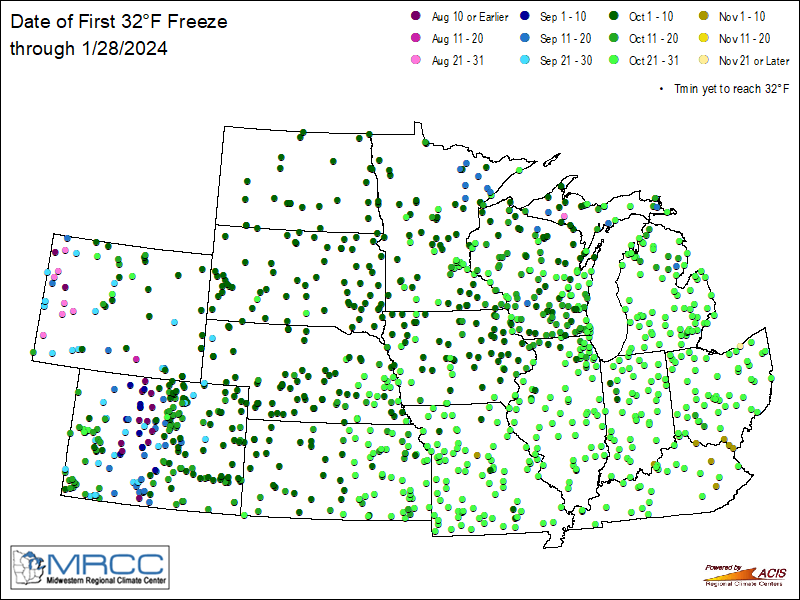
Freeze Maps
 |
 |
|
| Spring Freeze Maps |
Fall Freeze Maps |
U2U - Useful to Usable Tools
 |
|
| AgClimate Viewer |
Corn GDD |
| Climate Patterns Viewer |
Corn Split N
|
| Irrigation Investment Tool |
|


Midwest Climate Hub
 |
| The mission of the Midwest Climate Hub is to develop science-based, region-specific information and technologies alongside USDA agencies and partners, and deliver these products to agricultural and natural resource managers that enable climate-informed decision-making. This is in alignment with the USDA mission to provide leadership on food, agriculture, natural resources, rural development, nutrition, and related issues based on sound public policy, the best available science, and efficient management.
For other regions, go to the US Climate Hubs . |
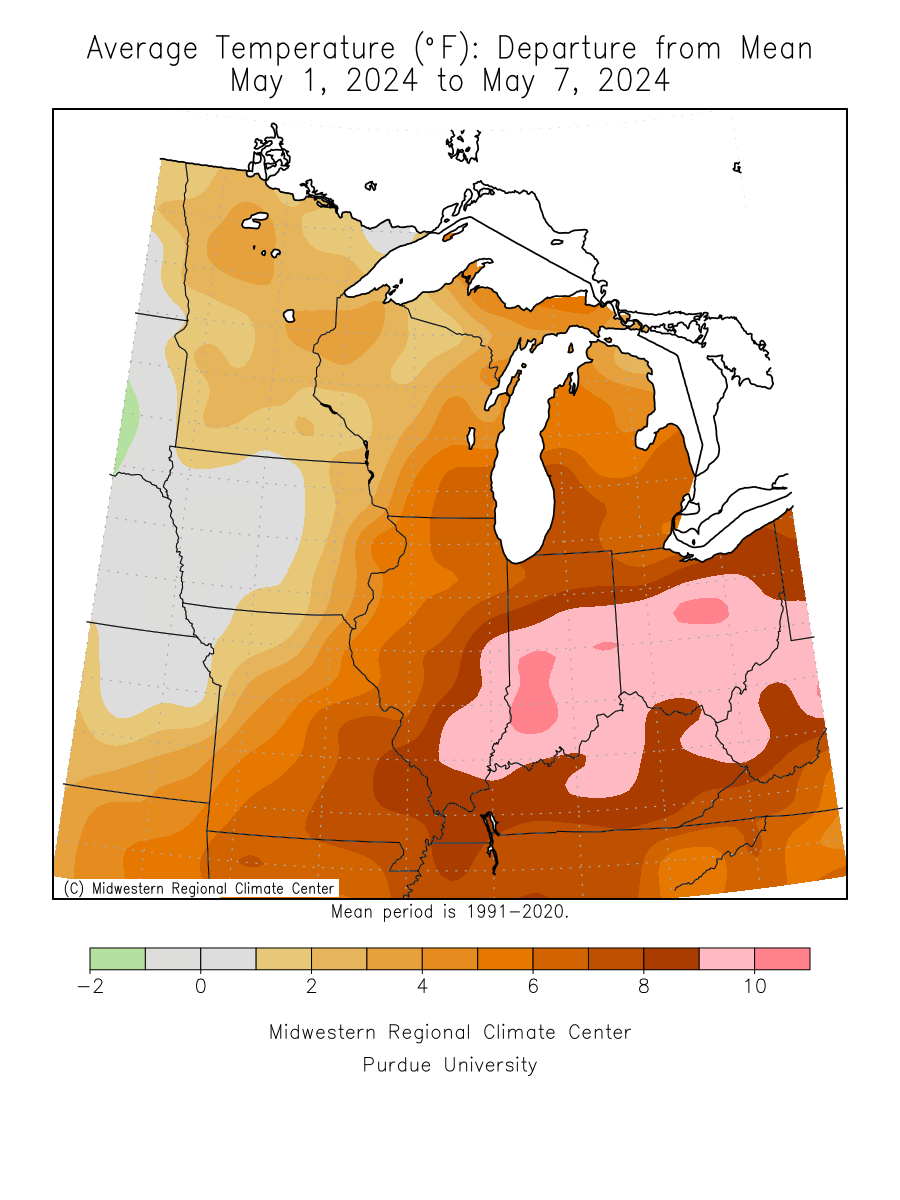
Temperature Maps
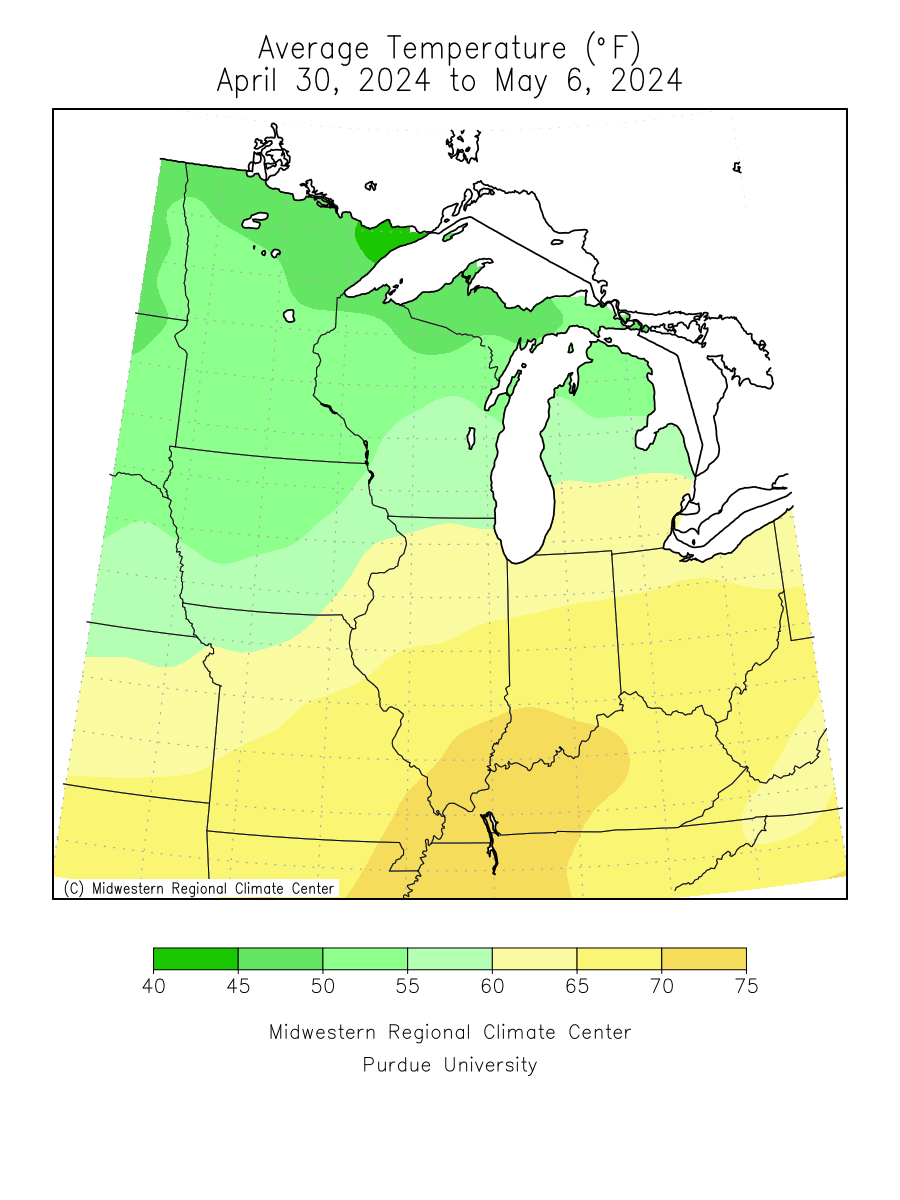 Average |
 Average |
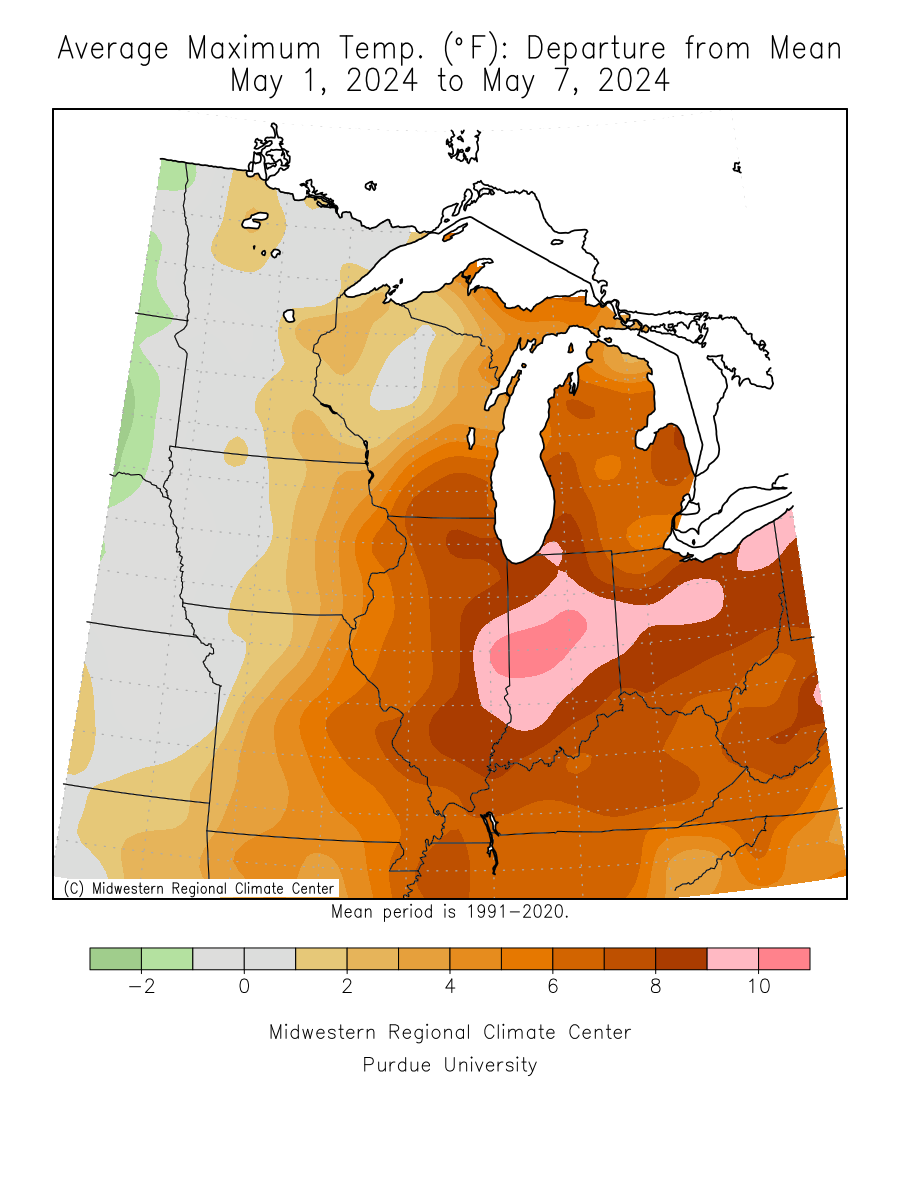
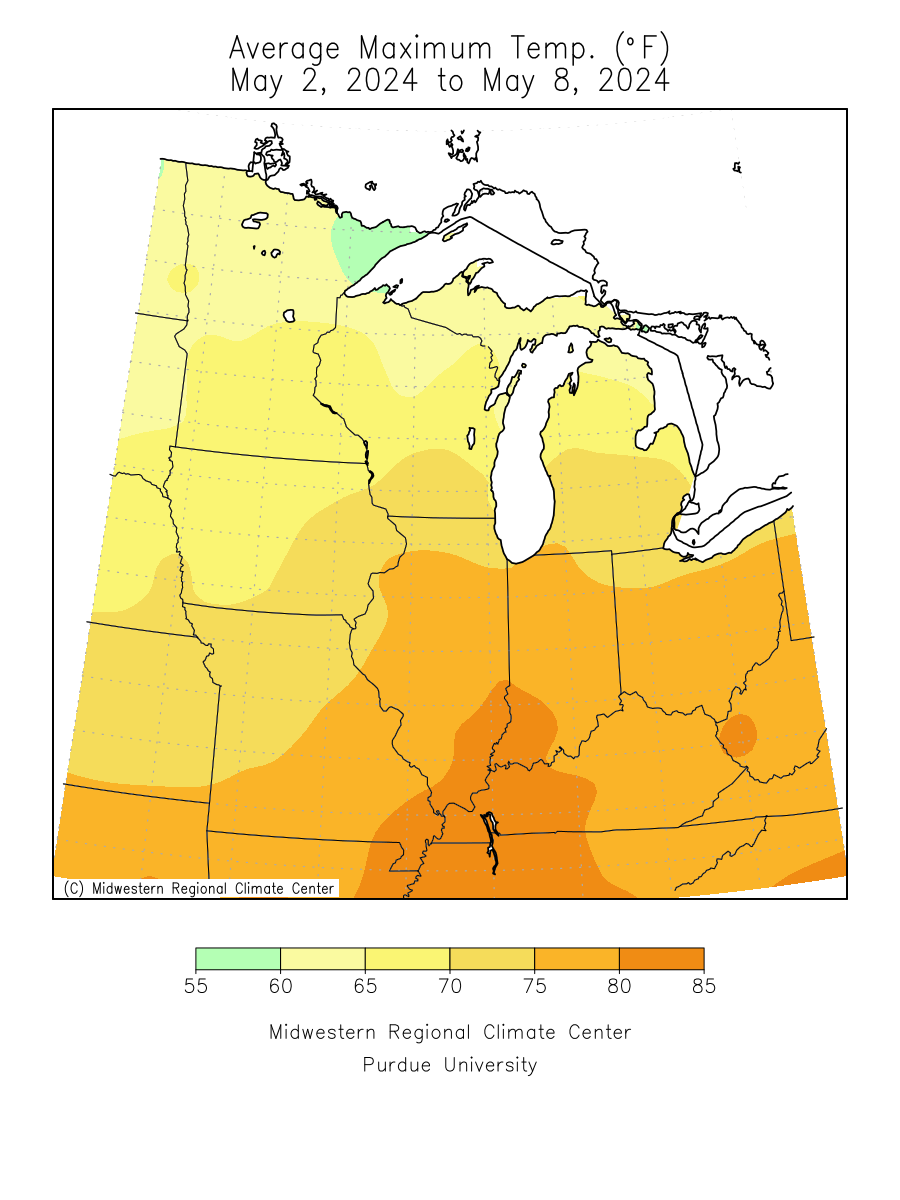 Max |
 Max |
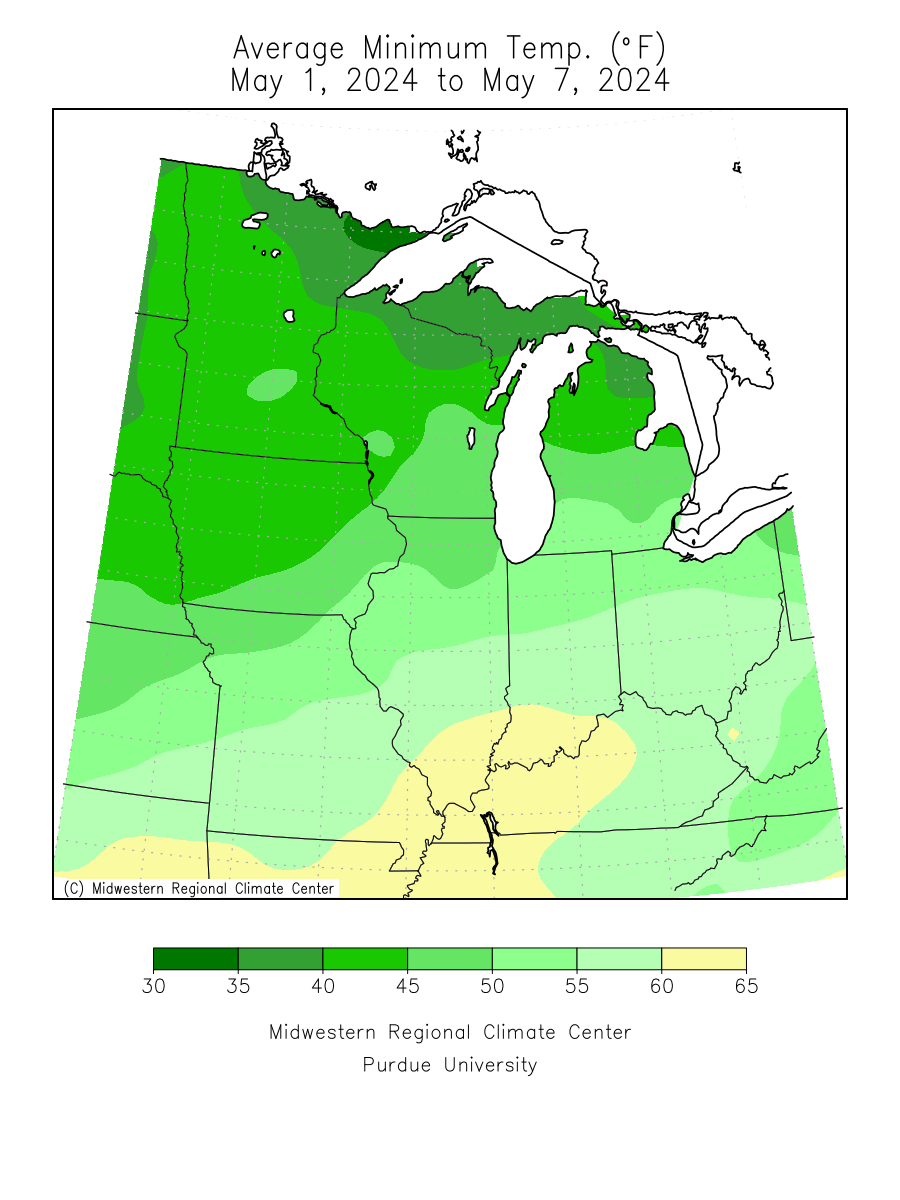 Min |
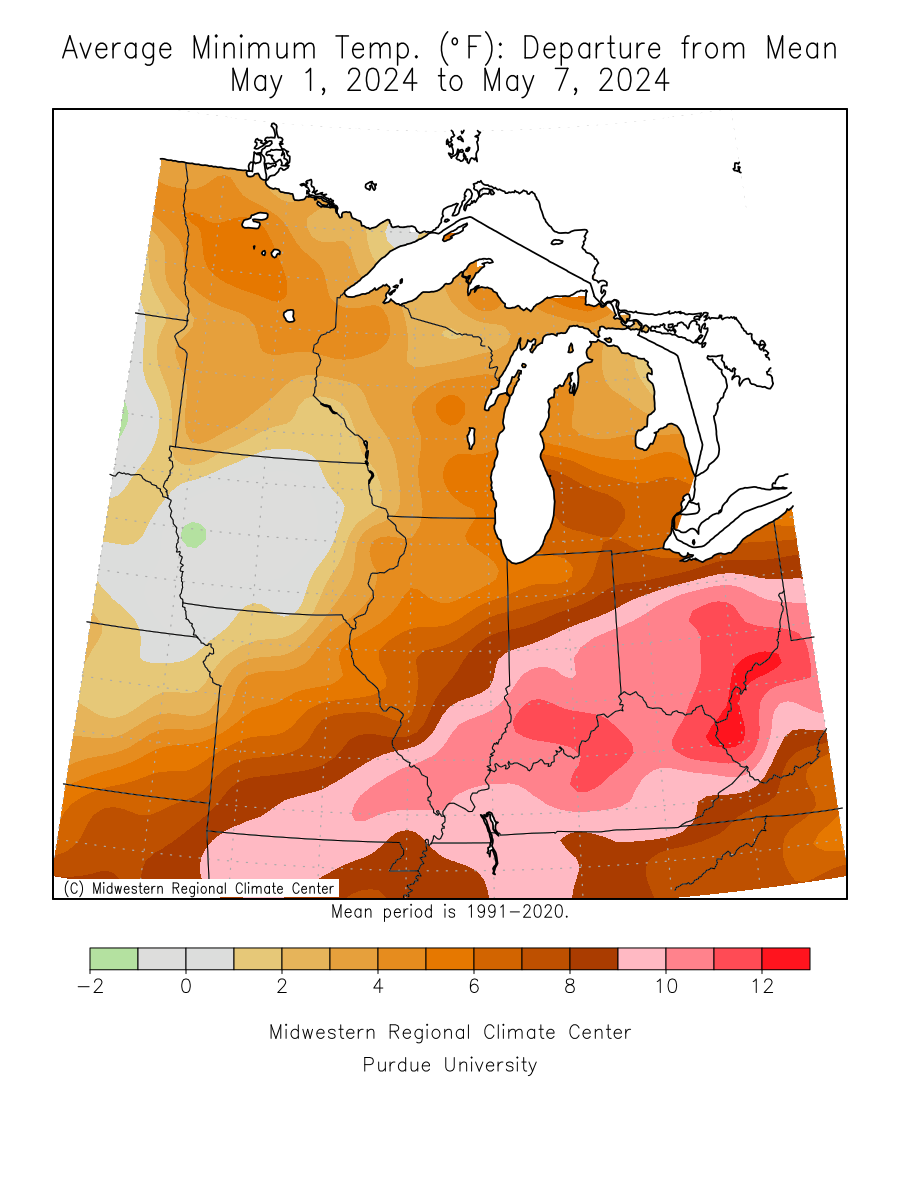 Min |
|
7 Days 30 Days Month to Date |
7 Days 30 Days Month to Date |
7 Days 30 Days Month to Date |
7 Days 30 Days Month to Date |
7 Days 30 Days Month to Date |
7 Days 30 Days Month to Date |
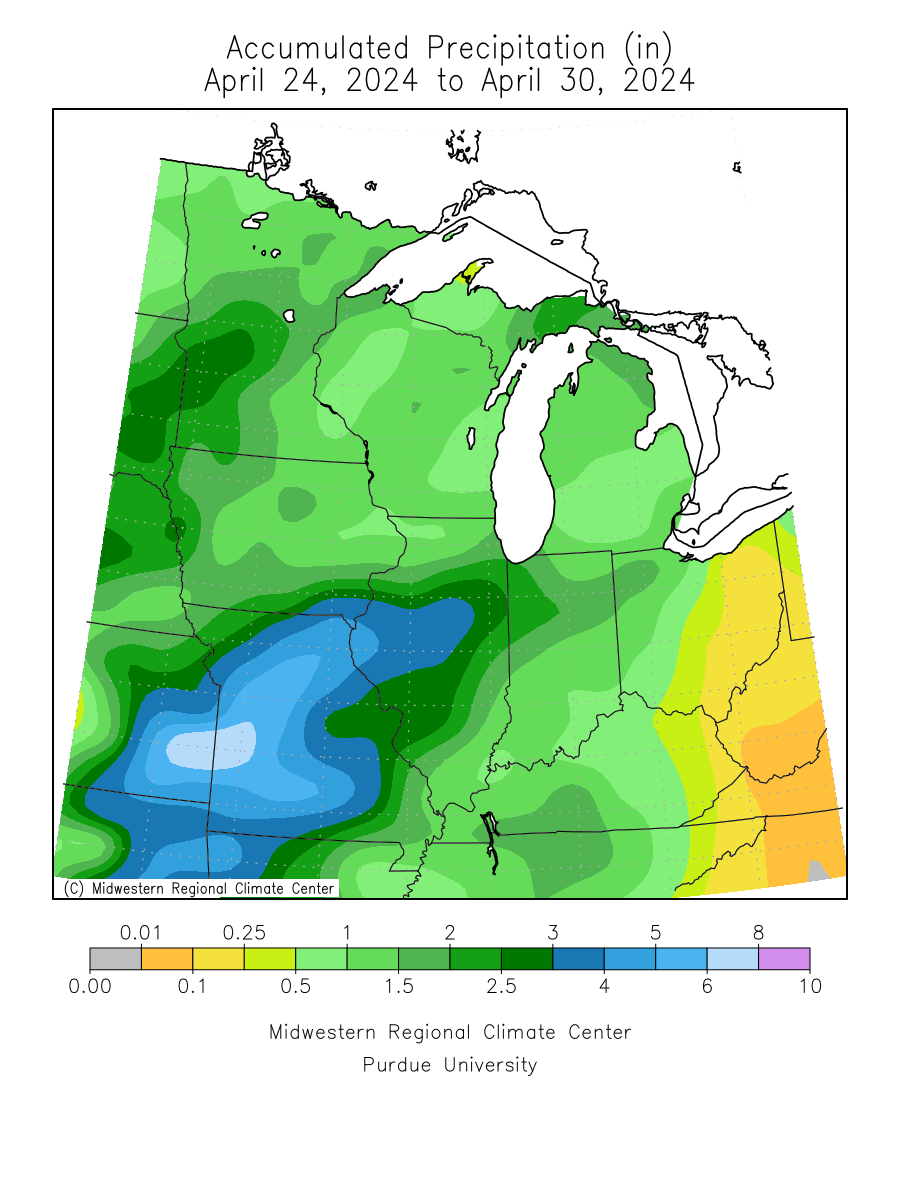
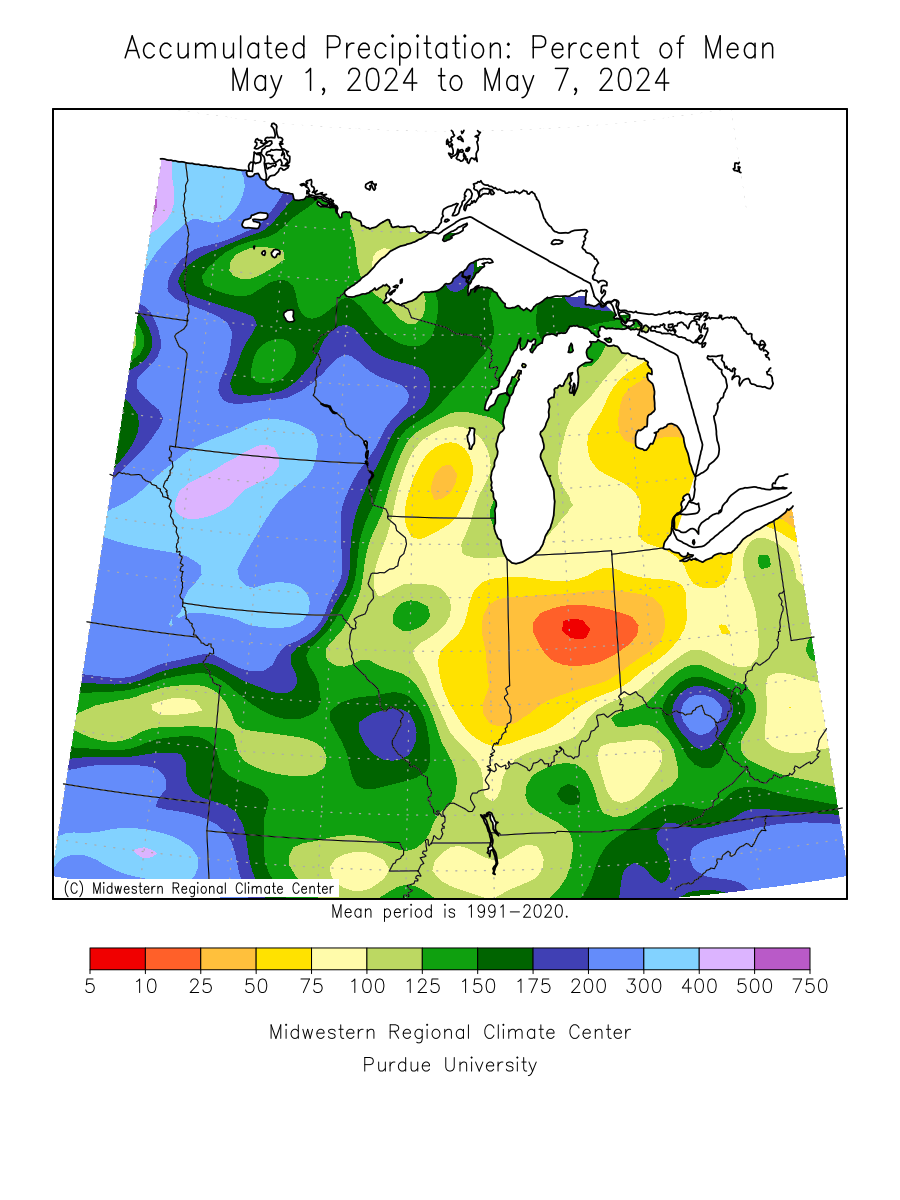
Precipitation Maps
 Precipitation |
 Precipitation |
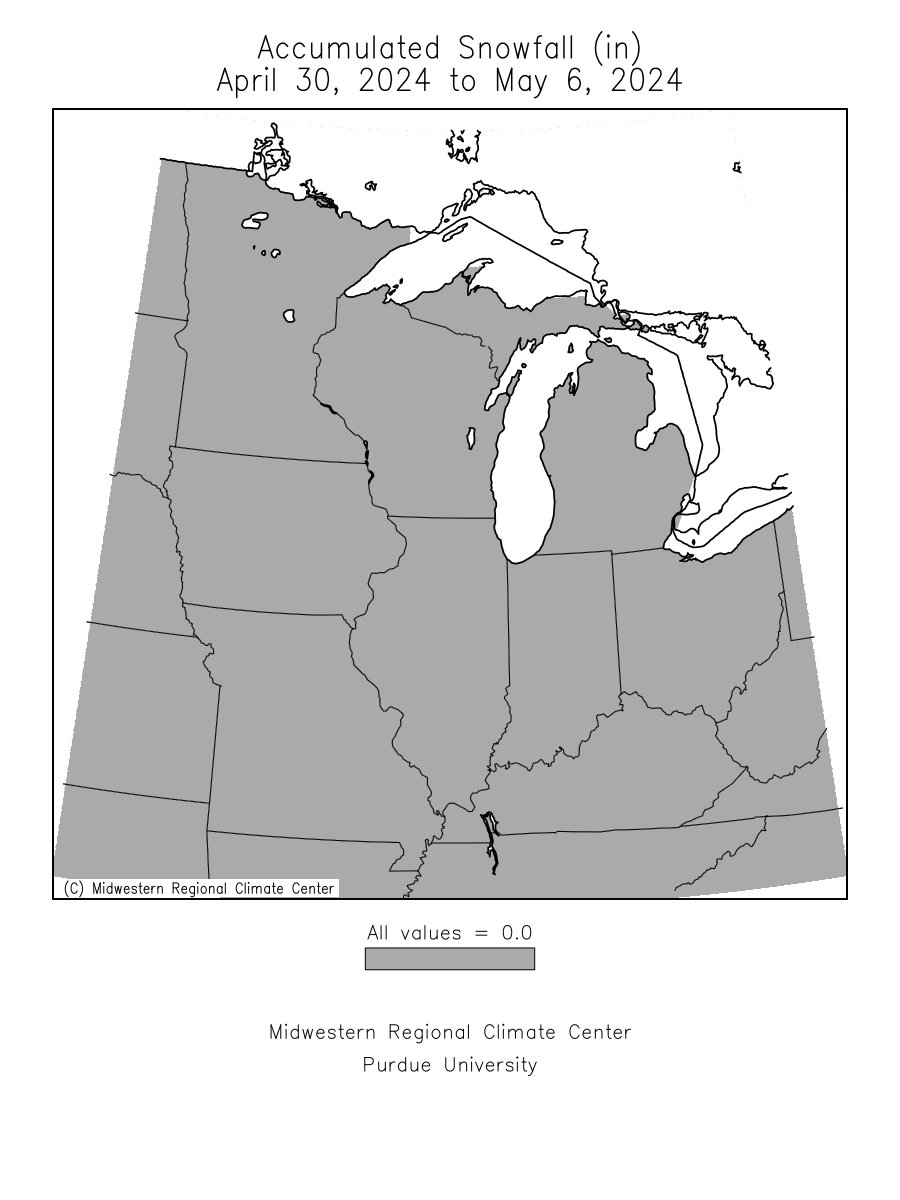 Accumulated |
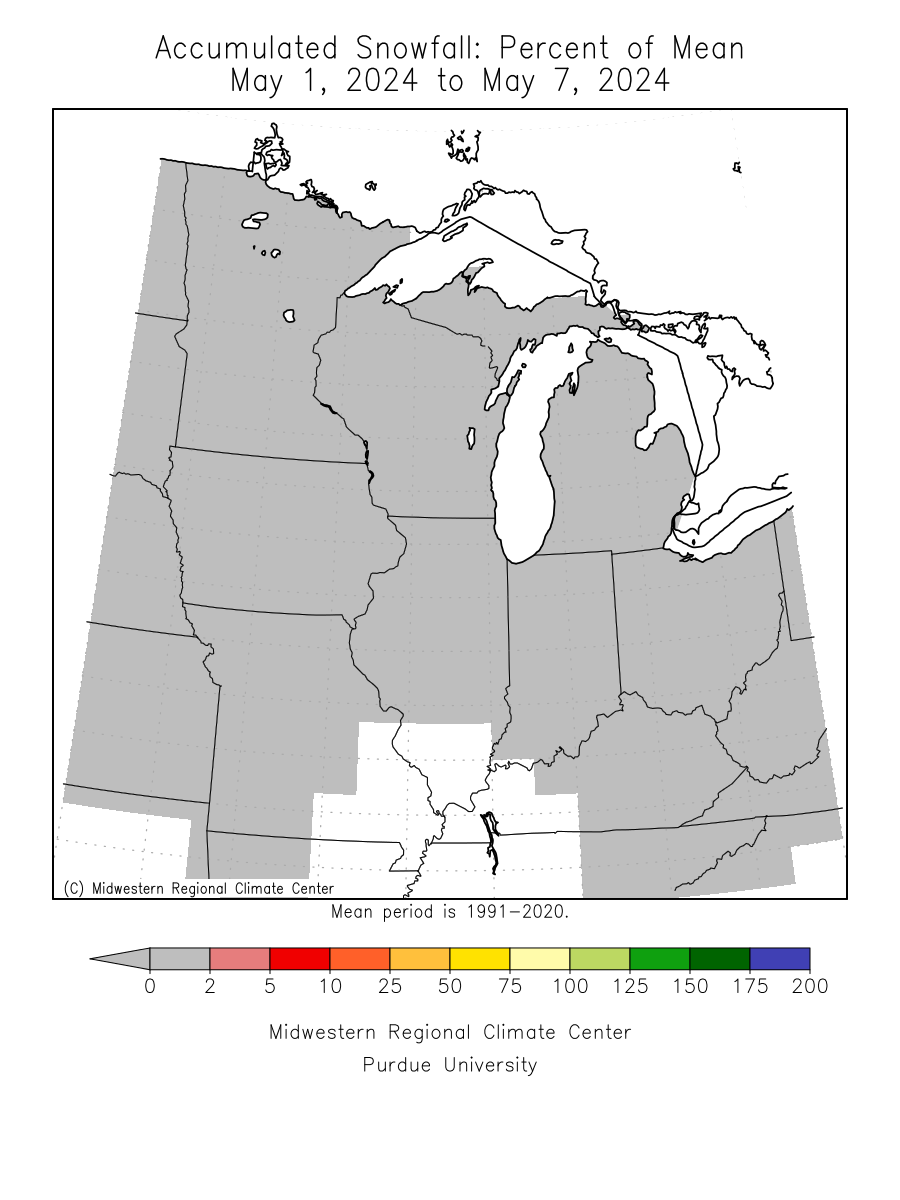 Accumulated |
|
7 Days 30 Days Month to Date |
7 Days 30 Days Month to Date |
7 Days 30 Days Month to Date |
7 Days 30 Days Month to Date |