Winds

Wind is simply the movement of air. The movement of air can bring a cooling breeze on a hot summer day, while no air movement can result in stifling conditions. In the winter, no air movement makes cold weather tolerable, while a strong wind in cold weather is at best uncomfortable and at worst dangerous. Moving air, in effect, is what “makes” our weather. On a global scale, atmospheric circulation of the air is driven by the temperature difference between the poles and the Equator, and the rotation of the Earth which results in the Coriolis force.
Winds are usually characterized by their strength and the direction from which the wind is blowing. For example, south wind means air is moving from south to north. Strength is either a direct measurement (25 miles per hour, for example) or by a descriptive name. Brief increases in wind speed, on the order of a few seconds, are called gusts. Strong winds of longer duration (at least one minute) are termed squalls. Sustained winds have various names associated with their average strength, such as gale, storm, and hurricane. Wind occurs on a range of scales, from thunderstorm flows lasting tens of minutes, to local breezes generated by heating of land surfaces and lasting a few hours, to global winds resulting from the difference in absorption of solar energy between the climate zones on Earth. The two main causes of large‐scale atmospheric circulation are the differential heating between the equator and the poles, and the rotation of the Earth.
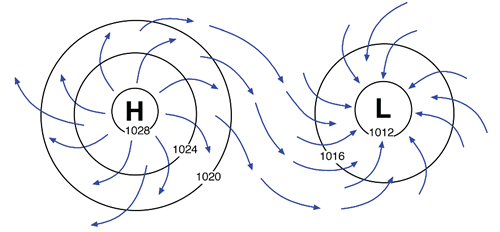 Wind results from differences in pressure and/or temperature between two regions. Large scale winds (the wind direction and speed you might read in a weather forecast) usually result from differences in pressure between weather systems crossing the country. Air moves from high pressure toward low pressure (left). The difference between the pressure systems determines the wind speed.
It helps to think of this in three dimensions rather than the two dimensions on a 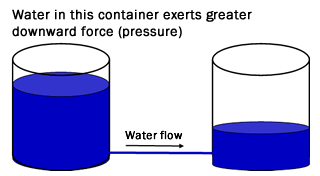 weather map. Imagine you have two containers, both 12 inches in diameter and 4 feet tall connected by a hose (right). If you fill both containers halfway, there will be no movement of the water between the containers because water level is exactly the same in both. If you fill one container up to the three foot mark with water (water is exerting “high” pressure) and leave the other with a lesser amount of water (“low” pressure), water will flow from the container with the higher water level to the container with the lower water level until the water level in both is equal. If the water in each container is air, then the flow of water through the hose is the “wind”.
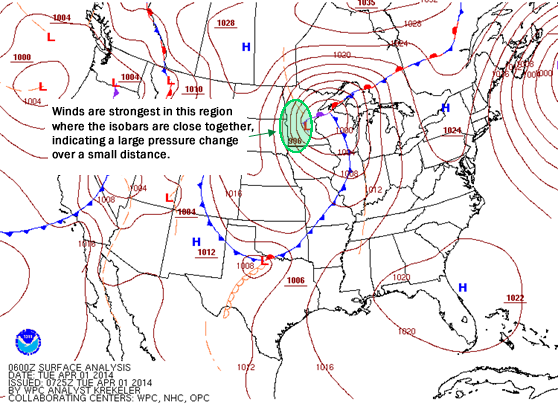
You can identify where on a weather map winds will be higher by looking at the isobars (lines of equal air pressure). Wind speeds are higher where the pressure changes rapidly with distance. The closer together the isobars are, the greater the wind speed (below). The change in pressure over distance is called the pressure gradient.
Thermally-Induced Winds
While the movement of air is caused by a pressure change, when that pressure change is the result of differences in temperature between two areas (land and water, for example) these are often described as thermally-induced winds. Examples are lake breezes, sea breezes, or slope winds in mountainous areas. These are caused by unequal heating. In the case of a lake breeze, for example, early daytime heating will warm the land areas faster than the water. The warmer air tends to rise, and then cooler air then moves into replace it, setting up a circulation called a lake breeze (wind blows from cooler lake to warmer land). At night, when the land cools faster than the water, the circulation reverses and a land breeze develops. Thermally‐induced winds can also develop in mountains and valleys.
Wind Measurement
Before the development of the anemometer, winds speeds were estimated based on observations of the environment.
The Beaufort scale of 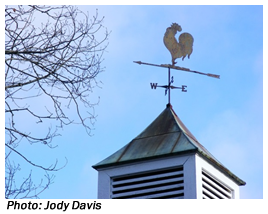 estimating wind speed is based on observed
conditions on land or at sea. It utilizes 13 categories ranging from Calm to Hurricane force.
estimating wind speed is based on observed
conditions on land or at sea. It utilizes 13 categories ranging from Calm to Hurricane force.
One of the difficulties and issues in measuring wind is exposure. There is a reason that for a long time most wind measurements were made at airports. Wind measurements are needed for aviation operations, and the large open expanses required for airports are ideal for locating wind measuring equipment. In order for wind speeds to be comparable from location to location, siting of anemometers needs to be consistent, taking into surrounding terrain, vegetation (trees), and other tall objects such as buildings. The standard anemometer height in open rural areas is 10 meters (32.8 feet).
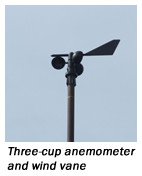 The most iconic wind measuring device is the wind vane (or weather vane, top right). Wind vanes measure wind direction
and date back to 50 BC. They can be simple or elaborate and often are used as an architectural ornament
on buildings. The wind vane is designed so that the pointer (whatever it may be) turns into the wind
indicating the direction the air is coming from.
The most iconic wind measuring device is the wind vane (or weather vane, top right). Wind vanes measure wind direction
and date back to 50 BC. They can be simple or elaborate and often are used as an architectural ornament
on buildings. The wind vane is designed so that the pointer (whatever it may be) turns into the wind
indicating the direction the air is coming from.
 Wind speed is measured by an anemometer. The anemometer most
people are familiar with is the cup anemometer (left). This device has three
or four cups mounted on a shaft. The wind turns the cups, and the
speed of rotation of the cups can be calibrated to the speed of the wind.
Wind speed is measured by an anemometer. The anemometer most
people are familiar with is the cup anemometer (left). This device has three
or four cups mounted on a shaft. The wind turns the cups, and the
speed of rotation of the cups can be calibrated to the speed of the wind.
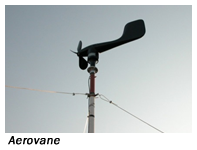
Another version of the anemometer is called the aerovane (right). This combines the measurement of speed and direction into one instrument that looks like an airplane without wings. The propeller on the aerovane measures the wind, while the body points into the wind indicating direction.
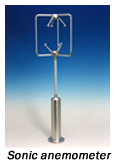 Of course, moving parts are subject to wear and tear, and in icing conditions
anemometers can freeze up (unless they are heated) and cease measuring
wind speed. Sonic anemometers have no moving parts and measure the speed of the wind using
ultrasound (left). They were first developed in the 1950s. They measure wind speed based on the time of flight
of sonic
Of course, moving parts are subject to wear and tear, and in icing conditions
anemometers can freeze up (unless they are heated) and cease measuring
wind speed. Sonic anemometers have no moving parts and measure the speed of the wind using
ultrasound (left). They were first developed in the 1950s. They measure wind speed based on the time of flight
of sonic 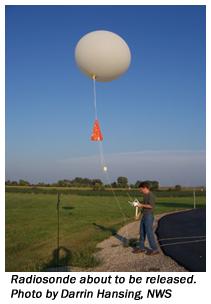 pulses between pairs of sensors. Three‐dimensional sonic anemometers are designed to measure not
only the horizontal wind but the upward and downward movement of air and turbulence. One of the disadvantages of the sonic anemometer is that precipitation, particularly rain drops, can affect the
speed of sound and can result in lower accuracy. An acoustic resonance anemometer also
measures wind by using ultrasound. The sensor measures the phase shift of ultrasound waves
in a cavity as the air passes through it and converts this to wind speed.
pulses between pairs of sensors. Three‐dimensional sonic anemometers are designed to measure not
only the horizontal wind but the upward and downward movement of air and turbulence. One of the disadvantages of the sonic anemometer is that precipitation, particularly rain drops, can affect the
speed of sound and can result in lower accuracy. An acoustic resonance anemometer also
measures wind by using ultrasound. The sensor measures the phase shift of ultrasound waves
in a cavity as the air passes through it and converts this to wind speed.
Winds above the surface are measured by a variety of means. Winds can be measured by Doppler radar. This is useful for detecting features related to severe weather. Weather balloons carrying a radiosonde package (right) make routine measurements of winds at different levels in the atmosphere twice a day in the U.S.
Wind profilers measure winds in the lower atmosphere using radar or sounds waves. The National Weather Service used to maintain a network of wind profilers in the U.S., with most located in the central part of the U.S., but discontinued the program in August, 2014. The data collected by the profilers are particularly useful in detecting conditions favorable for severe weather.
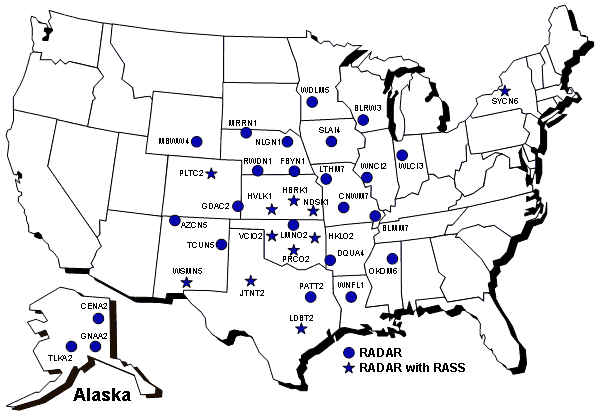
Location of wind profilers in the NOAA National Profiler Network
The live wind map is a project by Fernanda Viégas and Martin Wattenberg. Drag the map to see winds in any contiguous US location.
Wind-Resistant Construction
Strong winds, particularly those associated with thunderstorms and hurricanes, can produce great amounts of damage. Thunderstorm downbursts (downdrafts that cause damaging winds near the ground) can reach speeds in excess of 150 mph, causing more damage than a weak tornado and stronger than experienced in many hurricanes. Poorly constructed buildings can be severely damaged or destroyed by these winds. However, there are construction techniques that help strengthen the structural integrity of buildings and homes, making them more resistant to wind damage. These techniques are best employed as a home or building is constructed, but many can be retrofitted. Here are some resources:
- Guide to Wood Construction in High Wind Areas from the American Wood Council, 2015
- Against the Wind: Protecting your Home from Hurricane and Wind Damage (FEMA)
- Taking Shelter from the Storm: Building a Safe Room for Your Home or Small Business (FEMA)
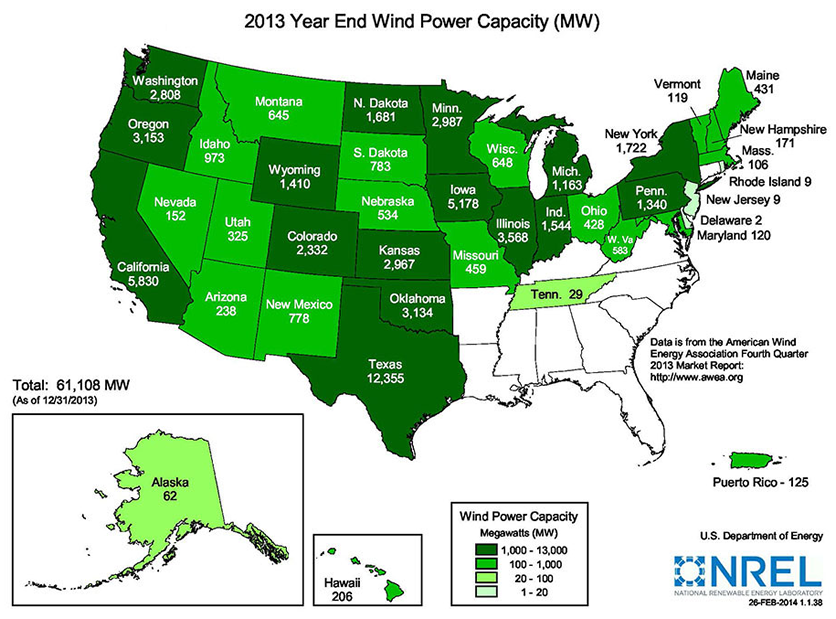
Wind Power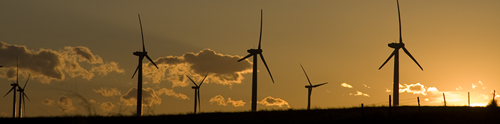
Wind power has experienced unprecedented growth in the past several years, partly due to tax credits that encourage production and also due to advancements in technology that have reduced the cost of producing wind energy by more than 40 percent. In 1992 there were 48 wind farms online in the U.S., all in California. In 2012 there were 815 wind farms online in 38 of the lower 48 states, upping the total wind capacity in the U.S. (below) to more than 60 GW, enough energy to power about 15 million homes.
Most people are familiar with the large wind farms that dot the landscape in many states, but wind turbines also can be installed for use by individual home and business owners. The Wind Energy Foundation has information and resources to help determine if home wind energy is right for you.
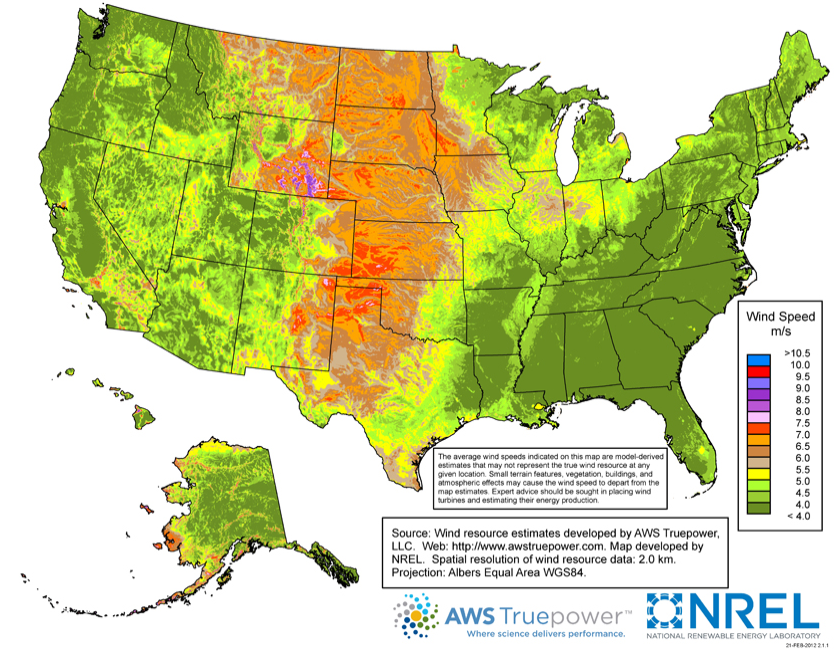
This map shows the predicted mean annual wind speeds at a 30-m height, presented at a spatial resolution of 2 kilometers that is interpolated to a finer scale. Areas with good exposure to prevailing winds and annual average wind speeds around 4 meters per second and greater at a 30-m height are generally considered to have a suitable wind resource for small wind projects. Small wind turbines are typically installed between 15 and 40 meters high. The average wind speeds indicated on this map are model-derived estimates that may not represent the true wind resource at any given location. Small terrain features, vegetation, buildings, and atmospheric effects may cause the wind speed to depart from the map estimates.