Ag Climate Dashboard: Products & Tools

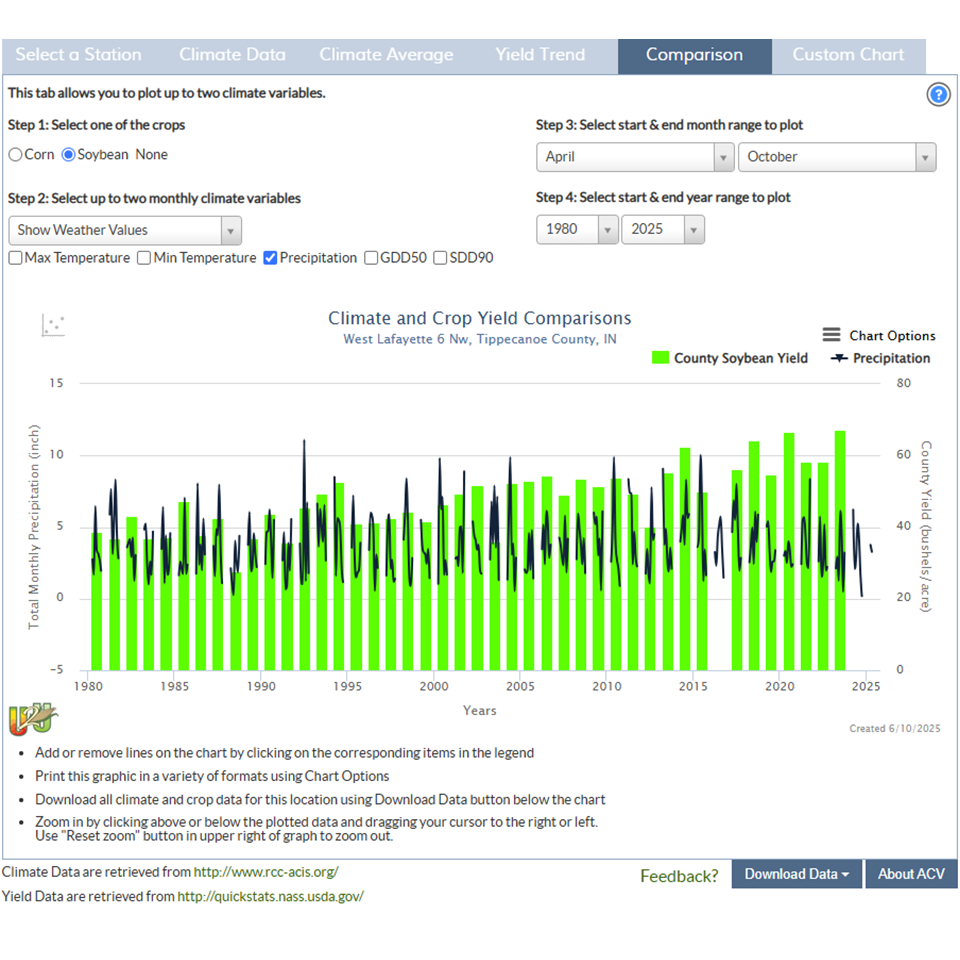
Ag Climate Viewer (MRCC)
Analyze climate and crop yield trends for the U.S. Corn Belt
The Ag Climate Viewer provides a convenient way to access customized historical climate and crop yield data for the U.S. Corn Belt.
- Interactive graphs for monthly temperature and precipitation
- Plot corn and soybean yield trends
- Compare climate and crop yields over the last 30 years
AgRisk Viewer (USDA Southwest Climate Hub)
Explore and analyze crop insurance loss data by cause, location, and time
The AgRisk Viewer offers an interactive platform for visualizing and analyzing publicly available crop insurance data from the USDA's Risk Management Agency (RMA).
- Visualize crop insurance indemnities and causes of loss (e.g., drought, hail, excess moisture)
- Filter and analyze data by commodity, location, and time period (monthly or annual)
- Identify climate-related agricultural risk “hot spots” and trends
cli-MATE (MRCC)
Self-service access to US Climate Data
cli-MATE is a free, interactive self-service portal that provides access to a wide range of historical and recent climate data across the United States.
- Customizable queries for temperature, precipitation, degree days, and others
- Interactive data visualization tools and downloadable reports
- Access to station-based and gridded climate datasets and customized mapping
- Advanced filtering by location, date range, and data type
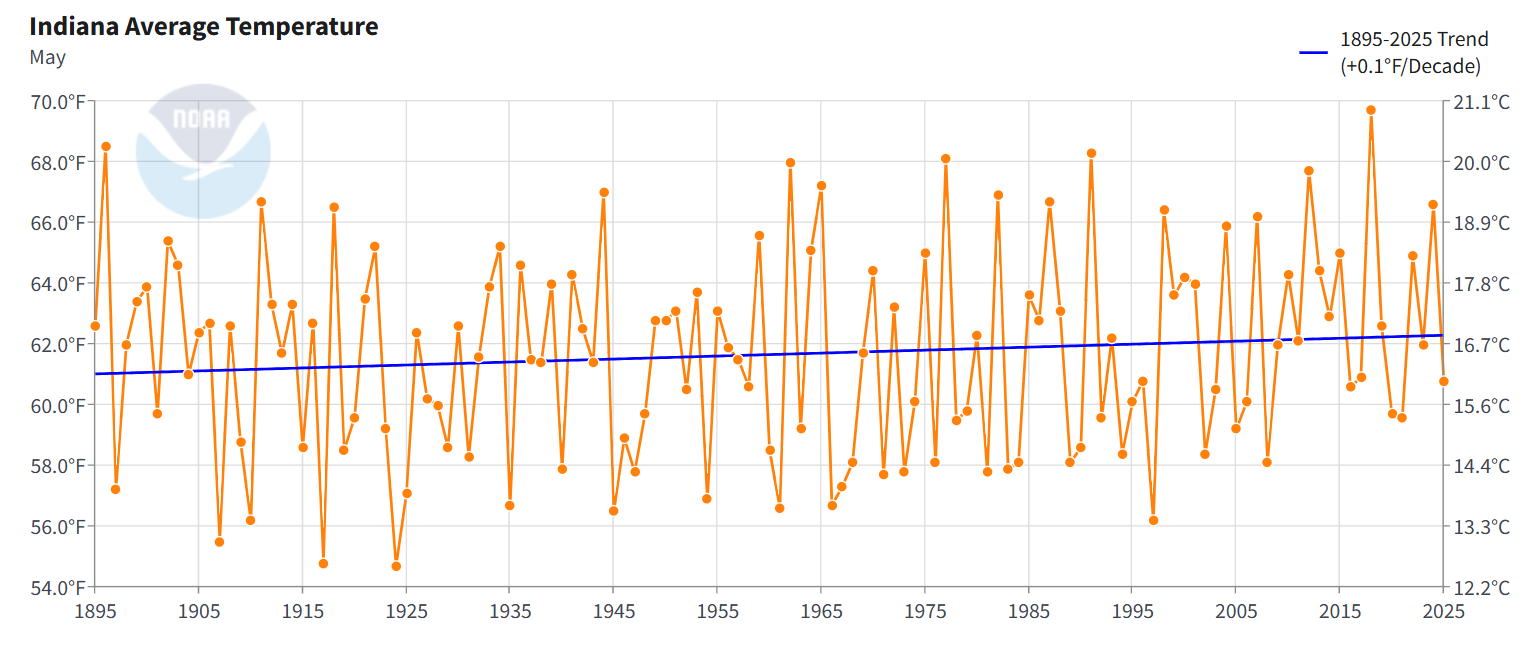
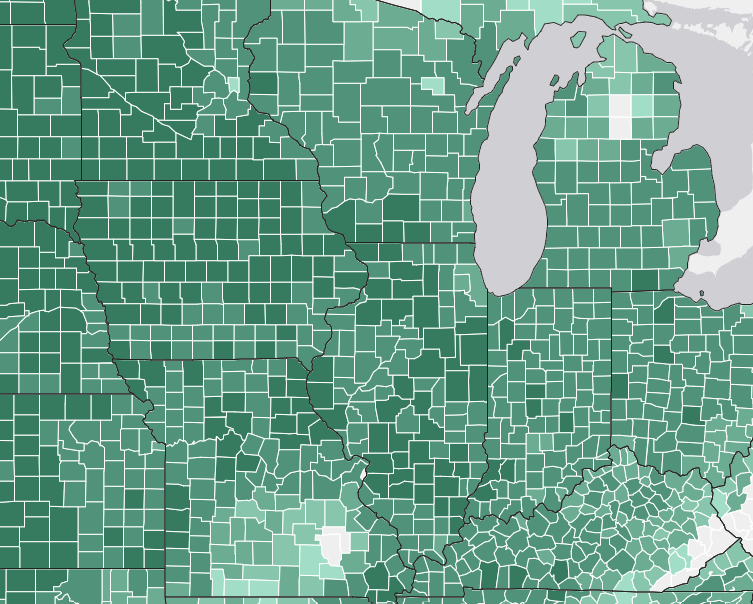
Climate at a Glance (NCEI)
Analyze temperature and precipitation trends for the U.S. and the globe
Climate at a Glance provides near real-time analysis of monthly temperature and precipitation data, helping users study climate variability and long-term trends at local, regional, national, and global scales.
- Interactive maps and time series graphs for weather data
- Adjustable parameters including heating/cooling degree days and other options

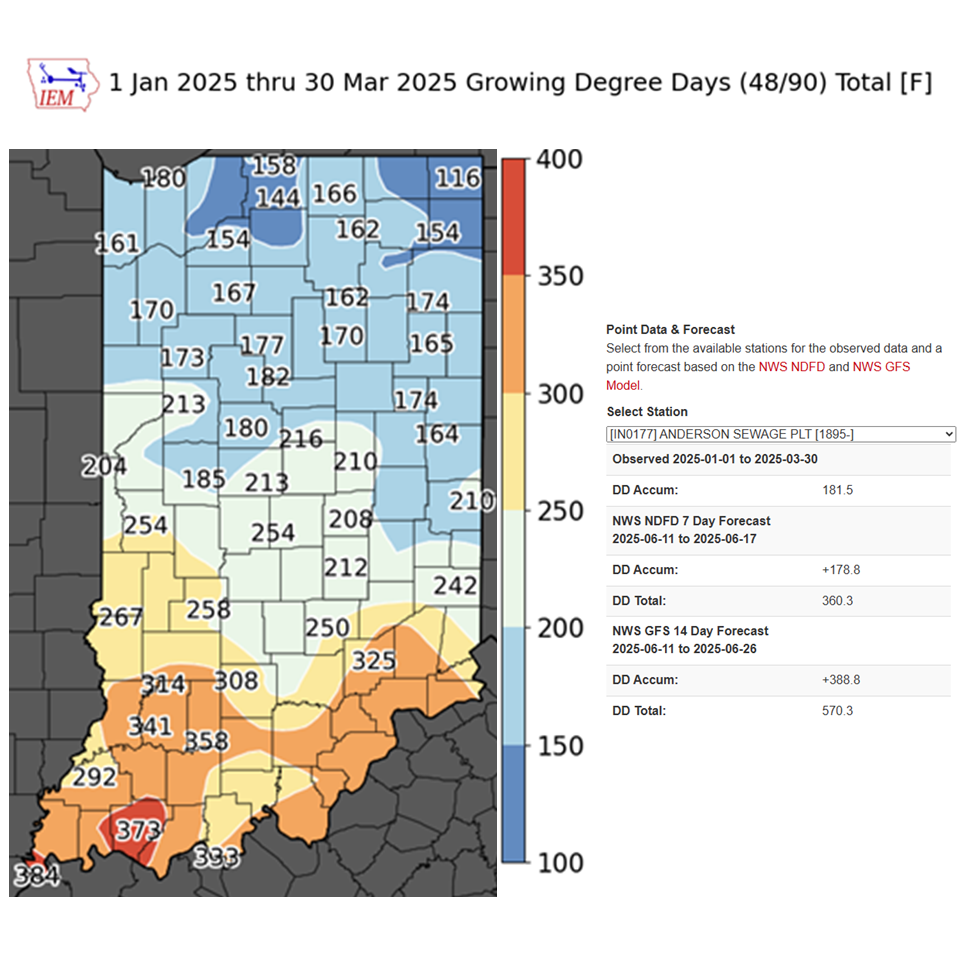
Iowa Environmental Mesonet (IEM)
Access real-time and historical environmental data for the Midwest
The Iowa Environmental Mesonet collects, stores, and shares environmental observations from a network of cooperating data providers, offering a wide range of weather and climate products.
- Current and archived weather data, including temperature and precipitation
- Interactive maps and web applications for data analysis
- Special features on extreme weather events and climatological trends
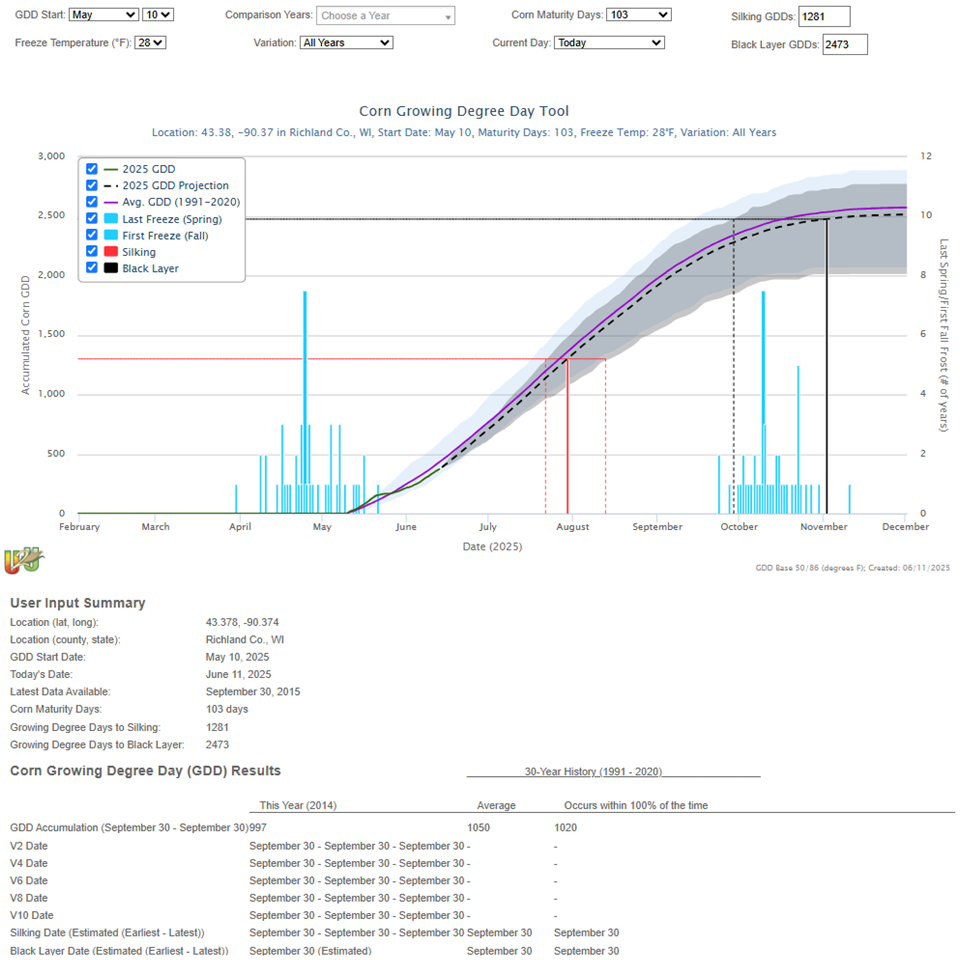
Corn GDD (MRCC)
Track corn GDD accumulation since your planting date
The Corn Growing Degree Day (GDD) tool provides real-time and historical GDD accumulations, projects corn growth stages, and helps guide decisions related to planting, harvest, and seed selection.
- Track GDD accumulation for counties using daily temperature data (86/50 method)
- Enter planting date and hybrid maturity or GDD requirement for projections
- Visualize accumulated, average, and projected GDDs with interactive graphs
- Assess frost and freeze risk for your location and hybrid
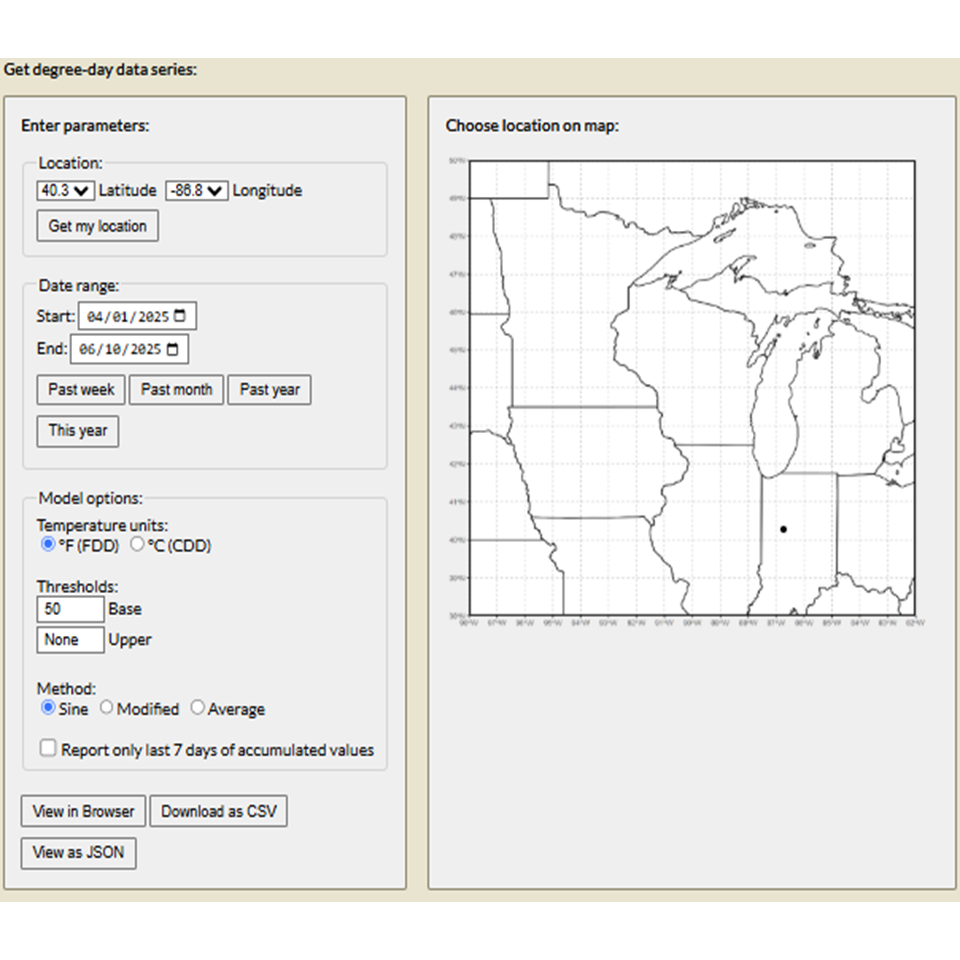
Degree Day Calculator
(University of Wisconsin Ag Weather)
Calculate and interpret growing degree days for any location and period
The UW Ag Weather Degree Day Calculator allows users to customize growing degree day (GDD) calculations for any location in Wisconsin and surrounding states.
- Customize GDD calculations by location, date range, method, and temperature thresholds
- Set dates to match crop or pest development stages
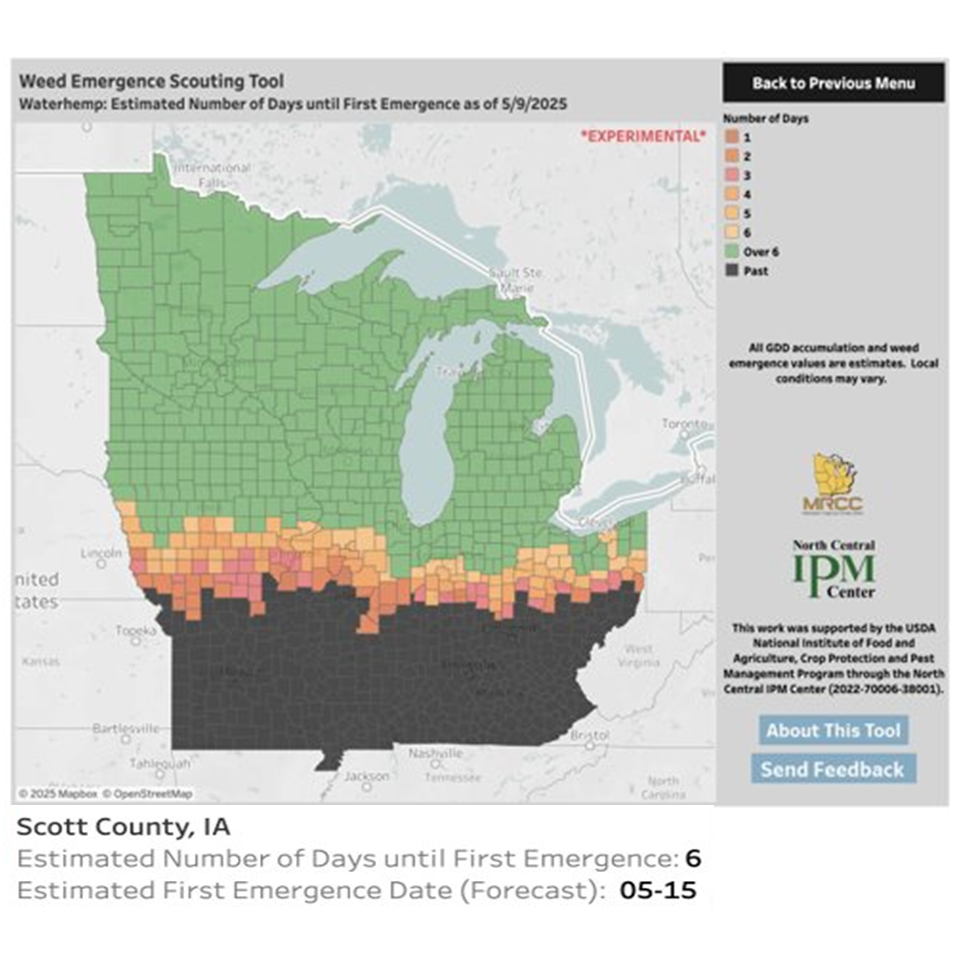
Weed Emergence Scouting Tool (MRCC)
Predict first and peak emergence of giant ragweed and waterhemp in the Midwest
The Weed Emergence Scouting Tool (W.E.S.T.) serves as an experimental, real-time decision support system that assists Midwest farmers and advisors in estimating the timing of key agronomic weed emergence (specifically giant ragweed and waterhemp) by utilizing growing degree day (GDD) models. By monitoring local GDD accumulations (base 48°F) and weather forecasts, W.E.S.T. facilitates more timely and effective weed management, particularly in light of rising herbicide resistance.
- Track GDD accumulation for any Midwest county
- Predict whether weeds are expected to reach peak emergence within the next six days
- Review current season’s emergence dates for both weeds in your county
- Users can submit field observations to improve the tool
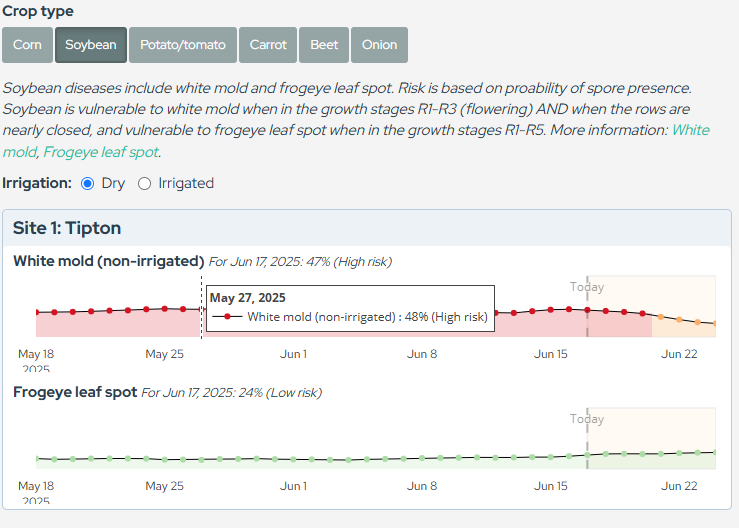
Crop Disease Forecasting Tool
(Crop Protection Network)
Forecast and risk assessment of various crop diseases
This application offers weather-based forecasting and risk assessments for various crop diseases, enabling farmers, crop advisors, and agricultural researchers to make informed, data-driven decisions. The application uses data from the IBM Environmental Intelligence Suite gridded site-specific weather data source. Crop disease models were developed based on disease information from university researchers around the country, including partners of the Crop Protection Network.
- Assess risk of white mold and forgeye leaf spot in soybeans
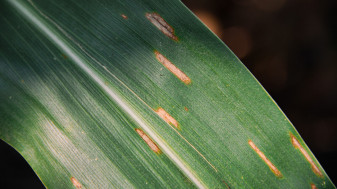
- Monitor risk of gray leaf spot and tar spot in corn
- Disease models are also available for potato/tomato, carrot, beet, and onion crops
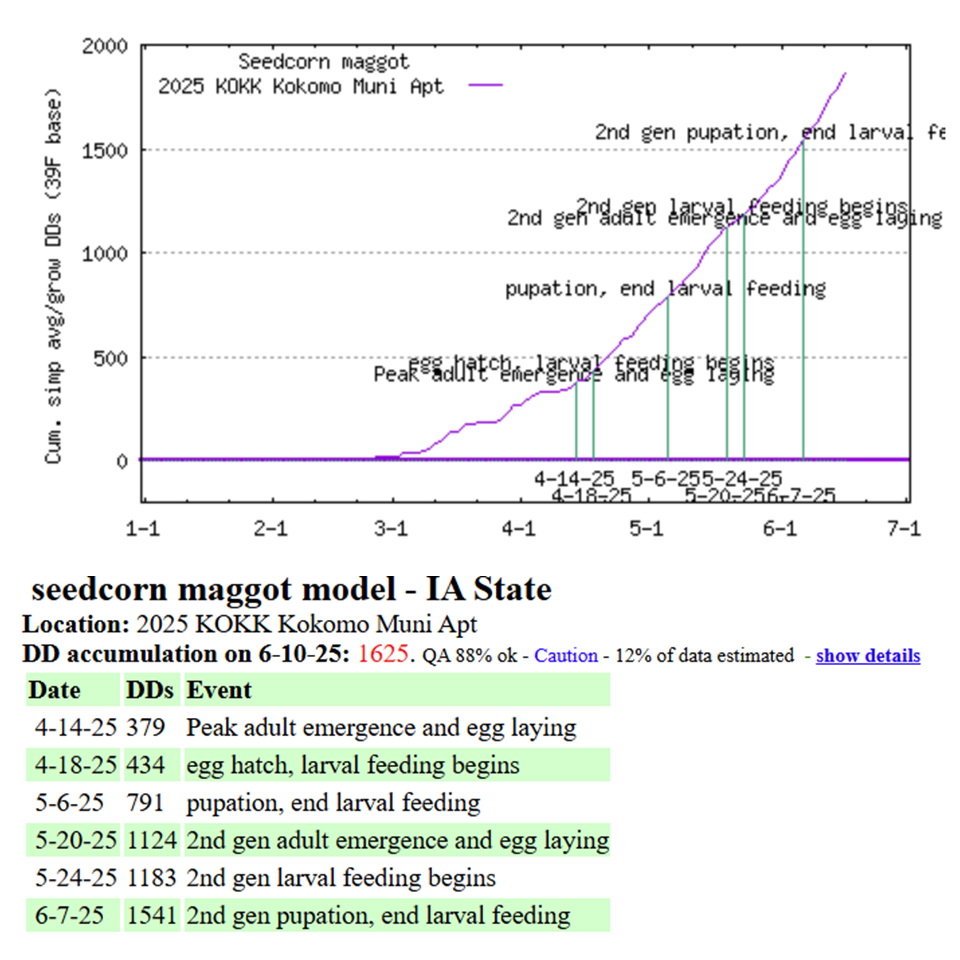
Pest Forecasting Maps
(Iowa Environmental Mesonet)
Generate maps and forecasts based on pest-specific degree day accumulation
The IEM: Pest Forecasting Maps tool enables users to create degree day maps for selected pests using customizable base and ceiling values and daily temperature data. This supports timely scouting and management for key insect pests in the region.
- Customized base and ceiling temperature values for each pest
- Visualize daily and cumulative degree day accumulations
- Supports scouting, management, and risk assessment for insect pests
MyPestPage – IPM Pest and Plant Disease Models and Forecasting
(Oregon IPM Center)
Interactive GIS maps for invasive species, disease, and pest models
MyPest Page provides maps that utilize a baseline temperature threshold overlaid with a specific invasive species, fruit, or pest set as the model output. Users can present data in various formats, from tables to graphs to raw data listings.
- Explore GIS maps for pest and disease risk across regions
- Select from a wide range of pest, disease, and crop models
- Compare observed weather and degree day data
- Access hourly/daily weather, disease risk, and degree day models
Yield Loss Calculator
(Crop Protection Network)
Analyze climate and crop yield trends for the U.S. Corn Belt
The purpose of these calculators is to share economically important information on estimated crop losses from diseases and insect pests. These calculators query various types of production and disease or insect pest yield loss data based on a range of user-defined factors. The goal is to better inform industry agronomists, researchers, extension workers, commodity groups, and funding agencies about the impact of diseases and insect pests on corn, cotton, soybean, and wheat production, directing limited time and resources more effectively.
- Query production and disease/insect pest yield loss data by crop, pest, region, and timeframe
- View annual summaries and trends to inform management decisions
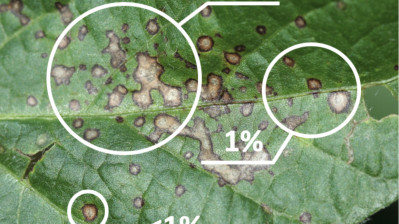
Severity Estimation Tool
(Crop Protection Network)
Train for accurate field disease and defoliation ratings
Use this web tool to help train your eyes for more accurate disease and defoliation ratings on field crops. Crop scouts and researchers often overestimate the amount of disease severity or defoliation on leaves, and the activities here will help hone assessment skills for common crop diseases and insect pests.
- Interactive activities for disease and defoliation rating practice
- Visual trainers for common crop diseases and insect pests
- Supports more accurate and consistent field assessments
Fungicide ROI Calculator
(Crop Protection Network)
Calculate return on investment for corn fungicide applications
View results from university uniform corn fungicide trials conducted in the United States and Canada, and calculate the potential return on investment (ROI) for corn fungicide application across a variety of user-defined factors, which is based on research data.
- Access trial-based ROI estimates for corn fungicide applications
- Customize inputs such as treatment cost and expected yield benefit
- Supports data-driven fungicide application decisions
Fungicide Efficacy Tool
(Crop Protection Network)
Quickly filter fungicide efficacy data for multiple crops
The fungicide efficacy tool was designed to quickly filter the fungicide efficacy table data created by the Crop Protection Network. Efficacy ratings were determined by field testing over multiple years and locations. Efficacy depends upon proper application timing, rate, and application method to achieve optimum effectiveness of the fungicide as determined by labeled instructions and overall level of disease in the field at the time of application.
- Search and filter efficacy ratings for major fungicides
- Data based on multi-year, multi-location field trials
- Supports optimal fungicide selection and application timing

3D Tools
(Crop Protection Network)
Download and print 3D models for IPM training
Download and print 3D models to help train for more accurate disease and insect injury severity in integrated pest management (IPM) and field crop research.
- Free 3D models for disease and insect injury training
- Enhance hands-on learning for crop scouts and researchers
- Models include apothecia, sclerotium, and crop leaves
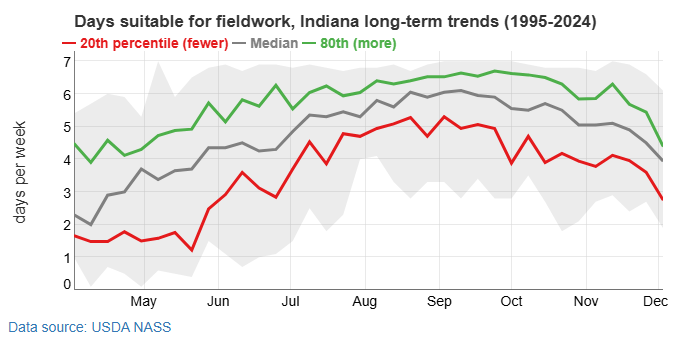
Fieldwork Capacity Tool (K-State)
Estimate and optimize fieldwork capacity for farm operations
The K-State Fieldwork Capacity Tool helps producers and farm managers assess and plan the machinery and labor needed to complete fieldwork in a timely manner. It supports decisions on equipment sizing and operational efficiency.
- Interactive calculator for estimating fieldwork capacity
- Based on research and extension work by Kansas State University
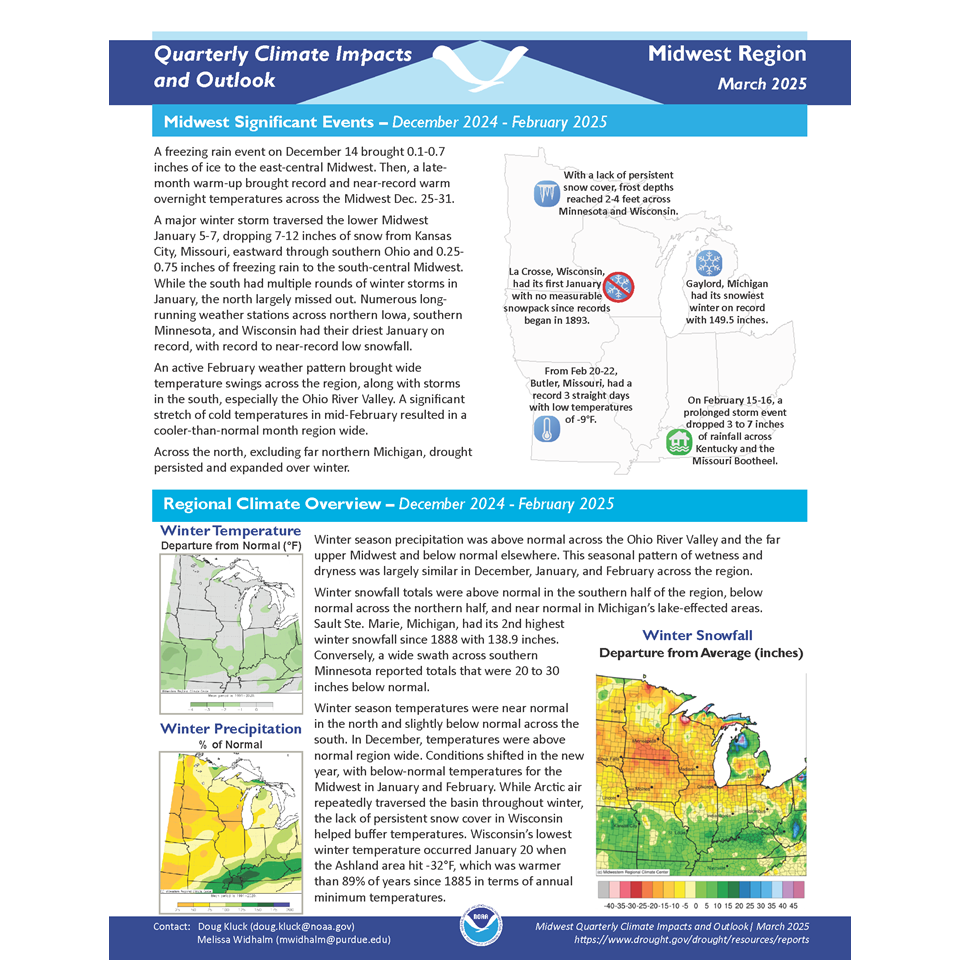
Climate Summary Reports (MRCC)
Access weekly, monthly, quarterly, annual, and ENSO climate summaries
The MRCC Climate Summary Reports page provides regularly updated summary reports.
- Weekly, monthly, quarterly, annual, and ENSO climate summary reports
- Covers temperature, precipitation, significant weather events, and impacts
- Reports available for Midwest and Great Lakes regions

Climate Reports (NCEI)
Access monthly summaries of climate events
The NCEI Climate Reports provide comprehensive summaries of climate-related occurrences on both global and national scales, offering insights into annual and monthly temperature, precipitation, and notable weather events.
- Recaps of global and U.S. climate conditions
- Highlights of significant weather and climate events
- Interactive access to past reports and data