Ag Climate Dashboard: Climatologies

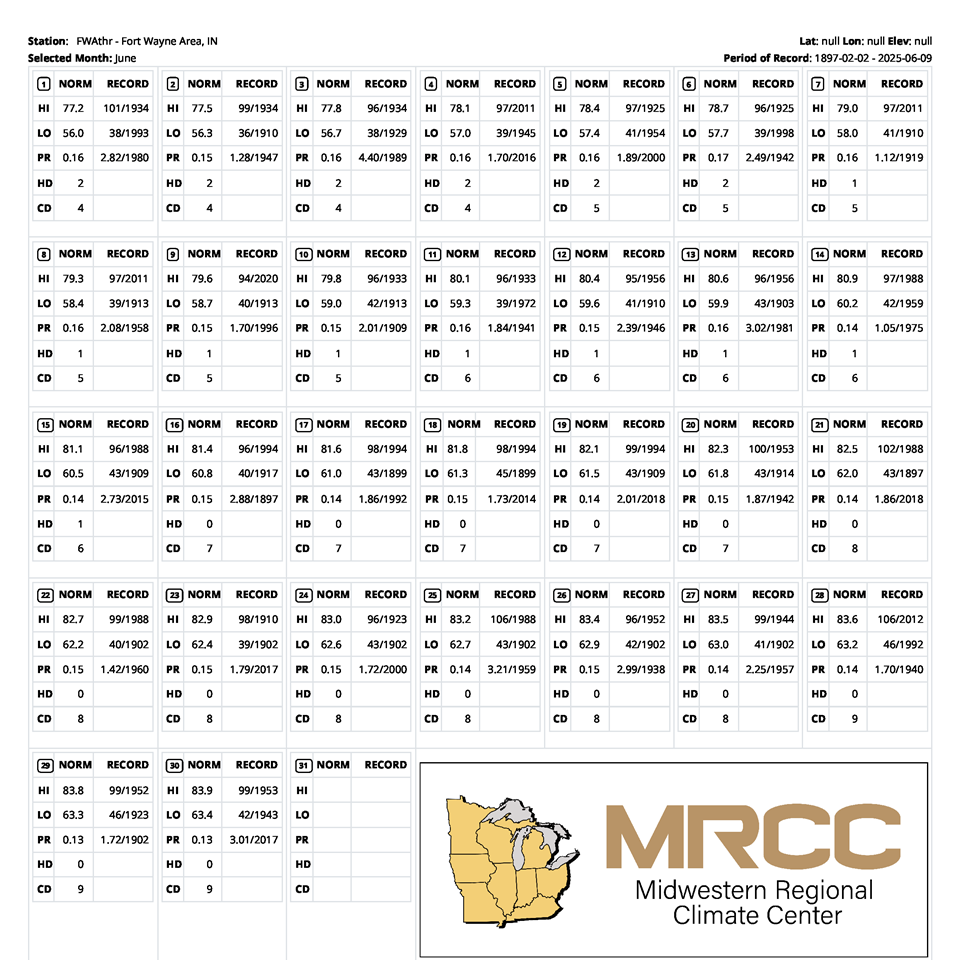
Climate Calendars (MRCC)
Explore daily and monthly climate statistics for Midwest locations
Climate Calendars present daily climate information in a calendar format, including: normal maximum and minimum temperatures, daily heating and cooling degree days, daily precipitation, record maximum and minimum temperatures, and record daily precipitation.
- View daily normals and records for maximum and minimum temperatures
- Compare monthly and historical climate patterns
- Customize calendars for specific locations in the U.S. Corn Belt
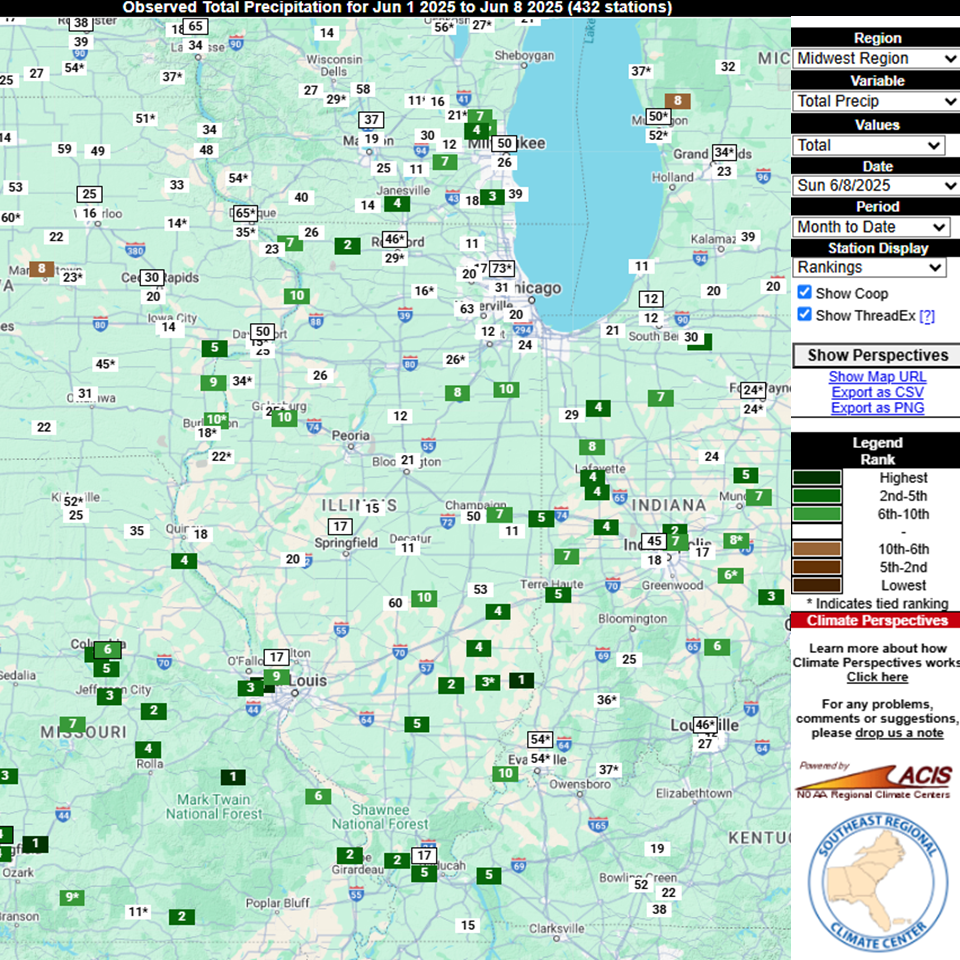
Climate Perspectives (SRCC)
Analyze recent climate conditions in historical context
Climate Perspectives offers real-time monitoring and ranking of climate data against historical records (1991–2020) for Midwest stations. Users can explore local data, regional summaries, threshold exceedances, and streaks, placing current weather events in a broader climate context for informed decision-making.
- Rank daily, monthly, and seasonal temperature and precipitation against historical records
- Visualize streaks and threshold events, such as consecutive days above or below temperature or precipitation thresholds
- Customize searches by date, period, variable, and threshold for advanced analysis

Daily Climate Extremes (MRCC)
Explore temperature, precipitation, and snowfall extremes
This map-based product provides daily climatological extremes for U.S. locations, including maximum and minimum temperature, precipitation, and snowfall.
- Identify the average warmest and coldest days of the year for any station
- View record high and low temperatures, precipitation, and snowfall values
- Determine when a station typically receives the most or least precipitation
- Filter and customize map displays by variable, record vs. normal, and value or date

Snowfall Climatology Toolbox (MRCC)
Explore historic snowfall data across the Midwest
This tool offers access to high-quality historical snowfall data across the US.
- View average annual and monthly snowfall totals by location
- Identify the average first and last dates of measurable snowfall
- Analyze the number of days per year with at least 1 inch of snowfall
- Explore records for greatest single-day and seasonal snowfall
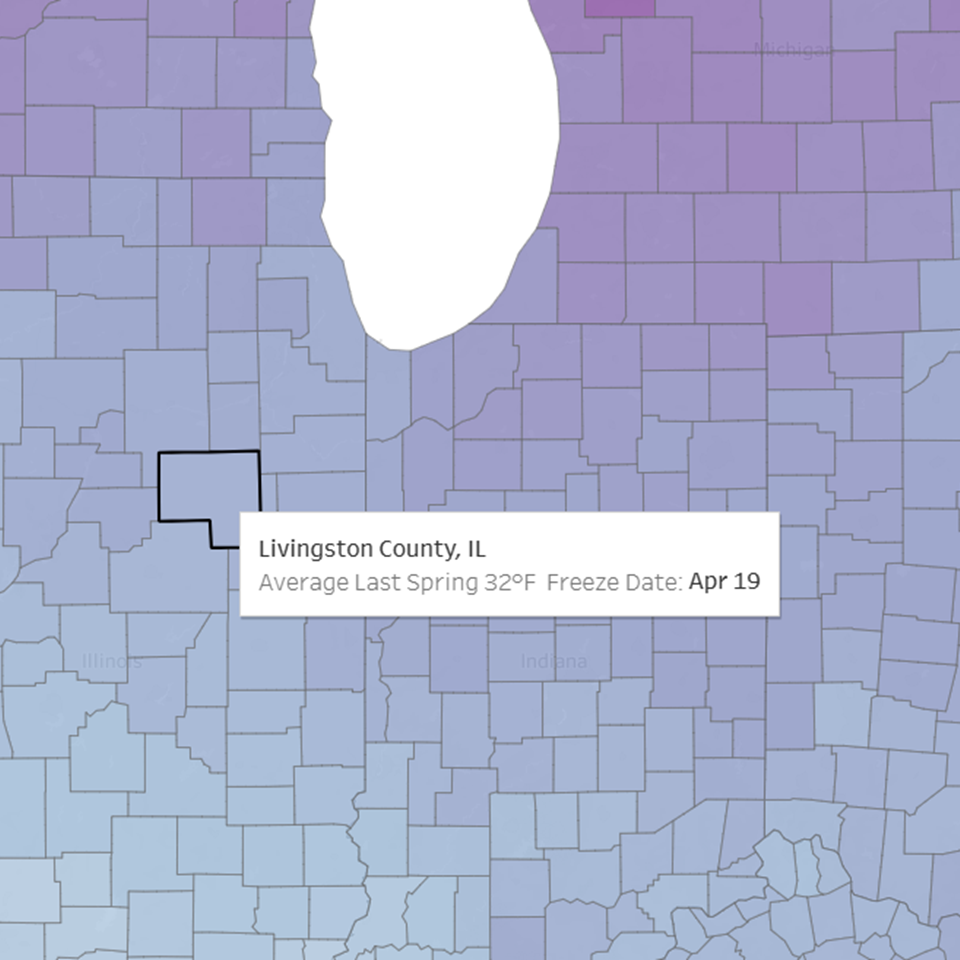
Freeze Date Tool (MRCC)
Find freeze dates for your county
Determine the earliest, average, and latest first fall and last spring freeze for various temperature thresholds. Explore trends in freeze dates and growing season climatologies.
- Custom temperature thresholds
- Assess climatological freeze risk to agricultural plants
- Growing season climatologies
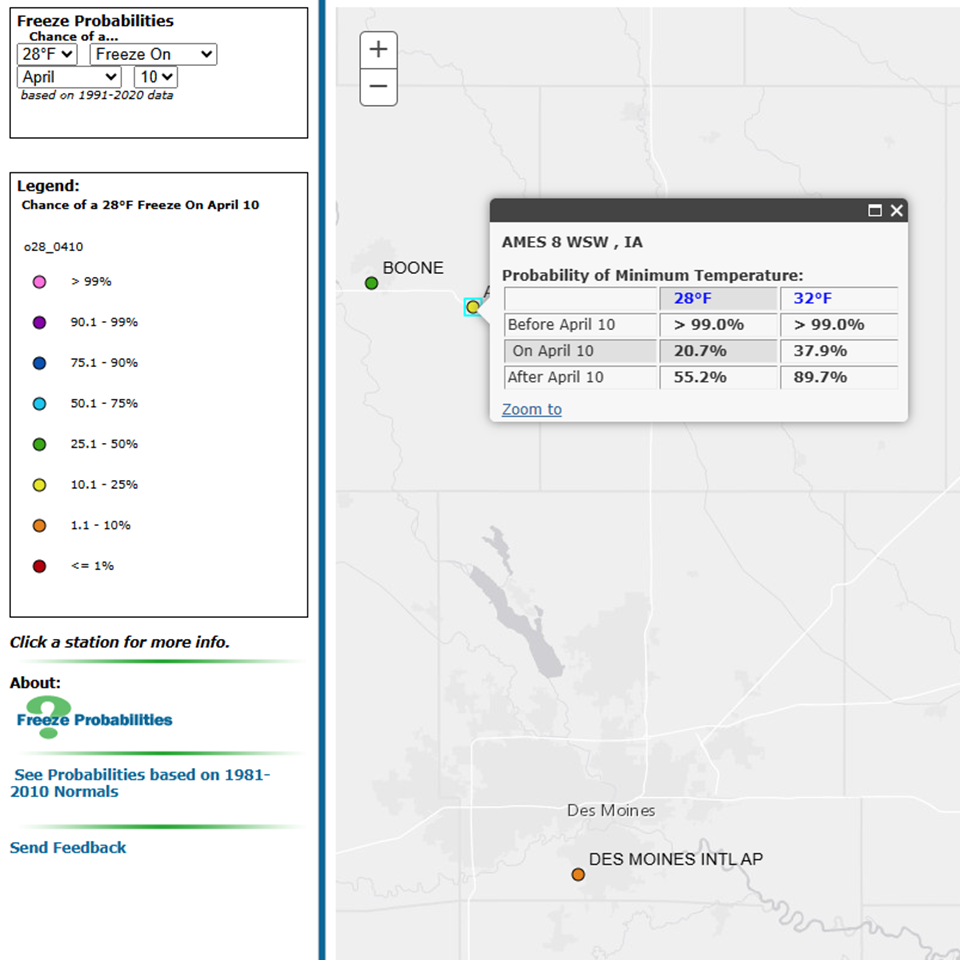
Freeze Probabilities (MRCC)
Freeze probability by date and temperature
Display the probability of a freeze for 28°F or 32°F on or after a chosen calendar date.
- User-selectable temperature and date
- Probability maps and station-specific data
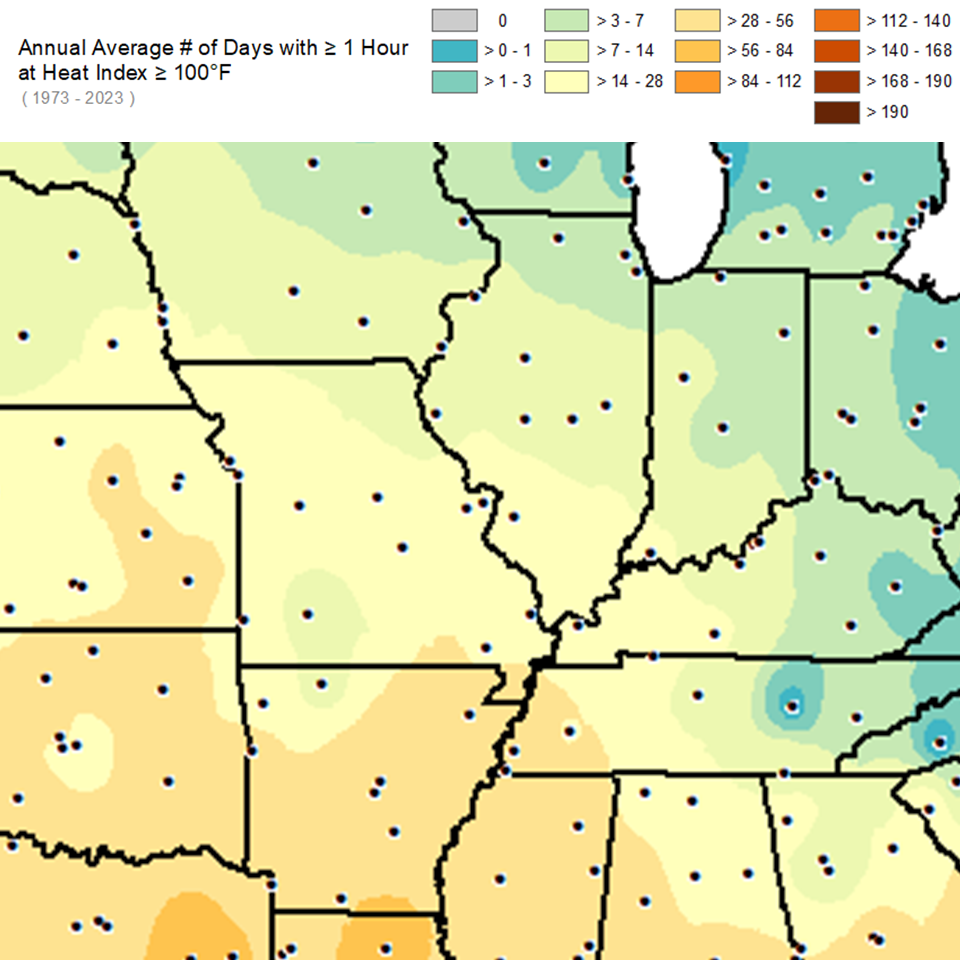
Heat Index Maps (MRCC)
Visualize annual heat index trends and thresholds
The MRCC Heat Index Maps tool displays climatological maps of heat index thresholds for the US.
- Map the number of days and hours above selected heat index thresholds (e.g., 90°F, 95°F, 100°F)
- View annual counts of days with extended periods (minimum three hours) of dangerous heat
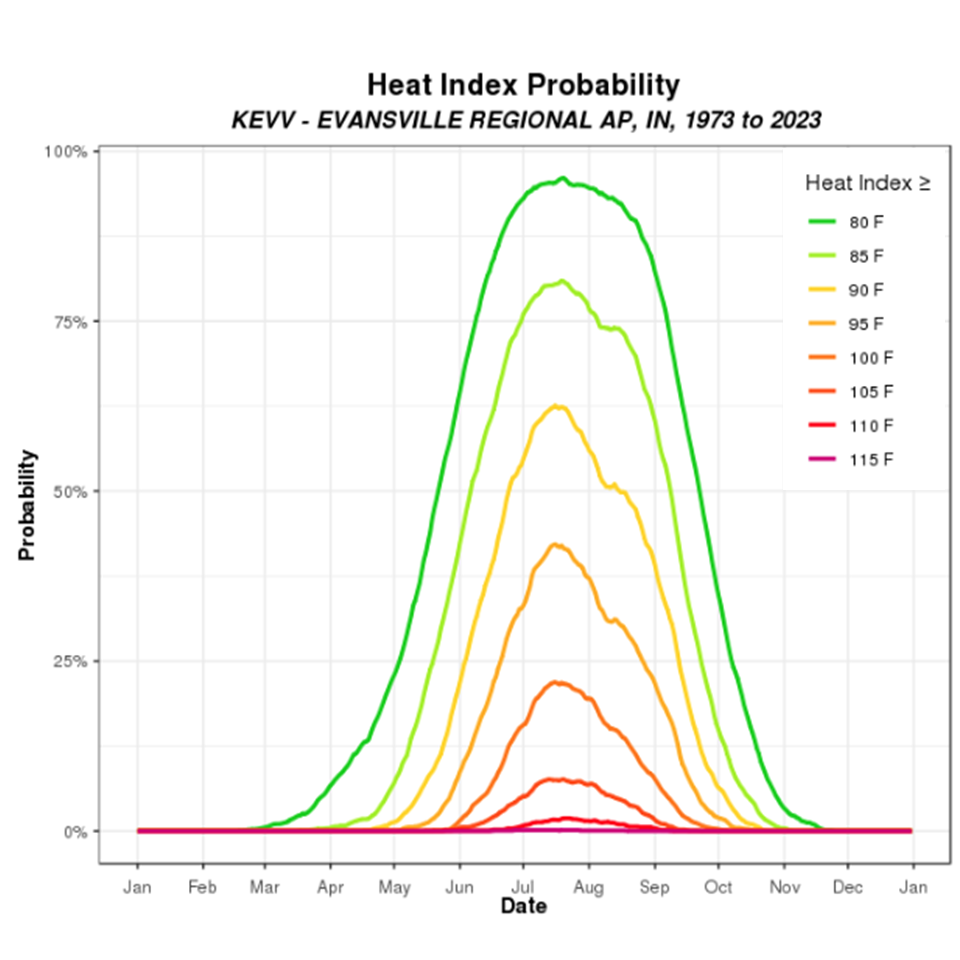
Heat Index Probability Curves (MRCC)
Analyze the probability of exceeding key heat index thresholds
The MRCC Heat Index Probability Curves tool provides interactive charts showing the likelihood of reaching or exceeding specific heat index values on any given day throughout the warm season. Users can explore how often dangerous heat levels occur at selected stations, supporting risk assessment for health, agriculture, and emergency planning.
- Visualize the daily probability of exceeding various heat index thresholds (e.g., 90°F, 95°F, 100°F)
- Compare heat risk profiles across different locations and time periods
- Identify peak periods for extreme heat to inform safety and management decisions
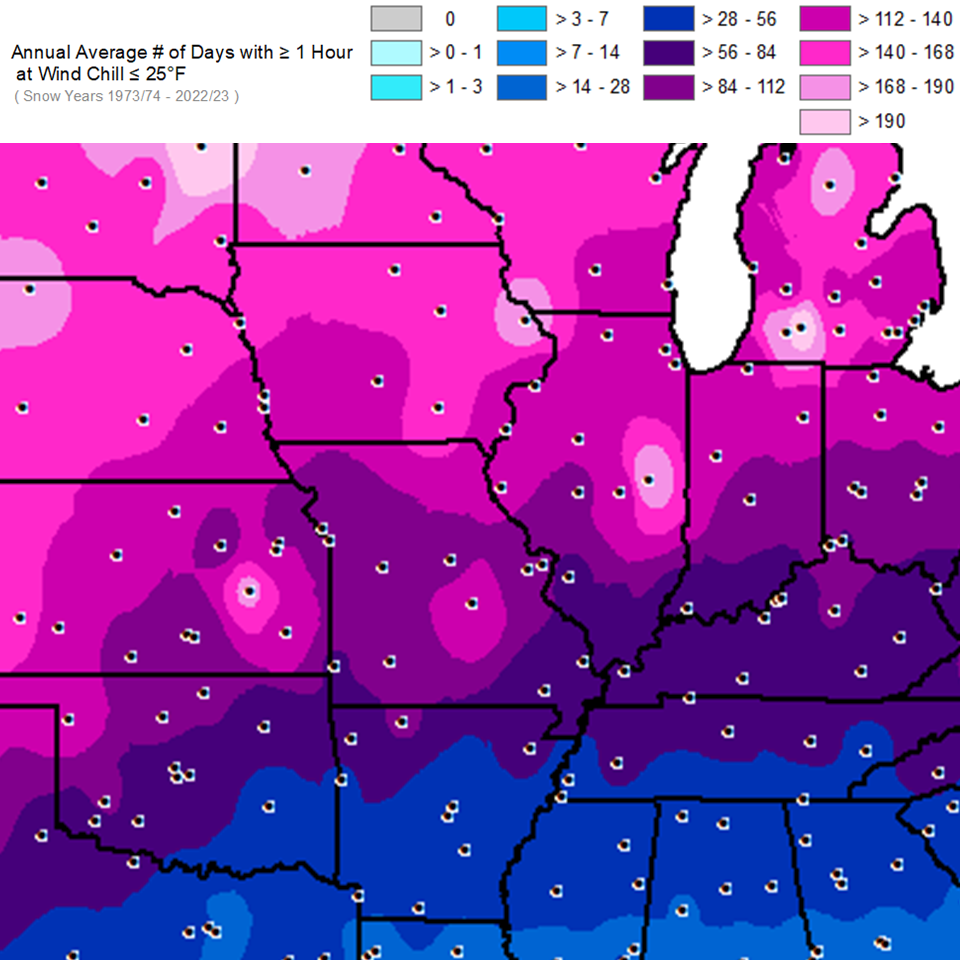
Wind Chill Maps (MRCC)
Visualize wind chill frequency and intensity across the eastern United States
These climatology maps show the annual count of days, hours, and days with a minimum of three hours at a specified wind chill threshold for states east of the Rocky Mountains.
- Map the number of days and hours below selected wind chill thresholds (e.g., -10°F, -20°F, -30°F)
- View annual counts of days with extended periods (minimum three hours) of dangerous wind chill
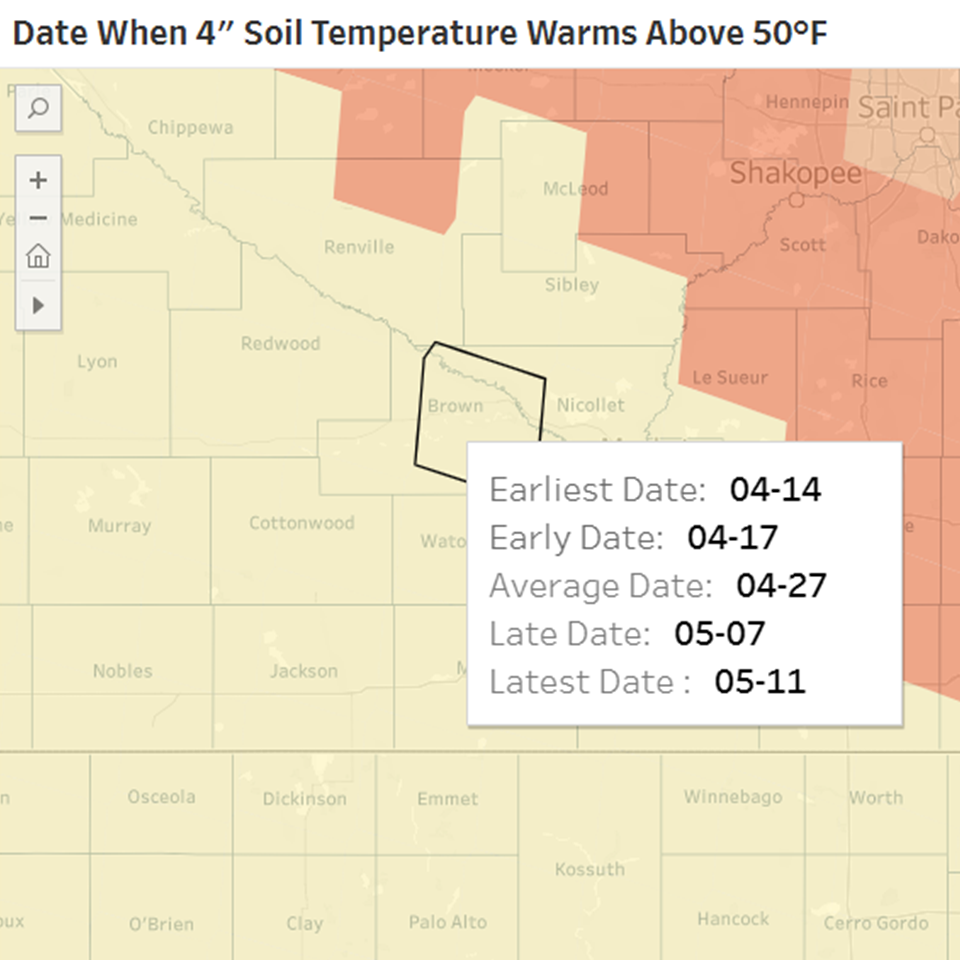
Soil Temperature Climatology (MRCC)
Explore historical soil temperature trends
View historical soil temperature statistics for the north central United States. This tool allows you to see the dates when soil temperatures at various depths rise above or fall below a user-specified threshold, supporting agricultural decision-making and planning.
- Historical soil temperature data for the north central US
- Select custom temperature thresholds
- Identify dates when soils warm above or cool below your chosen threshold
- Supports crop planting and management decisions