Welcome to the Vegetation Impact Program
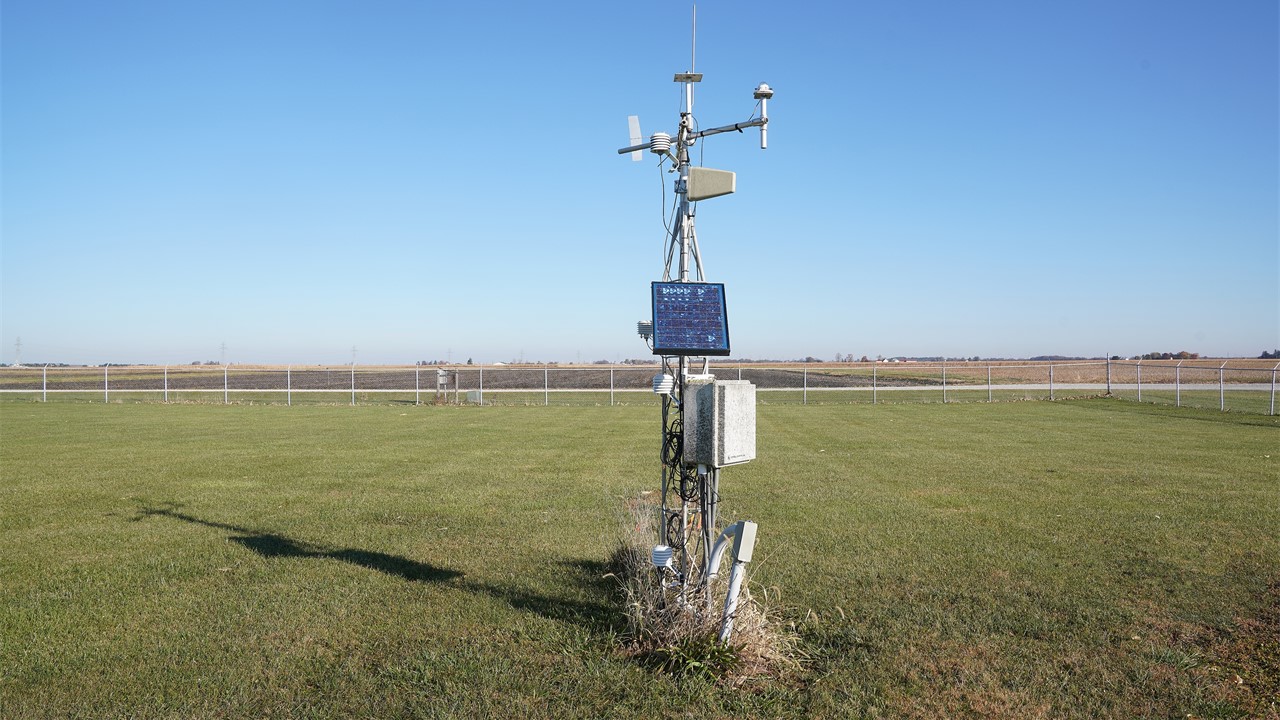
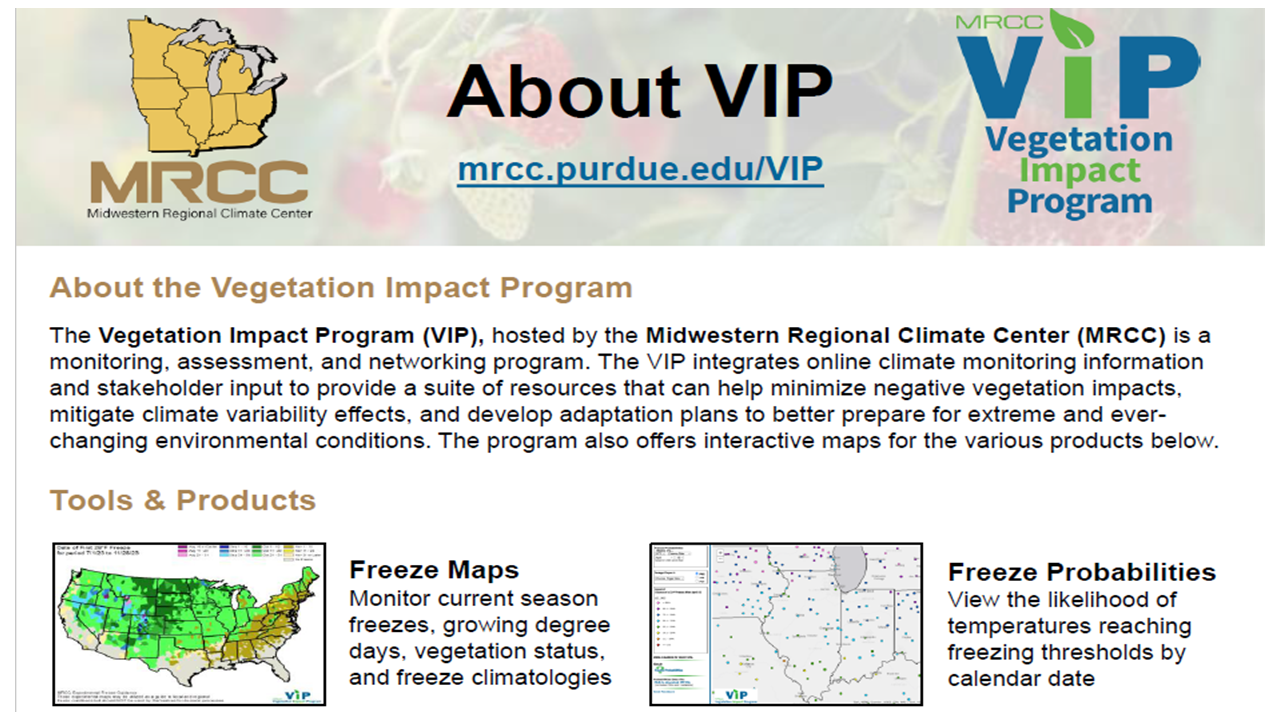
The Vegetation Impact Program (VIP) is a monitoring, assessment, and networking program hosted by the Midwestern Regional Climate Center. The VIP integrates online climate monitoring information and stakeholder input to provide a suite of resources that can help minimize negative vegetation impacts, mitigate climate variability effects, and develop adaptation plans to better prepare for extreme and ever-changing environmental conditions.
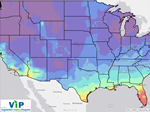
Freeze Guidance
Current Guidance Map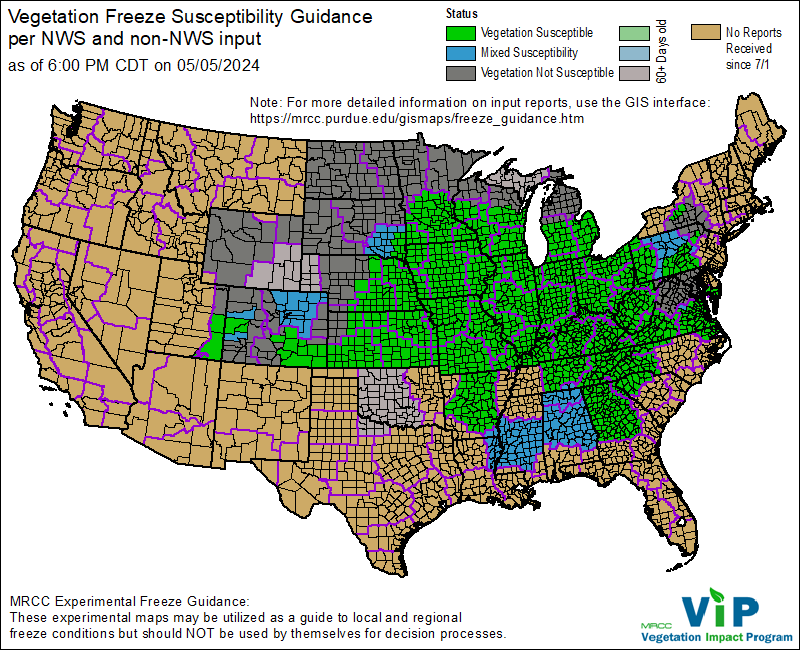 |
VIP Participants - Login Required Submit Guidance/Impact Form View All Guidance Submissions View All Impact Reports Access VIP Member List Interested in Submitting Freeze Guidance Reports? Join Freeze Guidance About Freeze Guidance |
Tools & Products
 Seasonal Freeze Maps: View the Freeze Maps dashboard to monitor current season freezes, growing degree days, vegetation status, and freeze climatologies.
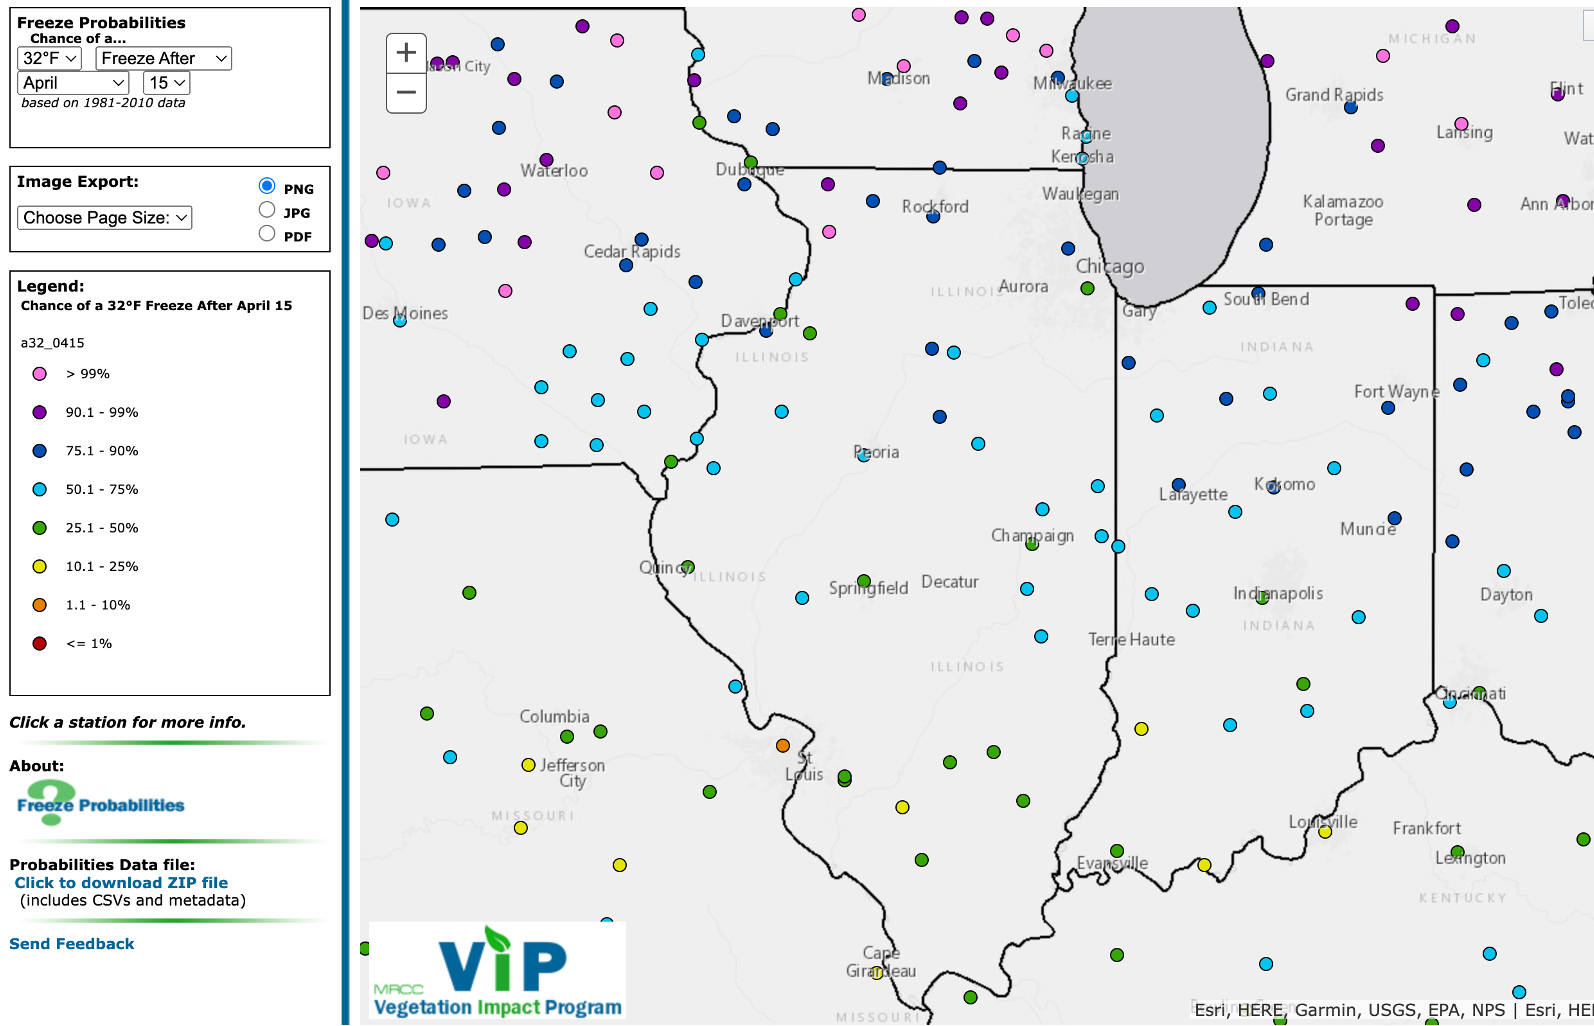 Freeze Probabilities: View the likelihood of the temperature dropping to freezing or below freezing - which constitutes a "freeze event".
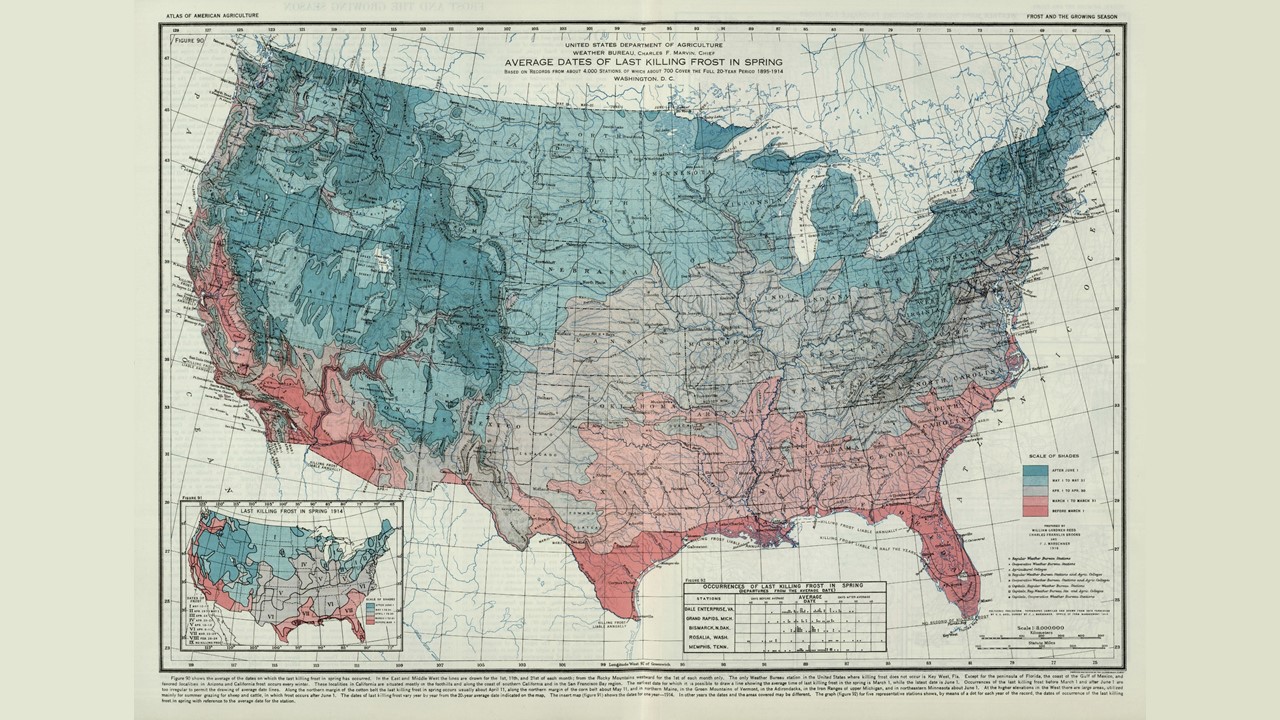
 Freeze Date Tool: Access climatologies of freezing temperature dates across the north-central and northeastern US.
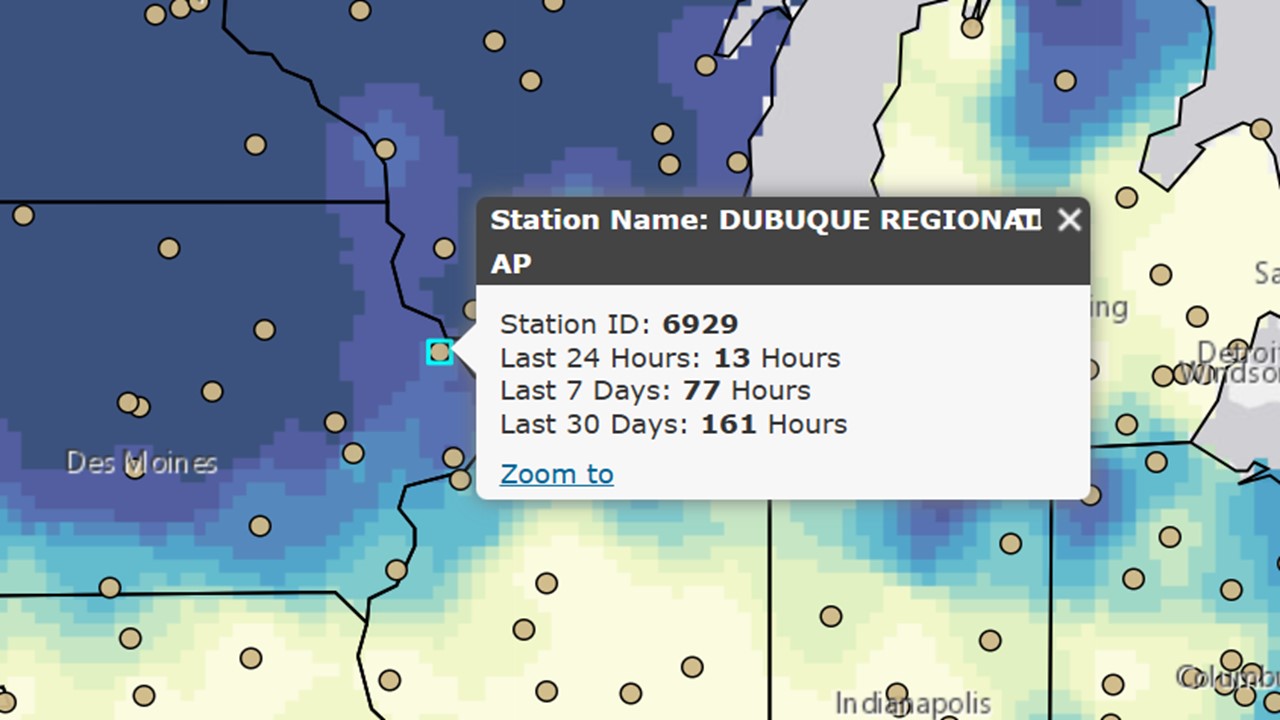 Hours Below Freezing Tool: View the greatest number of consecutive hours at or below freezing within the last 24 hours, 7 days and 30 days in this interactive GIS tool.
 End of Season Summaries: Access end of season summaries for days of first and last freezes for 32°F and 28°F thresholds and lowest minimum temperatures.
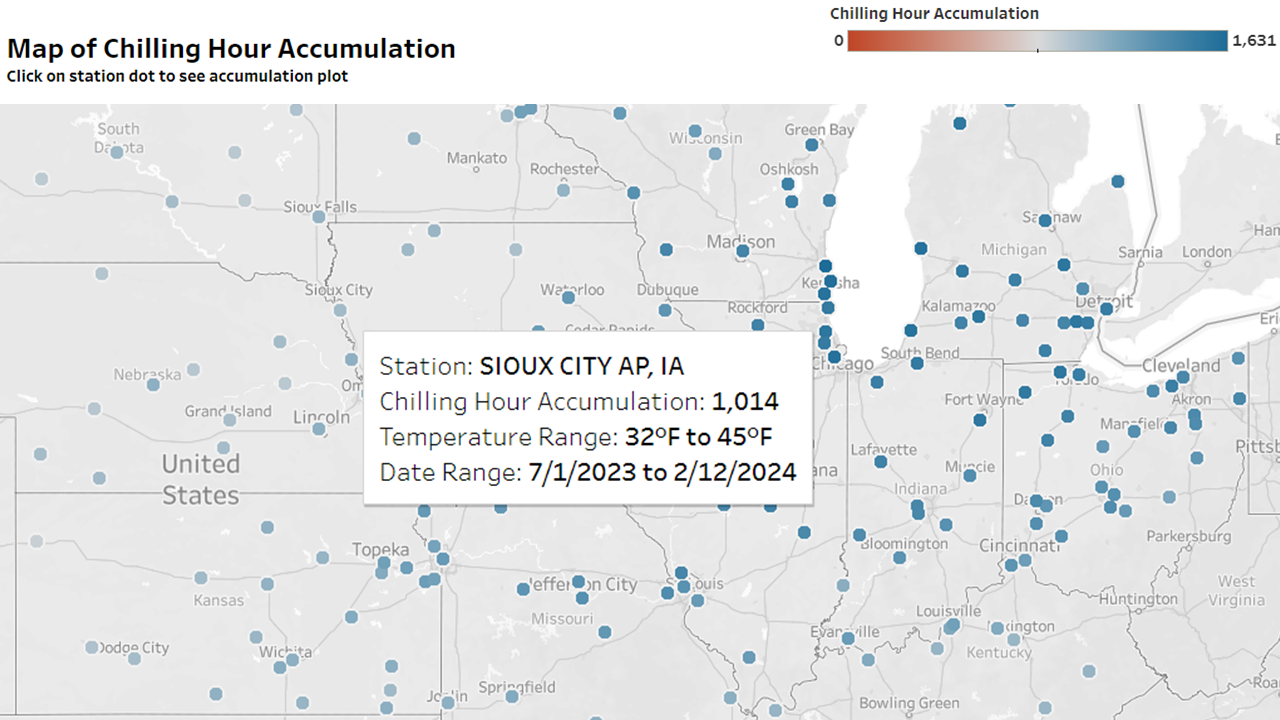 Custom Chilling Hours Tool: Track chilling hour accumulations for locations across the United States using customized temperature thresholds and time periods.
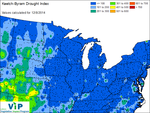 Keetch Byram Drought Index: Keetch-Bryam Drought Index (KBDI) is one of the few daily indices used to monitor drought, and is most often utilized in the wildfire community, for it can give a real-time indication of the drying potential for the finer fuels such as grasses and shrubs.
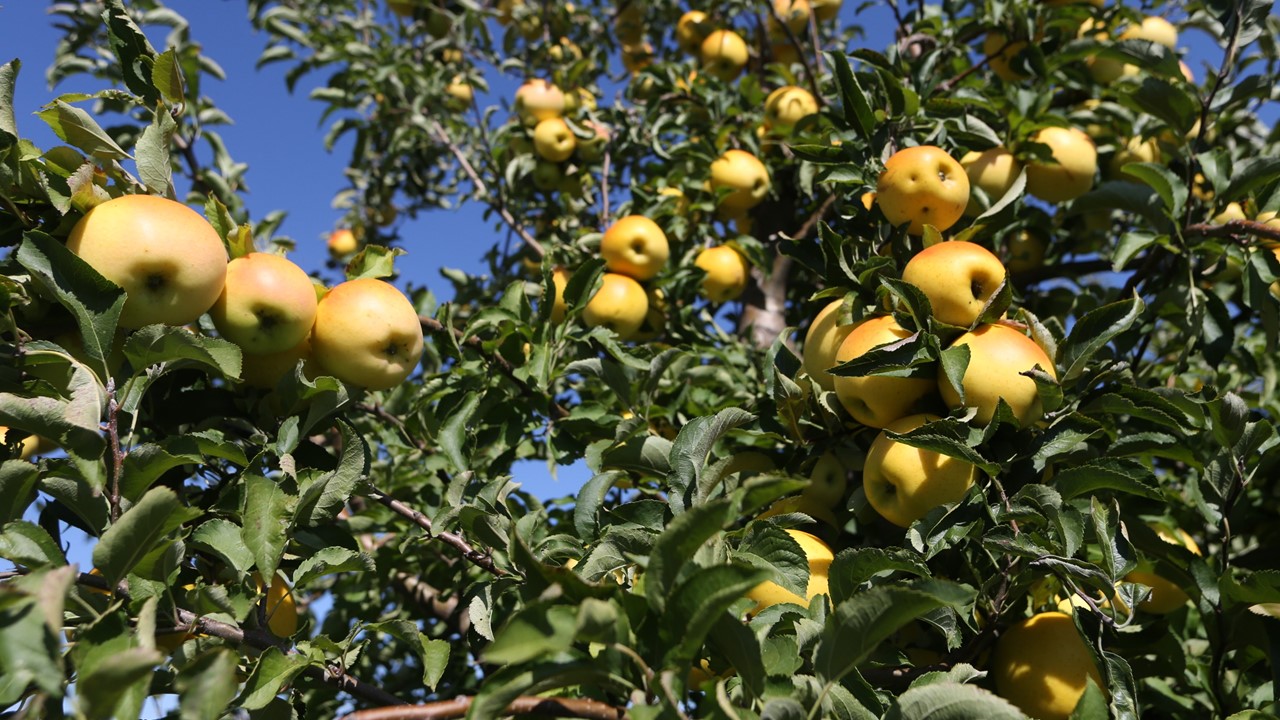
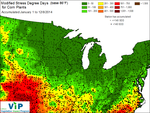 Stress Degree Days: All plants have an optimum range of temperatures for growth and Stress Degree Days (SDD) are a way of tracking how much stress a type of plant has been subjected to within its growing season.
GIS Interactive Products - Currently Under Construction
 GIS Freeze Maps Interface: Interact with GIS maps of guidance maps, impact reports, lowest minimum temperatures, most recent freeze maps, National Phenology Network Extended Spring Indices, growing degree days and freeze climatologies.
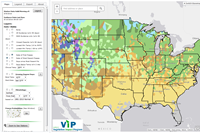
 GIS Vegetation Climate Map: This GIS version contains the Chilling Hours, Keetch-Byram Drought Index, and Stress Degree Days maps, all in one GIS interface.