Weather FAQ
Weather Terminology
(+/-) What is the difference between an Average and a Normal?
The arithmetic average of a meteorological element over 30 years is defined as the climatological normal. So, the key difference between the two is that a normal is strictly for 30 years, whereas an average can be computed over any time span. Official normals are calculated by the National Climatic Data Center for temperature and precipitation elements and are updated through the end of each decade ending in zero (for example, 1971-2000). These official normals can be slightly different from a strict average because they also take into account changes in the station over the thirty-year period. These changes can include changes in the instrumentation, the location, the observing practices, the observation time, or in the surrounding environment.
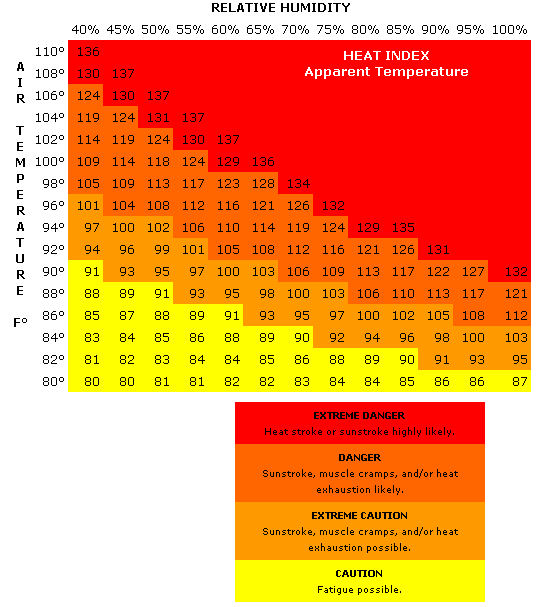
The Heat Index, also known as the apparent temperature, is an accurate measure of how hot it really feels when relative humidity (RH) is added to the actual air temperature. The National Weather Service derived the Heat Index in an effort to alert the public to the dangers of exposure to extended periods of heat, especially when high humidity acts along with the high temperatures to reduce the body's ability to cool itself.
One important fact to realize about the Heat Index is that it is computed for temperature readings taken in the shade and for a wind speed of approximately 6 miles per hour. Exposure to full sun can add up to 15 ° F to the Heat Index value!
To find the Heat Index from the table, find the air temperature along the left side of the table and the relative humidity along the top. Where the two intersect is the Heat Index.
Do you keep records of the Heat Index? If not, how do I calculate it? Because the Heat Index is a calculated value based off of air temperature and humidity, it is not archived with historic weather data. To calculate a specific value for a previous date, you will need to know the air temperature and humidity. This data is not typically available for cooperative observing stations, but is generally available for airports. The equation to calculate the Heat Index is as follows:
Where:
T = air temperature in degrees Fahrenheit
RH = relative humidity
The Wind Chill Temperature Index, sometimes also known as the equivalent temperature, is used to describe how cold people and animals feel when they experience heat loss caused by the combined effects of low temperature and wind.
When the wind blows across exposed skin, it removes the insulating layer of warm air that lies adjacent to the skin. This in turn drives down the skin temperature and eventually the internal body temperature. The faster the wind blows, the faster the heat is carried away, the greater the heat loss and the colder it feels.
A new Wind Chill Temperature Index took effect on November 1, 2001, replacing the original wind chill index that was derived in 1945. The original Wind Chill Index was developed by two Antarctic explorers and was based on research involving the time it took water in a plastic container to freeze. The new Wind Chill Temperature Index includes the latest advances in science, technology and computer modeling. It takes into account a calculated wind speed at average face height based on readings from winds measured at the national standard height of 33 feet. It is based on the exposure of a human face to cold versus a plastic container, incorporates modern heat transfer theory, lowers the calm wind threshold from 4 miles per hour to 3 miles per hour, and has a consistent standard for skin tissue resistance. The new Wind Chill Temperature Index currently assumes no impact from the sun, but it may yet be revised again for solar radiation impacts under various sky conditions (clear, partly sunny, cloudy). For additional information on the new Wind Chill Temperature Index, please see http://www.nws.noaa.gov/om/cold/wind_chill.shtml.
To find the Wind Chill Temperature Index from the table below, find the air temperature along the top of the table and the wind speed along the left side. Where the two intersect is the Wind Chill Temperature.
Lastly, while exposure to low wind chills can be life threatening to humans and animals, the only effect that wind chill has on an inanimate objects, such as vehicles, is that it shortens the time it takes the object to cool to the actual air temperature. The object cannot be cooled below the actual temperature.
Do you keep records of Wind Chill? If not, how do I calculate it? Because the Wind Chill Temperature Index is a calculated value based off of air temperature and wind speed, it is not archived with historic weather data. To calculate a specific Wind Chill Temperature for a previous date, you will need to know the air temperature and wind speed. This data is not typically available for cooperative observing stations, but is generally available for airports. The equation to calculate the Wind Chill Temperature Index is as follows:
Where:
T = air temperature in degrees Fahrenheit
V = wind speed in miles per hour
(+/-) What are Degree Days (Heating, Cooling & Growing)?
Heating Degree Days (HDD) are used as an index to estimate the amount of energy required for heating during the cool season. When the daily mean temperature falls below 65 degrees Fahrenheit, most buildings require heat to maintain a comfortable interior temperature. By monitoring heating fuel usage and heating degree day accumulation over a period of time, a building's energy consumption per HDD can be calculated and this value used, for example, in fuel consumption monitoring, energy efficiency evaluation or future fuel supply estimates. The daily mean temperature is found by adding together the high and low temperature for the day and dividing by two. When the mean temperature is above 65 ° F, the HDD total is zero. If the mean temperature is below 65 ° F, the HDD amount is the difference between 65 ° F and the mean temperature. For example, if the high temperature for the day was 68 ° F and the low 52 ° F, the mean temperature for the day would be 68 + 52 = 120 / 2 = 60 ° F. The Heating Degree Day total would then be 65 60 = 5 HDD.
In equation form:
Where:
TBASE = Heating Degree Day base temperature, usually 65
TMEAN = mean temperature, ![]()
Cooling Degree Days (CDD) are used as an index to estimate the amount of energy required for cooling during the warm season. When the temperature rises above 65 ° F, many buildings use air conditioning to maintain a comfortable indoor temperature. By monitoring air conditioner energy usage and cooling degree day accumulation over a period of time, a building's energy consumption per CDD can be calculated and this value used, for example, in energy use monitoring, energy efficiency evaluation or future energy usage estimates. The daily mean temperature is found by adding together the high and low temperature for the day and dividing by two. When the mean temperature is below 65 ° F, the CDD total is zero. If the mean temperature is above 65 ° F, the CDD amount is the difference between the mean temperature and 65. For example, if the high temperature for the day was 92 ° F and the low was 68 ° F, the mean temperature for the day would be 92 + 68 = 160 / 2 = 80 ° F. The Cooling Degree Days would then be 80 - 65 = 15 CDD.
In equation form:
Where:
TBASE = Cooling Degree Day base temperature, usually 65
TMEAN = mean temperature, ![]()
Growing Degree Days (GDD) are used to estimate the growth and development of plants and insects during the growing season. The basic concept is that development will only occur if the temperature exceeds some minimum development threshold, or base temperature (TBASE). The base temperatures are determined experimentally and are different for each organism.
| BASE TEMPERATURE | CROP |
|---|---|
| 40° F | wheat, barley, rye, oats, flaxseed, lettuce, asparagus |
| 45° F | sunflower, potato |
| 50° F | sweet corn, corn, sorghum, rice, soybeans, tomato |
| BASE TEMPERATURE | INSECT |
|---|---|
| 44° F | Corn Rootworm |
| 48° F | Alfalfa Weevil |
| 50° F | Black Cutworm, European Corn Borer |
| 52° F | Green Cloverworm |
To calculate GDDs, you must first find the mean temperature for the day. The mean temperature is found by adding together the high and low temperature for the day and dividing by two. If the mean temperature is at or below TBASE, then the Growing Degree Day value is zero. If the mean temperature is above TBASE, then the Growing Degree Day amount equals the mean temperature minus TBASE. For example, if the mean temperature was 75° F, then the GDD amount equals 10 for a TBASE of 65° F. You can think of Growing Degree Days as similar to Cooling Degree Days, only the base temperature can be something besides 65° F.
In equation form:
Where:
TBASE = Growing Degree Day base temperature
TMEAN = mean temperature, ![]()
Modified Growing Degree Days are similar to Growing Degree Days with several temperature adjustments. If the high temperature is above 86° F, it is reset to 86° F. If the low is below 50° F, it is reset to 50° F. Once the high/low temperatures have been modified (if needed), the average temperature for the day is computed and compared with a base temperature, which is usually 50° F. Modified Growing Degree Days are typically used to monitor the development of corn, the assumption being that development is limited once the temperature exceeds 86° F or falls below 50° F. For example, if the high for the day was 92° F and the low 68° F, the average for use in the modified GDD calculation would be 86 + 68 = 154 / 2 = 77.
Precipitation, Snowfall, Snow Depth
The amount of precipitation listed on a climate report is the Liquid Equivalent Precipitation. This value includes the melted amount of any frozen precipitation (e.g., snow, sleet) that may have fallen in addition to any rain. Why is this frozen precipitation collected and then melted before being measured? The density of liquid water is constant; however, the density of frozen precipitation can vary greatly. One inch of "heavy" snow contains more water than one inch of "light" snow. Measuring the liquid equivalent of frozen precipitation can indicate the actual amount of water that fell, regardless of the type of precipitation. These values can also later be used in calculating ground water issues when snowmelt occurs.
Sometimes people mistakenly try to determine the amount of water in a fresh snowfall by using a rule of thumb 10 to 1 ratio, assuming ten inches of snow melts to one inch of water. The problem with using this single ratio is that the density of snow can vary greatly from storm to storm and location to location. An extremely heavy, dense snow can have a ratio of only 3 to 1 (3 inches of snow melt to one inch of water), while very light snow can have up to a 100 to 1 ratio. That means only 1 inch liquid water can result in 100 inches of snow!
(+/-) What is the difference between snowfall and snow depth?
Snowfall is the amount of fresh snow that has fallen during the 24-hour measurement period, while the snow depth is the total amount of snow on the ground and includes both old and new snow. Snowfall is measured to the nearest 1/10th of an inch while snow depth is measured to the nearest inch.
Wind
(+/-) What does the wind direction in degrees mean?
Wind direction is measured in degrees, similar to reading a compass, and is reported as the direction the wind is blowing FROM.
East = 90 degrees
South = 180 degrees
West = 270 degrees
North = 360 degrees
For example, if the wind direction is 45 degrees, the winds are coming out of the northeast and blowing towards the southwest. This would be called a northeasterly wind.
A wind rose is a graphical representation of the wind speed and wind direction for a set of given dates at a particular location. The wind rose can be representative of the wind for a single month, a single year or a long-term average by month or year.
There are two graphics for each wind rose. One graphic depicts the average wind speed by wind direction in miles per hour. The other graphic represents the percentage of frequency by wind direction.
Click for Wind Rose graphics in new window
The Midwestern Regional Climate Center can generate wind roses for most major cities across the Midwestern United States. Tabular numeric data are also available. To find out further what wind roses are available, please contact the MRCC.
Severe Weather
(+/-) When is a thunderstorm considered "severe"?
A thunderstorm is considered severe if it produces wind gusts of 58 miles per hour or greater and/or hail that is 1 inch in diameter or larger, and/or a tornado. Severe thunderstorm reports are archived by the National Climatic Data Center and are available from their online Storm Events Database at http://www.ncdc.noaa.gov/stormevents/. Preliminary storm reports are collected by the Storm Prediction Center http://www.spc.noaa.gov/climo/. For an official copy of a Storm Data publication, please contact the Midwestern Regional Climate Center or the National Climatic Data Center.
(+/-) How fast are the winds in a tornado?
The winds in a tornado are classified by the Enhanced Fujita Scale (EF Scale), which is a modification of a scale created by Dr. T. Theodore Fujita. For more information on the EF Scale, visit the Storm Prediction Center website: http://www.spc.noaa.gov/efscale/.
| Enhanced Fujita Scale | Wind Speed (mph) | Expected Damage |
|---|---|---|
| EF-0 | 65 - 85 | Light |
| EF-1 | 86 - 110 | Moderate |
| EF-2 | 111 - 135 | Considerable |
| EF-3 | 136 - 165 | Severe |
| EF-4 | 166 - 200 | Devastating |
| EF-5 | Over 200 | Incredible |
(+/-) What is the difference between a watch and a warning?
A watch indicates that conditions are favorable for severe weather to develop. You should remain alert for changing weather conditions and be ready to move to a place of safety. A warning means that dangerous weather is occurring or imminent and that you should seek safety immediately!
Severe thunderstorm watches and tornado watches are issued by the Storm Prediction Center in Norman, Oklahoma. A watch may cover large portions of a state and will usually be in effect for a time period of 4 to 6 hours. Warnings are issued by your local forecast office on a county-by-county basis. Tornado and severe thunderstorm warnings are usually in effect for 30 to 60 minutes.
Other
(+/-) What does Observation Time mean?
Much of the data at the Midwestern Regional Climate Center comes from National Weather Service cooperative observing stations where an observer records the temperature and precipitation at the same time every day. A common observation time is 7:00 a.m. Precipitation measured at that time would be the total amount for the 24-hour period from 7:00 a.m. the day before to 7:00 a.m. the day of the observation. However, not all stations have a 7:00 a.m. observation time. Some record from midnight to midnight, producing a true daily record, while others may record in the evening.
Cooperative station data from the Midwestern Regional Climate Center will be stamped with an observation time of "AM", "PM", or "MID" to indicate the time of day when the observation was recorded. Whenever possible, the actual time of observation will be noted on the data.
The dew point temperature, wet bulb temperature and relative humidity all relate to the amount of moisture in the air. The dew point is the temperature to which the air must be cooled to reach saturation. The difference between the air temperature and the dew point temperature is proportional to the relative humidity. The closer the two temperatures are, the higher the relative humidity. When the air temperature becomes the same as the dew point temperature, the relative humidity reaches 100% and fog will develop and dew will form on surfaces.
A common misconception is that the relative humidity cannot exceed 100%. In fact, this does occur but it is a temporary condition. The temperature can actually drop below the dew point, causing the air to become super-saturated. This condition is corrected quickly as moisture condenses into liquid to form fog or dew. As the water vapor in the air decreases, the dew point temperature decreases and the relative humidity returns to 100%.
In the past, relative humidity was difficult to measure directly. An easier parameter to measure was the wet bulb temperature. This was found by placing a wet cloth over a thermometer, and then passing air over the cloth to evaporate the water. Initially, the evaporation of the water causes the temperature to decrease but the temperature eventually becomes constant. This steady temperature is called the wet bulb temperature and it relates to the amount of moisture in the air. It is then possible to calculate the dew point and relative humidity using the dry bulb and wet bulb air temperatures. These days, there are better methods for measuring relative humidity directly and there are few uses for the wet bulb temperature. In fact, it is unusual for the wet bulb to be measured directly anymore. It is now calculated from the air temperature and dew point or relative humidity.