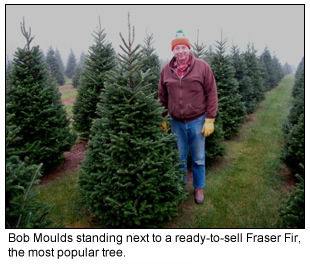
 Bob Moulds began his Christmas Tree farm, Wapsie Pines Tree Farm, in 1980. The tree farm, located just west of the Wapsipinicon River in Iowa, now has between 30,000-35,000 trees consisting of Fraser Fir (abies fraseri), Canaan Fir (abies balamea), Concolor Fir (abies concolor), Red Pine (pinus resinosa), Scotch Pine (pinus sylvestris), and White Pine (pinus strobus). The farm is operated as a “choose and cut” Christmas Tree farm, selling approximately 2,000 trees per year. Four thousand seedlings are planted each year, with expected maturity occurring in 7-9 years. Bob is currently the President of the Iowa Christmas Tree Growers Association and a retired engineer. Bob Moulds began his Christmas Tree farm, Wapsie Pines Tree Farm, in 1980. The tree farm, located just west of the Wapsipinicon River in Iowa, now has between 30,000-35,000 trees consisting of Fraser Fir (abies fraseri), Canaan Fir (abies balamea), Concolor Fir (abies concolor), Red Pine (pinus resinosa), Scotch Pine (pinus sylvestris), and White Pine (pinus strobus). The farm is operated as a “choose and cut” Christmas Tree farm, selling approximately 2,000 trees per year. Four thousand seedlings are planted each year, with expected maturity occurring in 7-9 years. Bob is currently the President of the Iowa Christmas Tree Growers Association and a retired engineer.
MRCC: In general, how does climate influence Christmas Tree farming?
BM: The climate affects Christmas tree farming in several ways. This year with the severe drought, it was very difficult for newly planted trees to survive because they had not yet established a good root system. In Iowa, reports from growers were from 50% to 100% loss of newly planted seedlings. The average loss was probably closer to 80-90%. In addition, some farms had high losses of trees planted the previous year. In some cases, trees up to four years were lost. Some mature trees were lost, but not significant. newly planted seedlings. The average loss was probably closer to 80-90%. In addition, some farms had high losses of trees planted the previous year. In some cases, trees up to four years were lost. Some mature trees were lost, but not significant.
Another climate issue is being too wet. In wet years such as two years ago, some seedling and larger trees were lost due to soil that was too wet, resulting in root failure. This particularly affected the popular Fraser Fir trees, which cannot tolerate wet soils.
In addition, the wet summer of two years ago provided an environment for needle fungus diseases and certain insect pests to proliferate. These can be controlled if closely monitored and timely application of pesticides is rigorously followed.
MRCC: What are the vulnerabilities (e.g. dry spells, pests, high heat, etc.) that affect Christmas Tree farming and how do these vulnerabilities vary by season?
BM: When trees such as Christmas Trees are grown in dense populations repeatedly on the same ground, there are many pests that have to be managed, just like any other crop. Certain varieties are susceptible to needle fungus diseases, which require careful monitoring and multiple timely applications of fungicides. Again, wet weather will promote fungus issues. In addition, there are some specific insects such as pine needle scale and spider mites that can be difficult to control and can ultimately destroy the trees.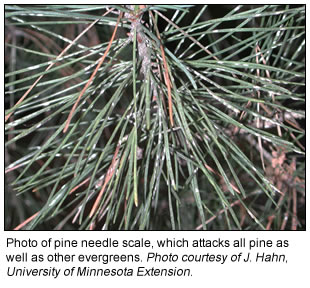
The only conifer native to Iowa is the white pine. This tree is used to some degree for Christmas Trees. It is very tolerant to the weather extremes of Iowa. The most popular tree, the Fraser Fir, is not native to Iowa, but rather native to the higher elevations of the Appalachian Mountains. This means that they are not particularly tolerant to specifically the high temperatures, which compounded the problem caused by the drought this summer. Young Fraser Firs cannot tolerate temperatures that are consistently over 100°F, especially if it is dry. In addition, more mature trees do not grow as well in these conditions.
Vulnerability is high when we have a severe winter with heavy snow cover. This results in heavy deer browsing damage since their normal sources of food are buried too deep in the snow. One tree farm close to my farm lost nearly all of their trees to deer damage two winters ago. It essentially put them out of business.
MRCC: Tell us about how the current drought has affected your operation and your concerns for next year.
BM: Our operation lost about 50% of the new plantings, specifically the fir trees which are not native to Iowa type climate extremes. We have always planted every year two times the number of trees that we will ultimately harvest. This is required to cover weather, insect, fungus, deer damage, poor genetics, and other losses over the 7-9 year growing period. So our operation will compensate for this loss reasonably well by planting extra seedlings next year. The problem will be much more serious if 2013 is another problem weather year. Some farms in Iowa that have lost second year plantings will result in a serious problem in 6-8 years when they will have a shortage.
MRCC Extension Climatologist Molly Woloszyn may be reached via email at mollyw@illinois.edu
^Top
|


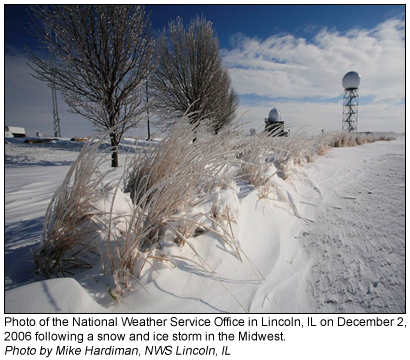
 For the past five years, a dedicated group of volunteer precipitation observers has been contributing valuable snowfall and snow depth observations from around the country. More than 10,000 volunteer observers with the Community Collaborative Rain, Hail, and Snow Network (CoCoRaHS) measure precipitation each day and report their observations to a central web site where the data is freely available. Many of these observers report new snowfall, daily snow depth, and the water content of the snow on the ground. These observations supplement those collected by the National Weather Service observers.
  while billions of dollars are spent to remove snow from roads and runways. Some degree of snowmelt-related flooding occurs every year in the United States, with the severity of flooding dependent upon many factors such as snow accumulation, fall soil moisture, and the rate and timing of spring snow melt.
 particular, can make snowfall measurement challenging. Sleet, freezing rain, and rain falling with the snow add additional measurement challenges. Observers with CoCoRaHS and the U.S. Cooperative Network are trained on how to measure and report snow.
  snow on the ground. The observer takes a core of snow from the snow pack and melts the core to get the water equivalent. This measurement is especially important to river and flood forecasting, as it essentially tells the hydrologist how much water is “sitting on the ground” in frozen form. This can be factored in with expected precipitation to determine how much runoff might go into rivers and streams.

") November was a dry month across most of the country, and the Midwest was no exception. A few northern locations were near normal but most of the region received less than half their normal November precipitation. Areas with less than 25% of normal touched all nine Midwest states. Ohio and Indiana ranked as the 4th driest November on record, while Kentucky (5th) and Michigan (7th) were also among the top-ten driest. Year-to-date totals in Iowa (8th) and Missouri (9th) were among the driest years on record.
November was a dry month across most of the country, and the Midwest was no exception. A few northern locations were near normal but most of the region received less than half their normal November precipitation. Areas with less than 25% of normal touched all nine Midwest states. Ohio and Indiana ranked as the 4th driest November on record, while Kentucky (5th) and Michigan (7th) were also among the top-ten driest. Year-to-date totals in Iowa (8th) and Missouri (9th) were among the driest years on record. The National Climatic Data Center prepares an extensive report each month detailing the
 Austin, TX (Jan. 6-11) - Annual Meeting of the American Meteorological Society