The weather across the Upper Ohio Valley is known for being diverse, especially during the colder months of the year. Lake Erie, he smallest and shallowest of the five Great Lakes, dominates the weather across the region during the winter months.  Frequent rounds of lake-effect or lake-enhanced snow occur from northern Ohio eastward into western New York. Annual snowfall totals are often in excess of 150 inches and sometimes exceed 200 inches downwind of the lake. The primary Lake Erie snowbelt stretches from Cleveland across northeastern Ohio and into Erie and Crawford counties of western Pennsylvania (Figure 1). The National Weather Service Office in Cleveland serves this area and issues dozens of Lake-Effect Snow Watches, Warnings and Advisories each winter. Lake-effect snow occurs downwind of all of the Great Lakes but the Lake Erie snowbelt is differentiated from the others by its population density. Approximately 3.2 million people live in the counties that make up the primary snowbelt. The secondary snowbelt, which stretches west and south from Cleveland and encompasses much of north-central Ohio, is populated by another million people. Frequent rounds of lake-effect or lake-enhanced snow occur from northern Ohio eastward into western New York. Annual snowfall totals are often in excess of 150 inches and sometimes exceed 200 inches downwind of the lake. The primary Lake Erie snowbelt stretches from Cleveland across northeastern Ohio and into Erie and Crawford counties of western Pennsylvania (Figure 1). The National Weather Service Office in Cleveland serves this area and issues dozens of Lake-Effect Snow Watches, Warnings and Advisories each winter. Lake-effect snow occurs downwind of all of the Great Lakes but the Lake Erie snowbelt is differentiated from the others by its population density. Approximately 3.2 million people live in the counties that make up the primary snowbelt. The secondary snowbelt, which stretches west and south from Cleveland and encompasses much of north-central Ohio, is populated by another million people.
Lake-effect snowstorms can cause millions of dollars of damage. Prolonged lake-effect snow events often produce two to three feet of snow accumulation, with tree damage, power outages, vehicle accidents and roof damage common during these events. Early or late season snows are extremely dangerous and often result in widespread power outages, especially if the trees have leaves. In November 1996, as much as five feet of snow accumulated in portions of northeastern Ohio during the first few days of the month and on April 23-25, 2006, over two feet of snow fell on much of the Cleveland Metropolitan area. Damage to trees was significant and widespread power outages occurred during both storms.
Lake-Effect Snow Basics
So what is lake-effect snow and what causes it? Lake-effect snow is caused by the interaction of cold air moving across the relatively warm waters of a body of water, in this case Lake Erie. Latent heat release from the lake moistens and warms the lower atmosphere. This interaction causes condensation which leads to cloud formation, and eventually to precipitation if moisture is sufficient. If temperatures are cold enough, the precipitation will fall as snow (Figure 2). The larger the temperature difference between the surface of the lake and the lower atmosphere, the more intense the precipitation can be. Meteorologists commonly use temperatures at the 850-millibar pressure level (approximately 5,000 feet) to forecast the likelihood of precipitation. If the difference in temperature from the lake surface to 850 millibars exceeds 13°C, the likelihood of lake-effect precipitation is enhanced. If the difference in temperature from the lake surface to 500 millibars (approximately 18,000 feet) reaches 40°C, then thunder and lightning become possible. Snowfall rates greater than 2 to 4 inches per hour can occur during these episodes of extreme instability. 
Other factors influence the onset of lake-effect precipitation. The distance that an airmass is over a body of water is called a fetch (Figure 3). Larger fetches result in an increased likelihood  of significant precipitation. On Lake Erie, the best fetches for heavy snow in northeast Ohio are from the northwest. Northwestern Pennsylvania receives its heaviest snow from a more westerly fetch across Lake Erie. of significant precipitation. On Lake Erie, the best fetches for heavy snow in northeast Ohio are from the northwest. Northwestern Pennsylvania receives its heaviest snow from a more westerly fetch across Lake Erie.
Orography, or the terrain surrounding the lake, also plays a role in the development of lake-effect precipitation. Forced orographic ascent effectively squeezes precipitation out of the cloud deck resulting in increased precipitation totals. The surface of Lake Erie lies around 570 feet above mean sea level. The terrain rises around 700 feet from the shoreline to northern Geauga County, where peak snowfall totals in Ohio are often reported. In northwestern Pennsylvania, up to 1,200 feet of ascent occurs from the lake to the eastern ends of Erie and Crawford Counties (Figure 4). 
The most common limiting factor to lake-effect precipitation is a lack of low-level moisture in the atmosphere. Cold air masses originating from well upstream of Lake Erie are often very dry and it is tough for the atmosphere to overcome this lack of moisture. During lake-effect snow events with northerly wind regimes, Lake Huron can act as a supplemental source of moisture for snow falling in northern Ohio.
Lake Erie Climatology
The water in Lake Erie typically experiences about a 40° temperature variation over the course of a year. Temperatures peak in early August and then steadily fall through the autumn months. Temperatures usually reach a minimum value in late January and then vary no more than a degree or two into early March (Figure 5).

Even though Lake Erie is the shallowest, smallest and southernmost of the five Great Lakes, it has the highest average peak ice coverage (Figure 6). However, the ice coverage on Lake Erie  is highly variable from year to year. During cold winters, ice coverage on the lake can peak at nearly 100% while in mild winters, it can be as low as 5% to 10%. The winter of 2011-2012 was extremely mild and resulted in little ice cover on Lake Erie. is highly variable from year to year. During cold winters, ice coverage on the lake can peak at nearly 100% while in mild winters, it can be as low as 5% to 10%. The winter of 2011-2012 was extremely mild and resulted in little ice cover on Lake Erie.
Snowfall Normals
The National Weather Service in Cleveland relies on a network of volunteer snow spotters that report twice a day during the winter months. This data is augmented by trained observers at all of the major climate sites. Peak normal values in Ohio are around 120 inches of snow per season with upwards of 180 inches in portions of inland Erie County, Pennsylvania (Figure 7). Normal snowfall totals vary considerably across the area. For example, a nearly 60-inch range in normal snowfall totals exists across Cuyahoga County, which includes the City of Cleveland. Six of the past ten years have seen peak snowfall totals in northwest Pennsylvania in excess of 200 inches. During this same period, northeast Ohio saw peak totals exceed 200 inches once and 170 inches six times.

Locations in the snowbelt can expect to see about 40 to 50 days of measurable snowfall each winter. By comparison, Columbus in the central part of Ohio and away from the lake-effect snowbelt, sees an average of 21 days of measurable snowfall each winter. Lake-effect snowfall contributes a large percentage to the annual precipitation totals. Locations on the periphery of the snowbelt get about 20% of their annual precipitation during the months of December, January and February. During especially snowy seasons, some areas can see more than a third of their annual precipitation during these same three months.
Summary
Lake Erie is responsible for the dynamic winter weather across the Upper Ohio Valley. Lake-effect snow remains very challenging to forecast given the variety of factors that affect its development. It is also challenging for the residents that deal with it on a frequent basis. Can you imagine yourself living in an area that gets 20 feet of snow each winter? That’s the reality of living downwind of Lake Erie.
For more information on this article or the Cleveland National Weather Service office, please contact Will Kubina via email at will.kubina@noaa.gov
^Top
|


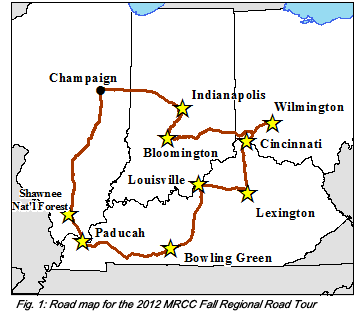 The fall colors were abundant during the Midwestern Regional Climate Center’s (MRCC) final regional road trip of 2012 (Figure 1). With the headquarters of the MRCC being in the heart of some of the flattest farmland in the US, it was breathtaking to get out and see all of the wonderful autumn colors, forests, and diverse landscapes within the MRCC region! There were several storms that were chasing us on our way east, but we managed to dodge all of those raindrops. It was only on our last day, back to Champaign, that we encountered any rain – as if to mark the sadness of seeing the regional road trip come to a close.
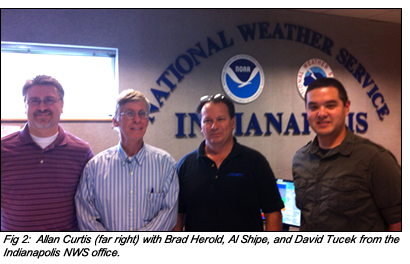 needs. Topics such as the 2012 drought, the need for better drought tools such as evapotranspiration and soil moisture, and the concern over the potential loss of thousands of surface weather observation stations throughout the country were common among all offices. Indianapolis NWS is involved with the preparations for the 100th anniversary of the 1913 flood along with the MRCC, Wilmington NWS, and Cleveland NWS. The Louisville NWS provided us great feedback on how we could improve our online climate products and website historical resources. Finally, Paducah NWS kept us laughing throughout the entire visit due to their great attitudes and enthusiasm toward climate and weather.
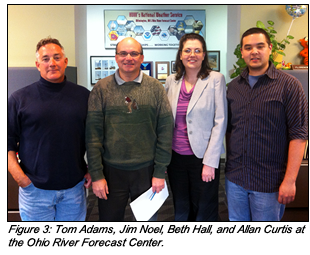
 developed for the state – particularly in terms of agriculture and energy. With the Kentucky Mesonet providing copious amounts of data, the opportunities for climate information when the spatial density is high is truly enviable. The MRCC looks forward to working with both universities in the future to find out how we can not only collaborate with transferring several state products to a regional scale, but also utilize their mesonet data as much as possible!
 next year in addition to exploring ways in which the MRCC can form a stronger partnership with those protecting our state and national forests.
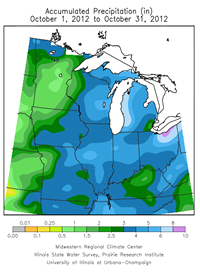 The month of October brought near to above normal precipitation to much of the Midwest. The highest precipitation totals of 6” to 10” in northeastern Ohio resulted from Hurricane Sandy making landfall on the East Coast of the United States at the end of the month. While the impacts of Sandy were greatest on the East Coast, the storm system also brought significant rainfall and snowfall to the eastern Midwest, as well as damage from the very high wind gusts and rough, high waves on Lake Erie.
  Milwaukee, WI (Nov. 12-15) - Annual NIFC Predictive Services Workshop