freezedatetoolabout
About the Freeze Date Tool:
Description:
The Freeze Date Tool is a product created by the Midwestern Regional Climate Center (MRCC) in collaboration with the USDA Midwest Climate Hub to provide information about the climatology of freezing temperature dates across the north-central and northeastern United States. This tool can be used to answer questions such as:
- On average, what day of the year does this county experience its first fall 32 °F freeze?
- What would be considered an early last spring 28 °F freeze for this county?
- When did the record latest first fall 32 °F freeze occur for this county?
- How have the dates of the last spring 30 °F freeze changed over time across the region?
- Has the growing season for this county gotten statistically significantly longer over time?
Definitions:
- Freeze Date: A freeze date is defined as any date in which the observed minimum temperature reached a specified freezing temperature threshold.
- Earliest: The earliest date on record where the freezing temperature threshold was reached.
- Early: Statistically, "early" is defined as the 10th percentile of all freeze dates on record for that location. Stated more simply, only 10% of all freeze dates occurred earlier than the "early" freeze date.
- Average: The statistical mean of all freeze dates on record for this location.
- Late: Statistically, "late" is defined as the 90th percentile of all freeze dates on record for that location. Stated more simply, only 10% of all freeze dates occurred later than the "late" freeze date.
- Latest: The latest date on record where the freezing temperature threshold was reached.
- First Fall Freeze: The first date during the fall when a given freeze threshold was met. This date does not have to occur during the fall season. Rather, it describes the first time after a prolonged period of non-freezing temperatures that the minimum temperature reached the specified freeze temperature threshold.
- Last Spring Freeze: The last date during the spring when a given freeze threshold was met. This date does not have to occur during the spring season. Rather, it describes the last time before a prolonged period of non-freezing temperatures that the minimum temperature reached the specified freeze temperature threshold.
- Growing Season: The consecutive period of time (number of days) between the last spring freeze and the first fall freeze in a given year.
- Shortest: The shortest length of a growing season on record.
- Short: Statistically, "short" is defined as the 10th percentile of all growing season lengths on record for that location. Stated more simply, only 10% of all growing seasons had shorter growing season lengths than the "short" growing season.
- Average: The statistical mean of all growing season lengths on record for this location.
- Long: Statistically, "long" is defined as the 90th percentile of all growing season lengths on record for that location. Stated more simply, only 10% of all growing seasons had longer growing season lengths than the "long" growing season.
- Longest: The longest length of a growing season on record.
Trends:
All trends in the Freeze Date Tool are calculated using a simple linear regression to quantify changes in the data over time. The magnitude of each trend is determined by the slope of the regression line, which represents the average rate of change in freeze dates. The statistical significance of these trends is evaluated by testing whether the slope is statistically different from zero, based on a 95% confidence interval. It is important to note that because climatological data can exhibit non-linear patterns over time, these linear trends should be interpreted with caution.
Example Output: Trend in Freeze Dates for Portage County, Wisconsin
The graph below shows a time series of first fall freeze dates at 32°F for Portage County, Wisconsin, using data from 1950 to the most recent year available. The x-axis represents each calendar year, while the y-axis marks the corresponding date when the first freeze at 32°F occurred. Dots higher on the graph represent freeze dates earlier in the fall season (such as September or October), while dots lower on the graph represent freeze dates later in the season (like November or December). This visualization effectively highlights the trend in the timing of the first fall freeze. The straight black line on the chart represents a linear regression trendline, which is the best-fit line through the freeze date data points, illustrating how these dates have changed over time. Accompanying the trendline are confidence curves based on a 95% confidence interval, which offer a range indicating where the true regression line is most likely to lie. Essentially, there is a 95% probability that the actual trend falls within these bounds. The confidence curves are narrower near the center of the graph and widen towards the start and end points, reflecting greater uncertainty in the trend near the beginning and end of the time series. The proximity of the two confidence interval lines can also indicate the significance of the trend. The closer these lines are to each other, the more statistically significant the trend is, suggesting a clearer pattern in the shift of freeze dates over time.

The Portage County, Wisconsin trendline indicates that the 32°F freeze events are generally occurring later in the year. This shift suggests that fall temperatures are remaining warmer for longer periods, potentially reflecting a trend toward milder fall conditions or a warming climate over the period analyzed. The delayed onset of first freeze could have significant implications for local agriculture, ecosystems, and frost-sensitive vegetation, potentially extending the growing season. However, it is important to note that these trends do not predict future freeze events, and local freeze alerts should always be monitored.
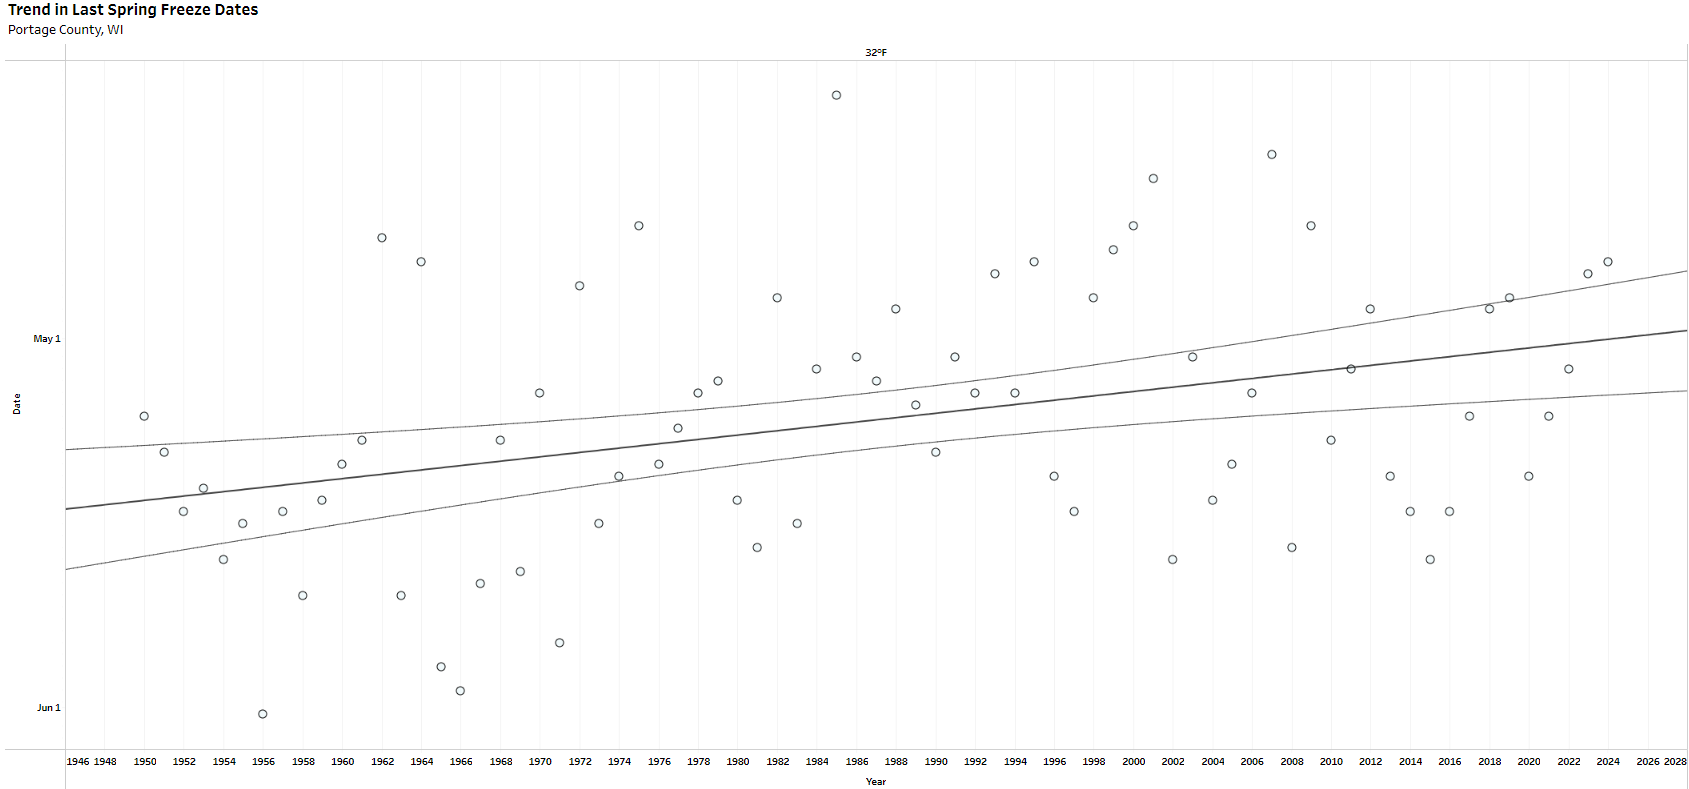
The graph below illustrates the trend in the last spring freeze dates for 32°F for Portage County, Wisconsin. For each calendar year (x-axis), the date of the last freeze (y-axis) is plotted as a dot. Dots toward the top of the chart indicate earlier dates in the spring season (i.e. March, April) while dots toward the bottom of the chart indicate dates later in the spring season (i.e. May, June).
Example Output: Trend in Growing Season for Portage County, Wisconsin
The graph below illustrates the trend in Growing Season length for Portage County, Wisconsin, for the 32°F temperature threshold. The growing season is defined as the consecutive period between the last spring freeze and the first fall freeze. Each year’s growing season length is represented by a green bar, with darker green indicating a longer growing season and lighter green indicating a shorter growing season. The y-axis displays earlier calendar dates toward the top and later calendar dates toward the bottom. Dashed horizontal lines at the top and bottom of the chart denote the average last freeze date in the spring and the average first freeze date in the fall, respectively. The solid lines at the top and bottom of the chart are trend lines for the date of last spring freeze and first fall freeze.
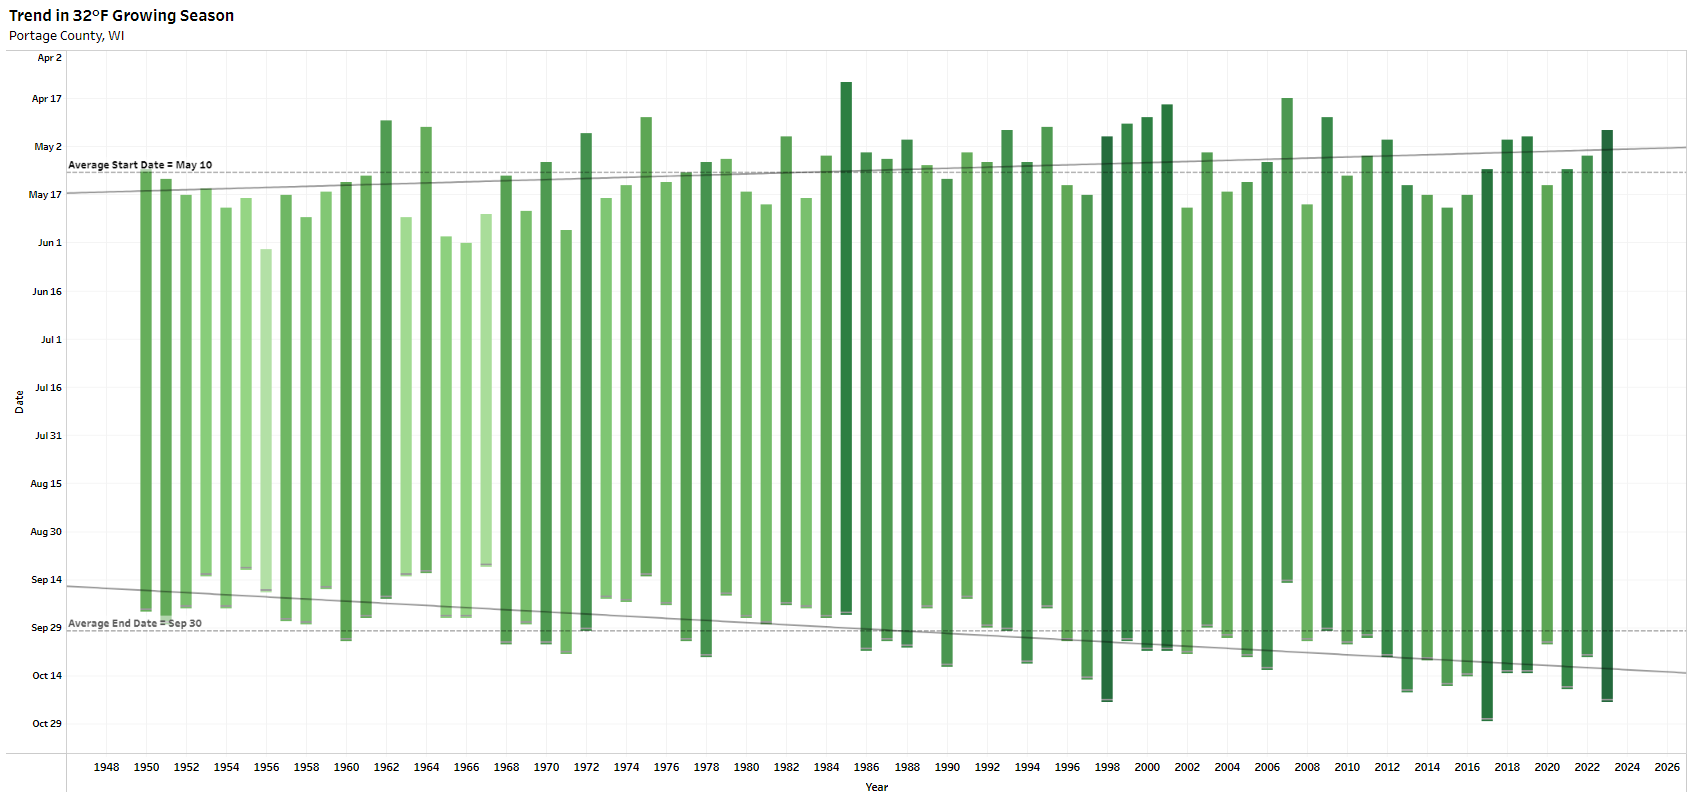
In Portage County, Wisconsin, the average last spring freeze date is May 10, while the average first fall freeze date is September 29. The linear trendlines show the growing season is lengthening due to the last spring freeze happening earlier in the year and the last fall freeze happening later. Trends in Growing Season can be further explored for 20°F, 25°F, 28°F, 30°F, 32°F, 35°F, 36°F, and 40°F.
Example Output: Freeze by Decade for Portage County, Wisconsin
The "Freezes by Decade" section of the tool groups freeze date data into 10-year intervals. Below is an example output for the first fall 32°F freeze date in Portage County, Wisconsin, visualized using box and whisker plots. The x-axis represents the dates on which the freezes occurred. The y-axis groups these events by decade (1950s is the top box and whisker set, 2010s is the bottom set), with each freeze event plotted as a dot. These plots provide several key components:
- Gray Box (Interquartile Range or IQR): Represents the middle 50% of the data, where most values fall. The left edge marks the first quartile (Q1), and the right edge marks the third quartile (Q3).
- Solid Line Inside the Gray Box: Indicates the median, or the middle value of the dataset.
- Dashed Line Outside the Gray Box: Represents the average (mean) of the dataset.
- Whiskers: Lines extending from the edges of the gray box that show the full range of the data, excluding any statistical outliers. If outliers are present, the whiskers represent the range from the lowest non-outlier value to the highest non-outlier value. This is calculated as follows: the lower whisker extends to the smallest value within 1.5 times the IQR below Q1, and the upper whisker extends to the largest value within 1.5 times the IQR above Q3.
- Outliers: Shown as individual dots beyond the whiskers, these are data points that fall significantly outside the range of the rest of the dataset. It is important to note that not every plot will include outliers.

The plot shows a general trend of the first fall freeze dates shifting later in the calendar year over the decades. This is evident from the shift of the gray boxes, which represent the interquartile range (IQR) for each decade. In more recent decades, these boxes have shifted to the right, indicating that both the median and average freeze dates are occurring later in the fall compared to earlier decades. Additionally, the whiskers and outlier points reveal an increase in variability in recent decades (demonstrated by longer whiskers). This greater variability suggests that while the general trend points to later freeze dates, there is more fluctuation in the timing of the first fall freeze. However, in the case of Portage County, WIsconsin, it is notable that the box and whiskers for the 2010s have no overlap at all with the box and whiskers from the 1950s, indicating a sizable shift in first freeze dates.
Data:
The Freeze Date Tool uses the Northeast Regional Climate Center's interpolated dataset from the Applied Climate Information System (ACIS) to obtain spatially continuous daily surface minimum temperature observations. These observations were spatially aggregated by taking the average of all daily surface minimum temperature observations within each county to obtain a single minimum temperature observation for each county. Please be aware that local freeze conditions may differ from the county averages used in this tool due to influences from topography and data availability.
The growing season is defined by the longest period of continuous above-freezing temperatures in a given year. Similarly, the last spring freeze and first fall freeze are the freezes that occur immediately preceding or following that same period of continuous above-freezing temperatures respectively.
Data in the tool are automatically updated twice per year (on January 1 and July 1) and include data from 1950 through the most recent spring or fall season.