About Climate Summary Tables
Access comprehensive tabular data from the U.S. Cooperative Observer (COOP) Network, featuring essential climate metrics such as climate normals, temperature and precipitation extremes, and threshold climatologies. This data is sourced from both the COOP Network and select National Weather Service sites across the MRCC’s 9-state region. To use the Climate Summary Tables, users first select the data type and state of interest, then click the ‘Get Stations List’ button.
Data Sources:
Data are obtained from the Applied Climate Information System (ACIS). Extremes data update daily for active stations, while other data are updated after the end of each normals period. Although they are not directly available from ACIS, GDD40 and MGDD values are calculated using temperature values obtained from ACIS, and threshold exceedance values are calculated using parameter values obtained from ACIS. More information about ACIS is available at https://www.rcc-acis.org.
Considerations:
Periods of Record - Periods of record are displayed within the relevant output tables in this tool. For decommissioned stations, the end date will indicate when the station ceased operation. For active stations, the end date reflects the most recent data available. The records are updated daily. The delay is typically one to two days for most stations, but it can be longer in some cases.
Seasons - Many output tables categorize data by meteorological seasons, which are defined as follows:
- Spring: - March, April, and May
- Summer: - June, July, and August
- Autumn: - September, October, and November
- Winter: - December, January, and February
Winter seasons are labelled by the year in which January and February occur. For example, December 2025-February 2026 is labelled Winter 2026.
Snow Year - Snowfall extremes use a July-June snow year rather than the calendar year. A snow year is labelled by the year in which it ends. For example, July 2025-June 2026 snow year is labelled 2026.
Growing Season - Strictly speaking, the growing season is defined as the length of time between the last occurrence of a critical temperature threshold (e.g., 32°F), usually in the spring, and first occurrence of that same critical threshold, usually in the fall.
Observation Times - In general, the stations included in this product manually record weather variables, with observation times generally, but not always, between 6:00 and 8:00 am local time, capturing data from the preceding 24 hours instead of adhering to a midnight-to-midnight cycle. For example, a station recording observations at 7:00 am on 13 May would reflect data collected from 7:00 am on 12 May to 7:00 am on 13 May.
Completeness of Extreme-Value Periods - Period averages and precipitation and snowfall totals are only considered for record-setting purposes when sufficient daily observations are available. For temperature and precipitation, monthly periods may contain no more than 3 missing days, seasons no more than 9 missing days, and complete calendar years no more than 37 missing days. Snowfall monthly totals use the same 3-day monthly completeness criterion, while snow-year totals use a 37-day completeness criterion. Moreover, multi-day precipitation and snowfall totals are not considered for daily-level extremes and are included in period precipitation/snowfall totals only if they cover days that are in one period in question. For example, a multi-day precipitation total that covers a period spanning from 30 May to 5 June could not be considered in the period total for May or June or for the spring or summer season.
Current Data - Daily extreme records use data available through the most recent completed observation day. Monthly temperature, precipitation, and snowfall totals are evaluated only through the most recently completed calendar month. Consequently, a current partial month will not be included in the monthly or seasonal/annual totals until the appropriate period has been completed.
Getting Started:
Data Types - The interface allows users to choose specific data types, with each generating a corresponding output table. Key categories include temperature, precipitation, snow, and growing season (degree-day normals, dates of first and last occurrence of temperature at thresholds, and growing-season lengths based on differing temperature thresholds).
State Selection - Users can select from the available states in the dropdown menu, which includes Illinois, Indiana, Iowa, Kentucky, Michigan, Minnesota, Missouri, Ohio, and Wisconsin.
Station Selection - After selecting a data type and state and clicking ‘Get Stations List’, the system generates a table displaying relevant station details*. This table contains essential information, including the Global Historical Climatology Network (GHCN) ID, station name, county, state, and the available period of record for data. Users can access detailed climate summary tables by clicking on the station’s GHCN ID.
*Not all stations may have data for every data type, which is most common with snow.
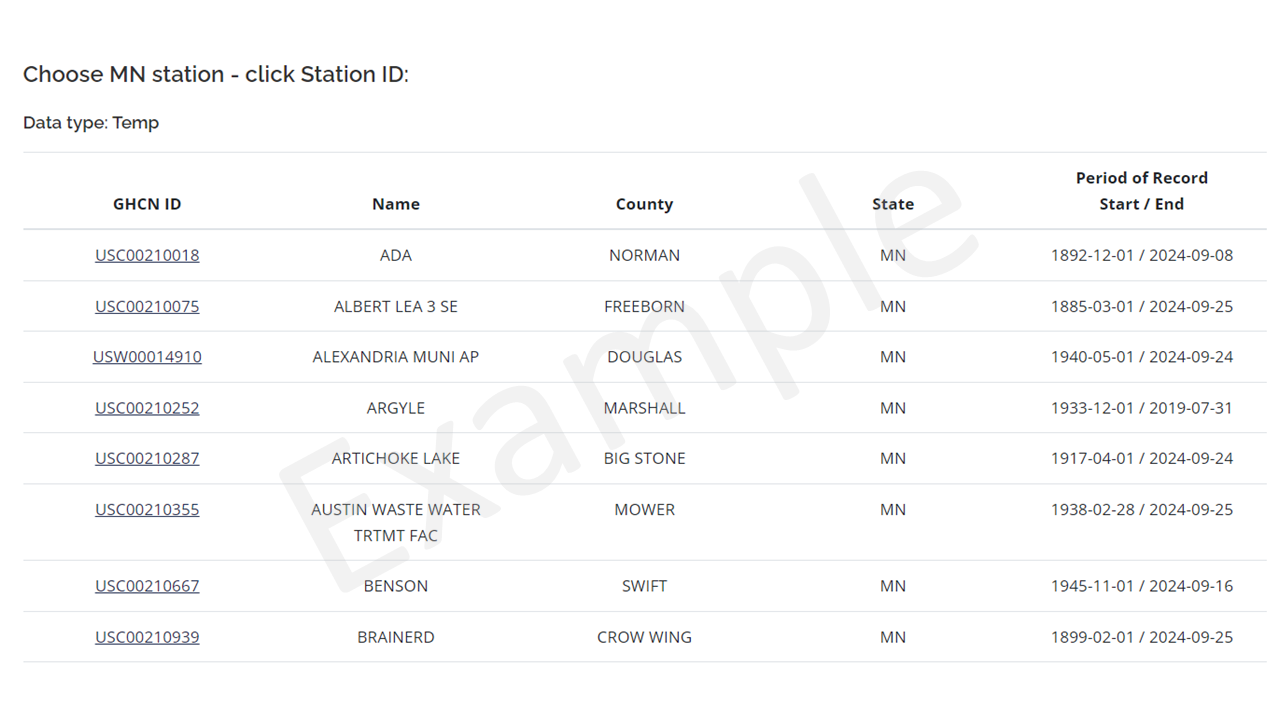
Sample Output from Climate Summary Tables by Data Type:
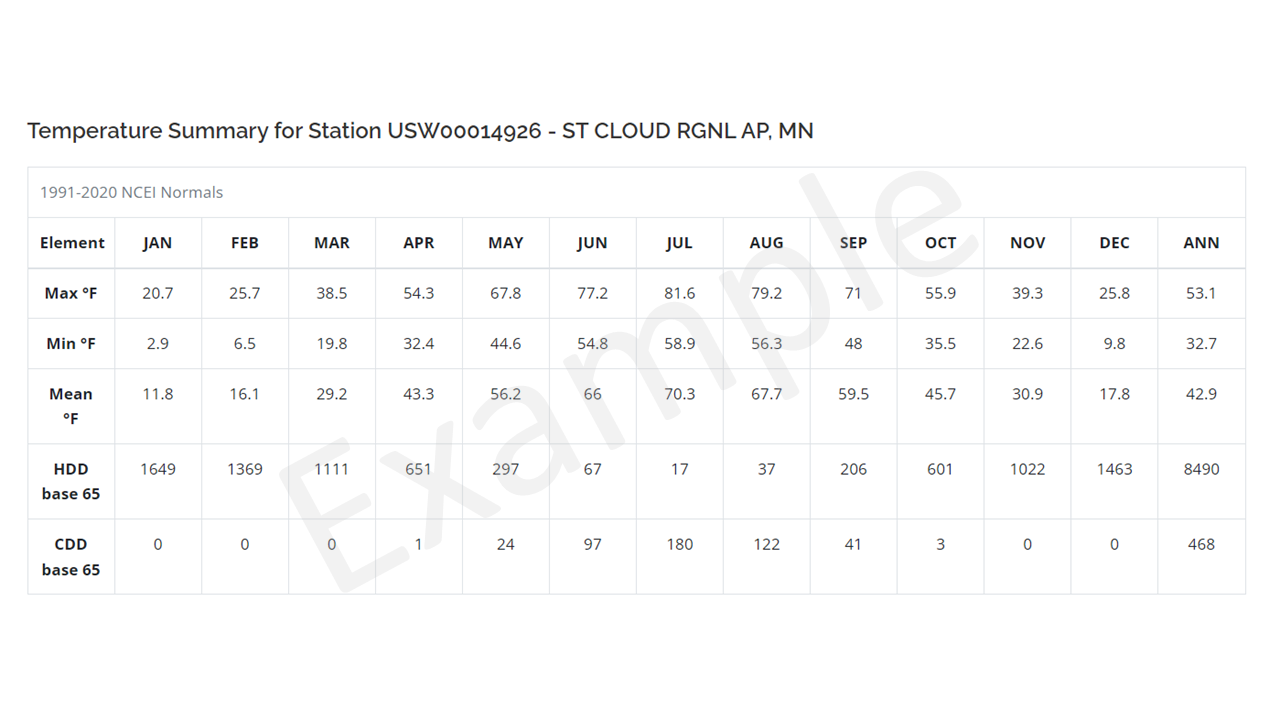
1991-2020 Normals for Temperature, Heating Degree Days, and Cooling Degree Days
The below table shows 1991-2020 normal values for the selected station, specifically maximum, minimum, and mean temperatures, heating degree days* (HDD, base 65°F), and cooling degree days** (CDD, base 65°F) by month and over the calendar year.
*HDD - estimate the energy needed to heat buildings. They are calculated by how many degrees the average daily temperature falls below 65°F—the more HDDs, the greater the heating required.
**CDD - estimate energy demand for cooling buildings. They measure how much the temperature exceeds 65°F—the more CDDs, the more cooling that is needed.
Example Interpretation:
- On average, July is the warmest month of the year, with an average temperature of 70.3°F, while January is the coldest, averaging 11.8°F.
- The highest average maximum temperature occurs in July at 81.6°F, while the lowest average maximum temperature is January with 20.7°F.
- The average annual high temperature is 53.1°F, while the average annual low is 32.7°F, resulting in an overall mean temperature of 42.9°F throughout the year.
- HDDs peak in January, which aligns with it being the coldest month. Conversely, CDDs are highest in July, reflecting that it is the warmest month.
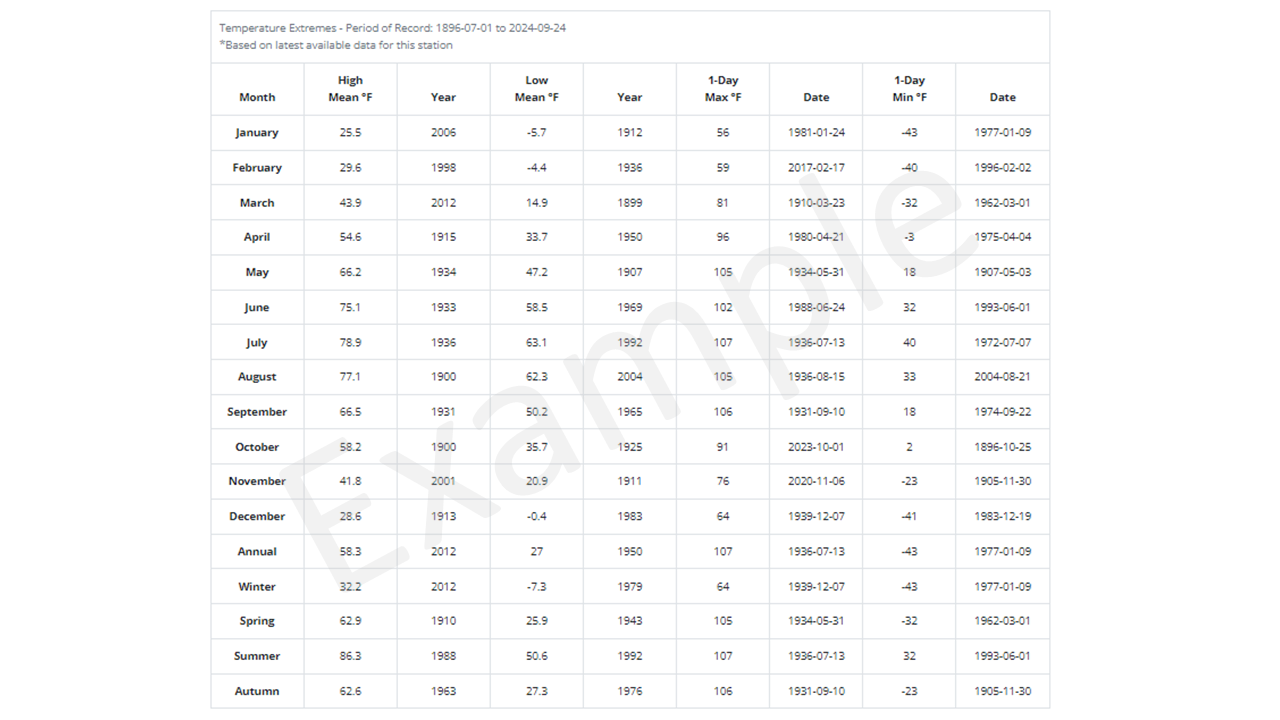
Temperature Extremes - Period of Record: 1896-07-01 to 2024-09-24
The table below shows highest and lowest monthly, seasonal, and annual mean temperatures and the highest and lowest daily temperatures by month, season, and calendar year.
Example Interpretation:
- The available period of record in the example is from 1 July 1896 to 24 September 2024, but for a typical active station, the end of the period of record is near the current date.
- The highest mean temperature for January was 25.5°F, recorded in 2006.
- The lowest mean temperature during summer was 50.6°F, set in 1992.
- The all-time record for the hottest day was set on 13 July 1936, when temperatures soared to 107°F.
- On 9 January 1977, temperatures plummeted to -43°F, marking the coldest minimum temperature ever recorded at this station.
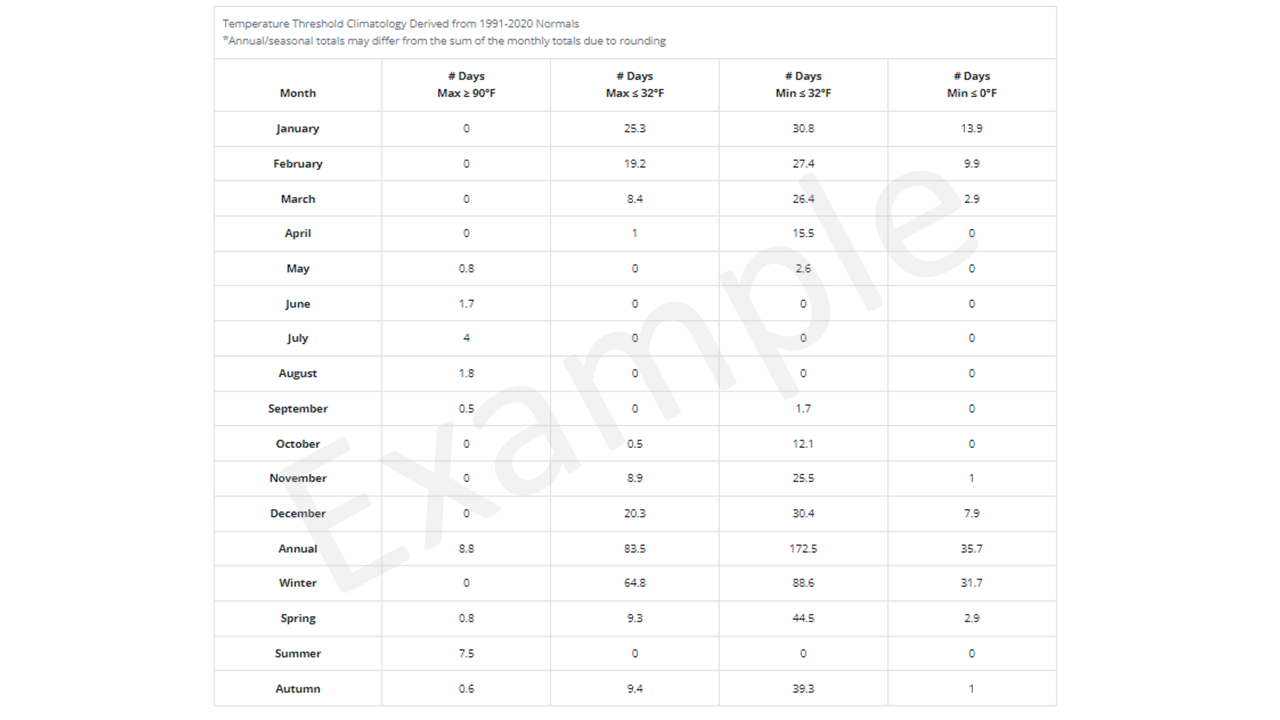
Temperature Threshold Climatology Derived from 1991-2020 Normals
The table below shows the normal numbers of days the maximum temperature is at or above 90°F, the maximum temperature is at or below 32°F, the minimum temperature is at or below 32°F, and the minimum temperature is at or below 0°F by month, season, and calendar year.
Example Interpretation:
- For this station, the average number of days in July with a maximum temperature of 90°F or higher is 4.
- Annually, the station records an average of 8.8 days with maximum temperatures at or above 90°F.
- During winter, the station averages 64.8 days with maximum temperatures at or below 32°F.
- In the autumn months, there are typically 39.3 days where temperatures fall to 32°F or lower.
- January has the highest average number of days, 13.9, with temperatures below 0°F.
1991-2020 Normals for Precipitation
The table below shows 1991-2020 normal totals for the selected station by month and over the calendar year.
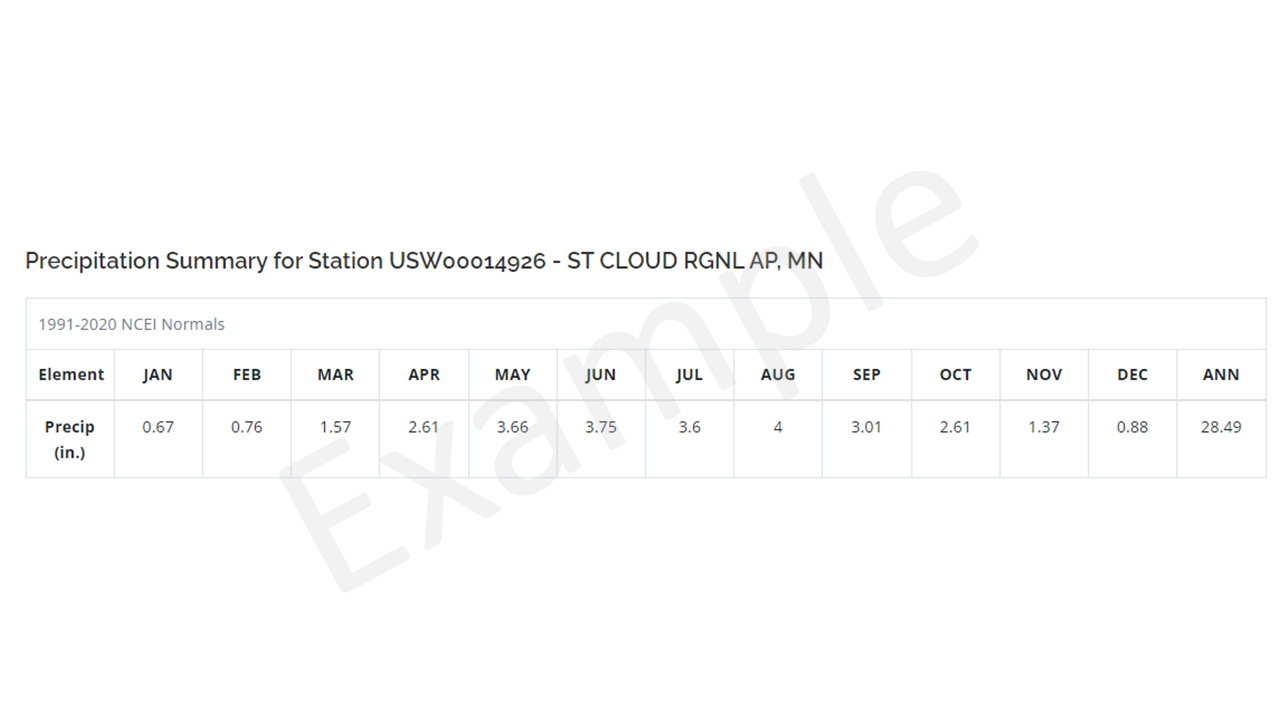
Example Interpretation:
- August is the wettest month, averaging 4 inches of precipitation, while January is the driest, with an average of 0.67 inches.
- The second driest month for this station is February with 0.76 inches.
- Annually, the station receives a total of 28.49 inches of precipitation.
Precipitation Extremes - Period of Record: 1893-03-01 to 2024-09-24
The below table shows highest and lowest monthly, seasonal, and annual precipitation totals and the highest one-day precipitation total by month, season, and calendar year.
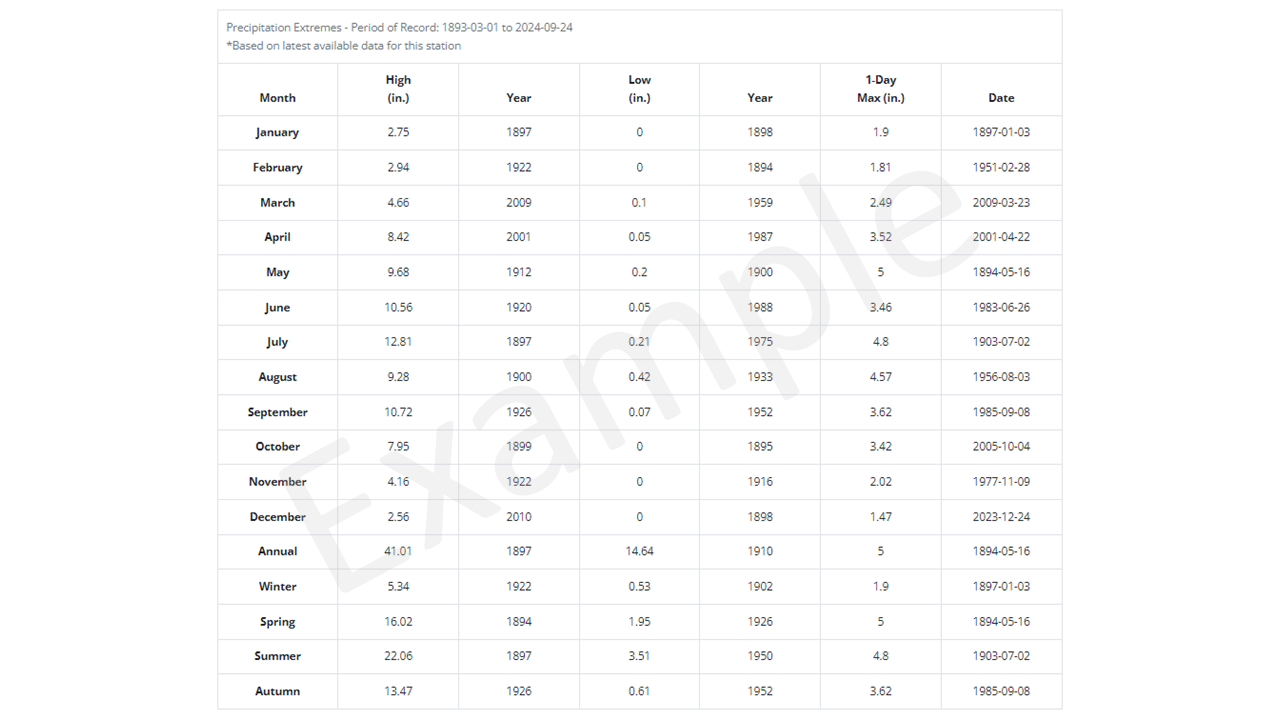
Example Interpretation:
- The available period of record in the example is from 1 March 1893 to 24 September 2024, but for a typical active station, the end date of the period of record is near the current date.
- In July 1897, the station recorded 12.81 inches of precipitation, making it the wettest month ever documented.
- The spring of 1926 set a record for dryness, with only 1.95 inches of precipitation.
- The largest amount of precipitation to fall in a single day occurred on 3 August 1956, when 4.57 inches were recorded.
Precipitation Threshold Climatology Derived from 1991-2020 Normals
The table below shows the normal numbers of days on which precipitation totals 0.01” or more, 0.10” or more, 0.50” or more, and 1.00” or more by month, season, and calendar year.
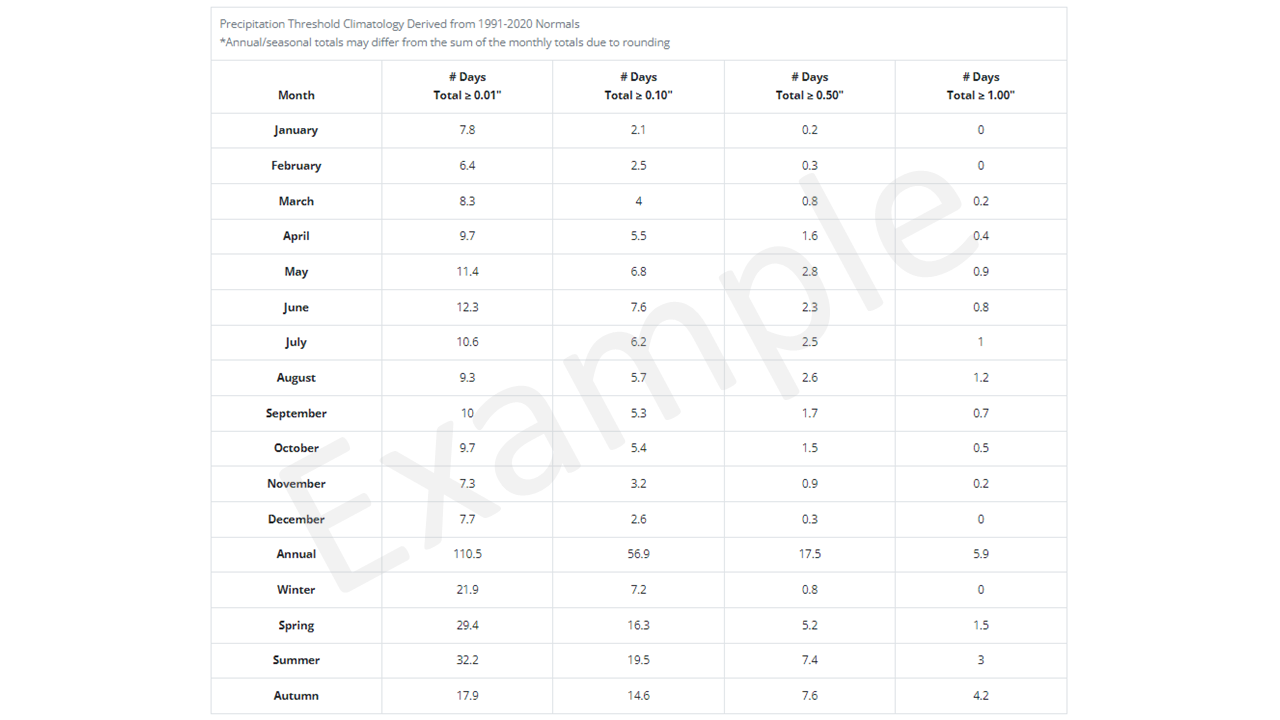
Example Interpretation:
- Annually, the station receives 0.01 inches or more of precipitation on an average of 110.5 days. June has the highest average, with 12.3 days of at least 0.01 inches.
- During the summer months, the station typically experiences about 3 days where precipitation totals reach or exceed 1 inch.
- This table also indicates that smaller precipitation amounts are more common than larger amounts.
1991-2020 Normals for Snowfall
The table below shows 1991-2020 normal totals for the selected station by month and over the calendar year.
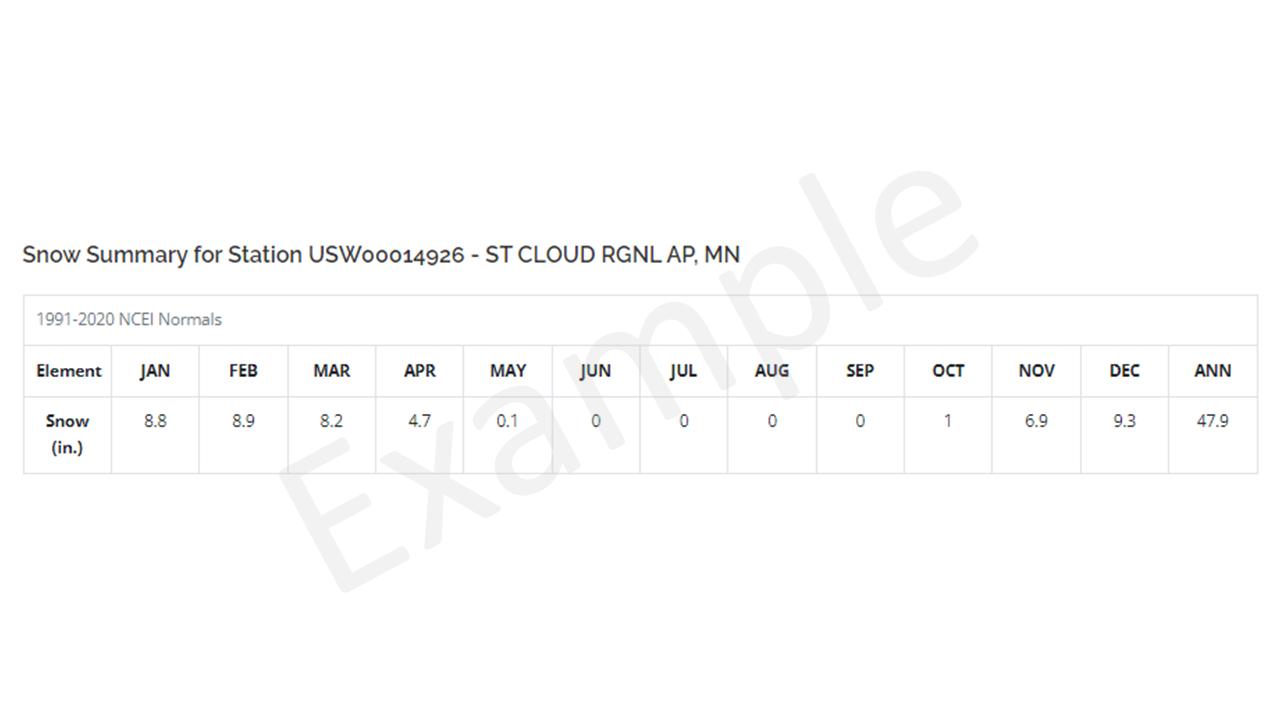
Example Interpretation:
- This station receives an average of 47.9 inches of snow annually, with the majority falling in December at 9.3 inches.
- This station measures on average 4.7 inches of snowfall in April.
- Typically, there is no snow observed between June and September.
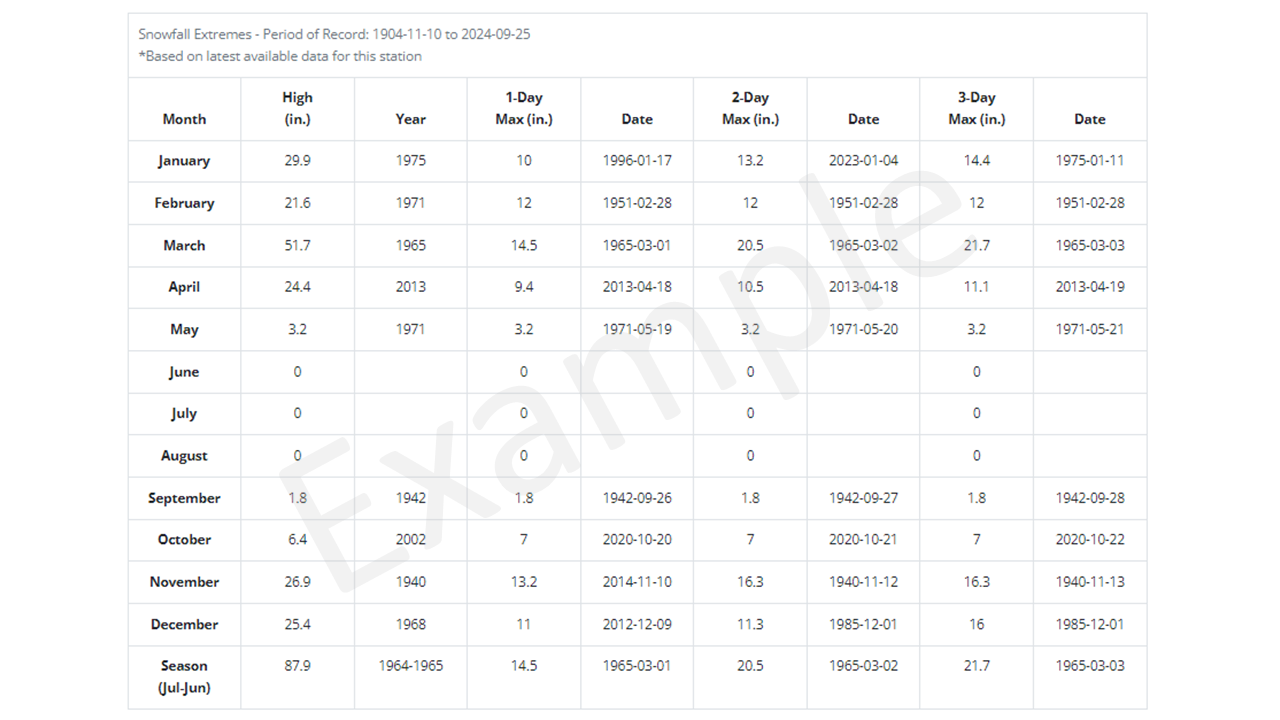
Snowfall Extremes - Period of Record: 1904-11-10 to 2026-08-23
The table below shows highest monthly totals and highest snow season (1 July to 30 June) total as well as the highest one-, two-, and three-day snow totals by month, season, and calendar year.
Example Interpretation:
- The available period of record in the example is from 10 November 1904 to 23 August 2026. For a typical active station, the end date of the period of record is near the current date.
- March 1965 was a record-breaking month for snowfall at this station, with an impressive 51.7 inches of snow measured
- The 1964-1965 snow season holds the all-time record, with a total accumulation of 87.9 inches, the most ever observed in a single snow season.
- On 1 March 1965, the station recorded its highest-ever one-day snowfall for March, measuring 14.5 inches.
- The largest 3-day snow event ever recorded in April was on 19 April 2013 with 11.1 inches measured.
- Summer months generally have no snow in the Midwest. Dates corresponding to zero totals are shown in those months but have no real meaning because station observers often enter zero snowfall totals inconsistently, especially in the summer months.
Snowfall Threshold Climatology Derived from 1991-2020 Normals
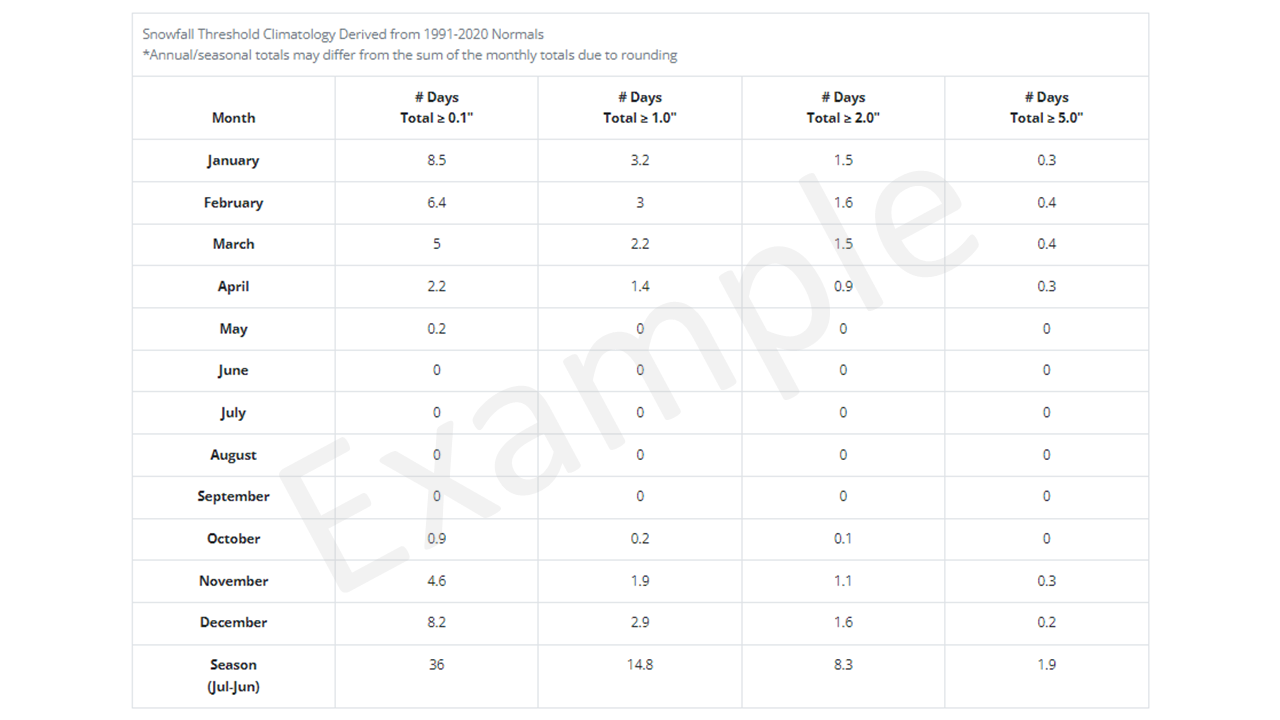
The table below shows the normal numbers of days on which snowfall totals 0.1” or more, 1.0” or more, 2.0” or more, and 5.0” or more by month and snow season (1 July to 30 June).
Example Interpretation:
- Each snow season, this station averages 36 days with snowfall totals of 0.1 inches or more.
- December and January have averages of 8.2 days and 8.5 days, respectively, with snowfall measuring 0.1 inches or more.
- The snow season typically includes nearly 2 days where observed snowfall totals 5.0 inches or greater.
1991-2020 Normals for Growing Season Statistics
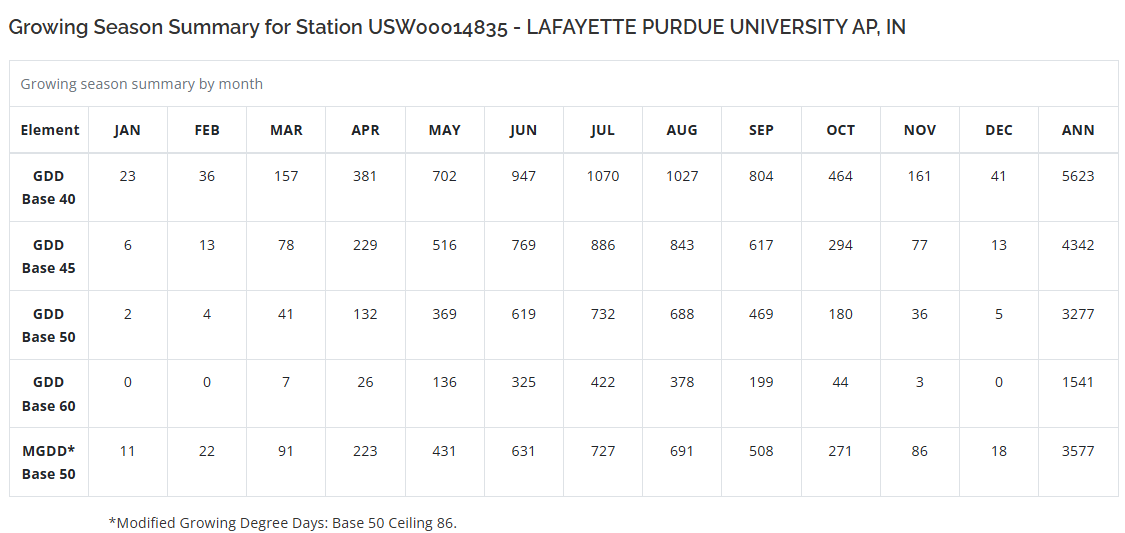
The table below shows 1991-2020 normal values for the selected station, specifically growing-degree days (GDD*) at base temperatures of 40, 45, 50, and 60°F (GDD40, GDD45, GDD50, and GDD60, respectively) and modified growing-degree days (MGDD**) at a lower threshold of 50°F and an upper threshold of 86°F by month and over the calendar year.
*GDD - Estimates the growth and development of plants and insects during a specified time range. The basic concept is that development will occur only if the temperature exceeds some minimum development threshold, or base temperature. To calculate GDD, obtain the daily mean temperature by adding together the daily high and low temperatures and dividing by two. If the daily mean temperature is at or below the base temperature, the GDD value is zero. If the daily mean temperature is above the base temperature, GDD equals the mean temperature minus base temperature. The more GDD accumulation there is, the more plant and insect development there is.
**MGDD - Adapts GDD to track more accurately the development of such crops as corn. The adaptation begins by adjusting the daily high and low temperatures against the specified upper and lower thresholds – here, if the daily high temperature exceeds 86°F, it is capped at 86°F, and if the daily low temperature is below 50°F, it is raised to 50°F. It continues by calculating the daily mean temperature and subtracting the base temperature (50°F) from it.
Example Interpretation:
- Monthly GDD accumulation at any base temperature, as well as monthly MGDD accumulation, is highest in the summer months and lowest in the winter months.
- The normal monthly accumulation of GDD50 ranges from 2 units in January to 732 units in July at this station. The normal annual accumulation is 3277 units.
1991-2020 Dates for First and Last of Critical Temperature Thresholds
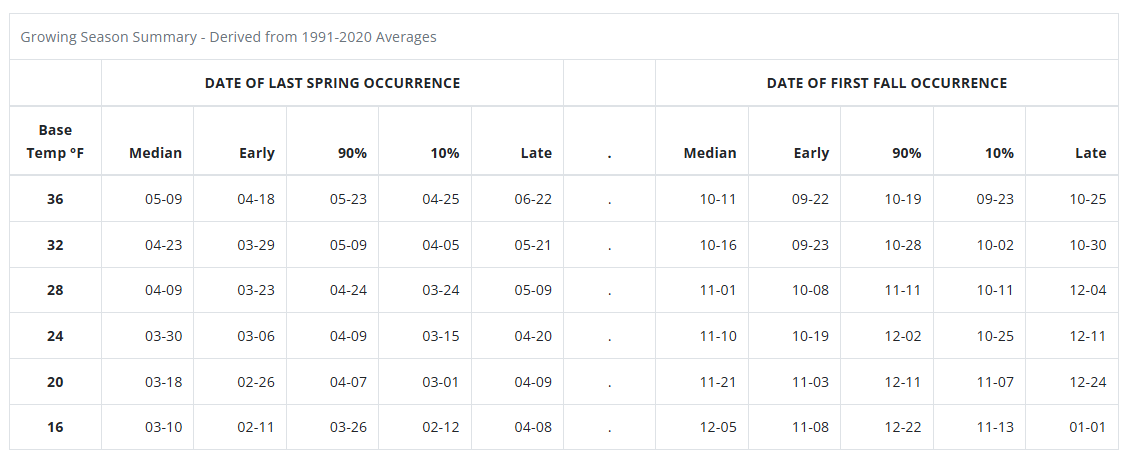
The table below shows 1991-2020 dates for first and last dates of occurrence of critical temperature thresholds relevant to the growing season for a selected station. Specifically, for temperature thresholds of 36, 32, 28, 24, 20, and 16°F, the earliest (early), 10th percentile, median, 90th-percentile, and late (latest) dates of the last occurrence (usually in the spring) of the threshold during the 1991-2020 period for the selected station are shown in the left-hand side of the table. In the right-hand side of the table, those same dates are shown for the same thresholds for the first occurrence (usually in the fall) of the threshold.
Example Interpretation:
- At the threshold of 32°F, the median date of last occurrence in the spring was 23 April during the 1991-2020 period, while it was as early as 29 March and as late as 21 May. In 10 percent of years during the period, the date of last occurrence was earlier than 5 April, while it was later than 9 May in 10 percent of years.
- At the threshold of 32°F, the median date of first occurrence in the fall was 16 October during the 1991-2020 period, while it was as early as 23 September and as late as 30 October. In 10 percent of years during the period, the date of first occurrence was earlier than 2 October, while it was later than 28 October in 10 percent of years.
- Dates of last occurrence tend to be earlier in the year for lower temperature thresholds, and dates of first occurrence tend to be later in the year for lower temperature thresholds.
1991-2020 Lengths of Growing Seasons Based on Critical Temperature Thresholds
The table below shows 1991-2020 dates for first and last dates of occurrence of critical temperature thresholds relevant to the growing season for a selected station. Specifically, for temperature thresholds of 36, 32, 28, 24, 20, and 16°F, the earliest (early), 10th percentile, median, 90th-percentile, and late (latest) dates of the last occurrence (usually in the spring) of the threshold during the 1991-2020 period for the selected station are shown in the left-hand side of the table. In the right-hand side of the table, those same dates are shown for the same thresholds for the first occurrence (usually in the fall) of the threshold.
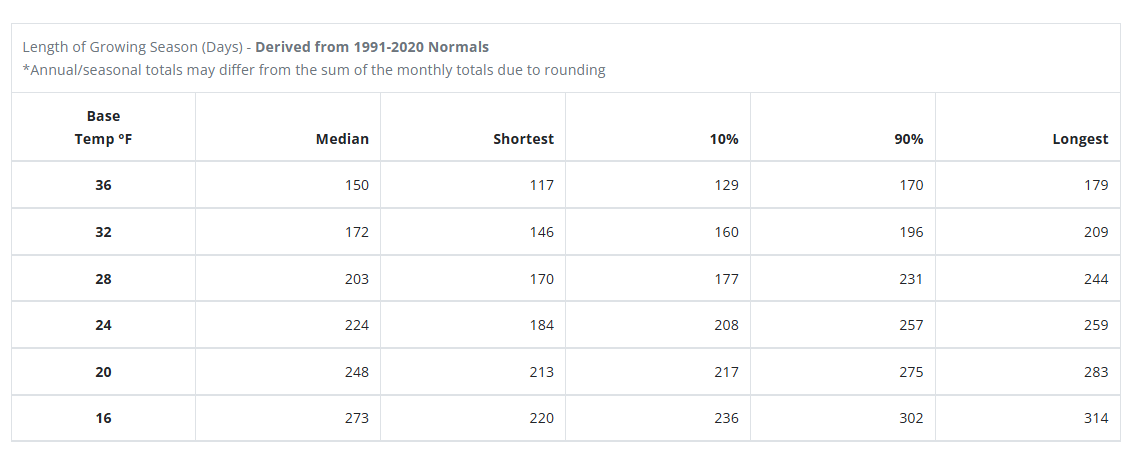
Example Interpretation:
- At the threshold of 32°F, the median growing season length during the 1991-2020 period was 172 days, while it was as long as 209 days and as short as 146 days. Ten percent of the growing seasons were shorter than 160 days at this threshold, while 10 percent of them were longer than 196 days.
- The length of the growing season is longer for lower thresholds of temperature.
Return to Sample Output by Data Type Selection