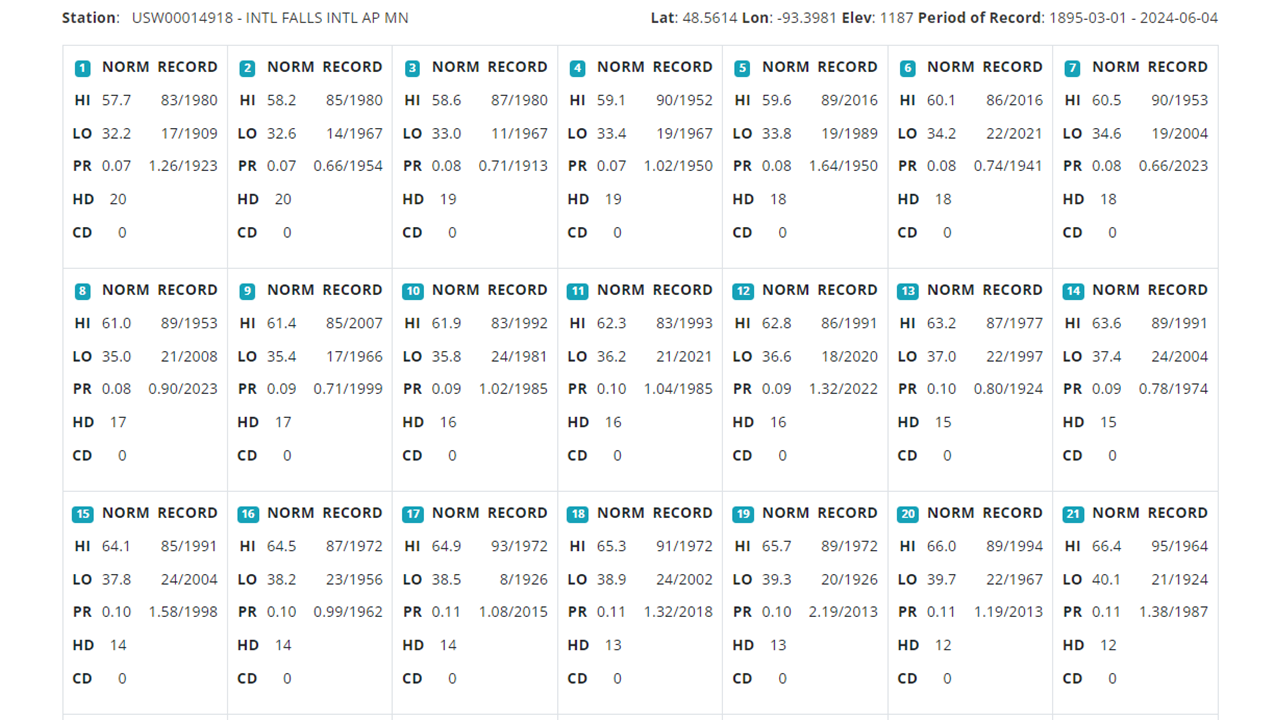
This product displays daily climate data for a location in a calendar format. For each day, the following data are displayed: Normal maximum temperature, normal minimum temperature, normal daily heating and cooling degree days, normal daily precipitation, record maximum temperature, record minimum temperature, and record daily precipitation. The calendar is in a "perpetual format", that is, a specific date is not tied to a day of the week.
In addition to the daily data, monthly statistics for the location are included (normal and extreme temperature, precipitation and snowfall). Some locations may not collect temperature or snowfall data. If that is the case, those fields are blank on the calendar.
Normal values are from the 1991-2020 normals published by the National Centers for Environmental Information (NCEI). Record values at each station are for the period of record which is noted in the upper right of the calendar. Data is not always complete for this period and completeness can vary among elements.
Loading...
Station:
-
,
Lat:
Lon:
Elev:
Selected Month: January
Period of Record:
-
1
NORM
RECORD
HI
LO
PR
HD
CD
2
NORM
RECORD
HI
LO
PR
HD
CD
3
NORM
RECORD
HI
LO
PR
HD
CD
4
NORM
RECORD
HI
LO
PR
HD
CD
5
NORM
RECORD
HI
LO
PR
HD
CD
6
NORM
RECORD
HI
LO
PR
HD
CD
7
NORM
RECORD
HI
LO
PR
HD
CD
8
NORM
RECORD
HI
LO
PR
HD
CD
9
NORM
RECORD
HI
LO
PR
HD
CD
10
NORM
RECORD
HI
LO
PR
HD
CD
11
NORM
RECORD
HI
LO
PR
HD
CD
12
NORM
RECORD
HI
LO
PR
HD
CD
13
NORM
RECORD
HI
LO
PR
HD
CD
14
NORM
RECORD
HI
LO
PR
HD
CD
15
NORM
RECORD
HI
LO
PR
HD
CD
16
NORM
RECORD
HI
LO
PR
HD
CD
17
NORM
RECORD
HI
LO
PR
HD
CD
18
NORM
RECORD
HI
LO
PR
HD
CD
19
NORM
RECORD
HI
LO
PR
HD
CD
20
NORM
RECORD
HI
LO
PR
HD
CD
21
NORM
RECORD
HI
LO
PR
HD
CD
22
NORM
RECORD
HI
LO
PR
HD
CD
23
NORM
RECORD
HI
LO
PR
HD
CD
24
NORM
RECORD
HI
LO
PR
HD
CD
25
NORM
RECORD
HI
LO
PR
HD
CD
26
NORM
RECORD
HI
LO
PR
HD
CD
27
NORM
RECORD
HI
LO
PR
HD
CD
28
NORM
RECORD
HI
LO
PR
HD
CD
29
NORM
RECORD
HI
LO
PR
HD
CD
30
NORM
RECORD
HI
LO
PR
HD
CD
31
NORM
RECORD
HI
LO
PR
HD
CD
915 Mitch Daniels Boulevard • West Lafayette, IN 47907
https://mrcc.purdue.edu • 765-494-6574
a cooperative program of Purdue University
and the National Centers for Environmental Information
Normal values are from the 1991-2020 NCEI normals. Record values are for the period of record. Data is not always complete for the period of record.
HD (Heating Degree Days) base 65° F CD (Cooling Degree Days) base 65° F PR (Precipitation) in inches
T = Trace (precipitation records) * = Record Tied for date; showing most recent
If area is blank, that type of data is not
collected at that station.
Climate Statistics for the Month: (normals are for 1991-2020)
CAUTION: Climate records displayed in the 'Climate Statistics for the Month' table may inaccurately show the current month as a newly established record. Data for non-current months remain accurate. We appreciate your patience as we actively work on fixing this error.