About Bi-National Precipitation
Regional Deterministic Precipitation Analysis: Canadian Precipitation Analysis
The Regional Deterministic Precipitation Analysis (RDPA) configuration of the Canadian Precipitation Analysis (CaPA) is a real-time gridded precipitation product provided by Environment and Climate Change Canada (ECCC). The grid has a resolution of approximately 2.5 km and the domain covers all of North America (Canada, USA and Mexico). It uses gauge data, radar reflectivity and GOES imagery to modify a trial field provided by the GEM numerical weather prediction model using a statistical interpolation technique. The product has been operational since April 6, 2011, but a hindcast that goes back to 2002 is available from ECCC. The data exists at 15km resolution from 2002 through October 2, 2012 where a 10km resolution was introduced. The current resolution of 2.5km was introduced on February 21, 2024. The product is constantly being improved, with updates occurring once or twice per year. The method as well as all updates are documented here: http://collaboration.cmc.ec.gc.ca/cmc/cmoi/product_guide/submenus/capa_e.html
Operational products can be found here:
Static imagery: http://weather.gc.ca/analysis/
GRIB2 binary files: http://dd.weather.gc.ca/analysis/precip/
Web Map Service (WMS): https://geo.weather.gc.ca/geomet/?lang=en&service=WMS&version=1.3.0&request=GetCapabilities

Multi-sensor Precipitation Estimator
Hydro-meteorologists at the National Weather Service's (NWS's) 13 River Forecast Centers (RFCs) utilize the Multi-sensor Precipitation Estimator (MPE) to produce rainfall estimates that cover the 48 contiguous United States as well as portions of Canada and Mexico. MPE uses radar precipitation estimates from NWS radars, as well as some Dept of Defense radars. It also uses hourly rain gage data and satellite precipitation estimates. Other previously processed rainfall estimates can also be utilized, such as the National Severe Storms Labs (NSSL) Multi-Radar/Multi-Sensor (MRMS) data. These inputs are then manually analyzed at the RFCs to produce the day's best precipitation estimate on a 4 km grid on a 1 hour time step. Hourly estimates began to be produced in the mid-1990s, resulting in a 20+ year data set.
The precipitation graphics can be viewed at the following web site: water.weather.gov/precip/.


Merged CaPA-MPE
The “Merged” dataset is created using both the Canadian Precipitation Analysis (CaPA) and the Multi-sensor Precipitation Estimate (MPE) datasets. Outside of the contiguous 48 United States, the CaPA data is copied as it is. Within the contiguous 48 states, the MPE data is resampled from its original 4-km cellsize to a 2.5-km cellsize, and then copied.
A 10-km buffer polygon was created on either side of the boundary of the contiguous 48 United States. The polygon was extended to completely cover the Great Lakes as well. From both input datasets, point features intersecting this polygon are selected and appended into a single point feature class. An inverse distance weighted interpolation with a power setting of 0.5 and 10-point variable search radius is used to create a new raster dataset with a 2.5-kilometer cellsize. Finally, the interpolated raster data is mosaicked with the appropriate parts of the CaPA and resampled MPE data.
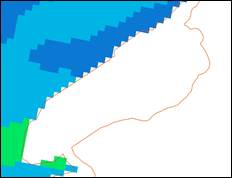
CaPA derived raster - 2.5km cell size.
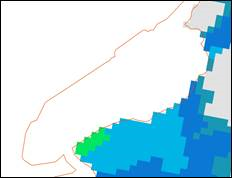
MPE derived raster - resampled from 4km to 2.5km cell size.
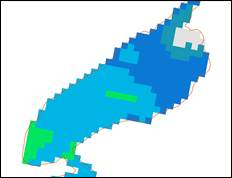
Raster created from interpolation of CaPA and MPE points - 2.5km cell size.
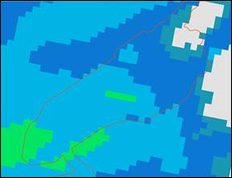
Final merge raster (mosaic of CaPA, MPE and interpolation rasters) - 2.5km cell size.
Departures
Departures are calculated from 15-year averages (2004-2018). For each dataset (CaPA, MPE, and Merged), daily averages for each calendar day were created. For example, to calculate the average grid for January 1st, the 15 grids for January 1st from 2004 through 2018 are used. Additionally, a moving window average was applied in order to decrease day-to-day variability of the means. A 45-day period moving average was chosen because it smoothed the most variable peaks while also maintaining the month to month and seasonal variability. Once the 15-year, smoothed averages were complete, daily anomalies could then be calculated by subtracting the corresponding daily mean from each day’s precipitation accumulation at each grid point.
Data File Download
Data files for CaPA, MPE, and the merged dataset for both the entire Canada and United States region (23°N, -175°W, 75°N, -50°W) as well as for a subset of the Great Lakes basin (51°N, -93°W, 40°N, -70°W) are available directly on our server for the past 30 days. For data before the last 30 days, please see our archived data retrieval page.
The data files are simple CSV files with three columns (lat, lon, prcp_mm). The naming structure is below:
- Canada & US files
- CaPA: capa_YYYYMMDD.csv
- MPE: mpe_YYYYMMDD.csv
- Merged: mrg_YYYYMMDD.csv
- Great Lakes files
- CaPA: capaGL_YYYYMMDD.csv
- MPE: mpeGL_YYYYMMDD.csv
- Merged: mrgGL_YYYYMMDD.csv
The url for the Canada & US files is: http://mrcc.purdue.edu/cliwatch/northAmerPcpn/northAmer/mrg_YYYYMMDD.csv
The url for the Great Lakes files is: http://mrcc.purdue.edu/cliwatch/northAmerPcpn/greatLakes/mrgGL_YYYYMMDD.csv