El Niño Southern Oscillation

WHAT IS EL NIÑO?
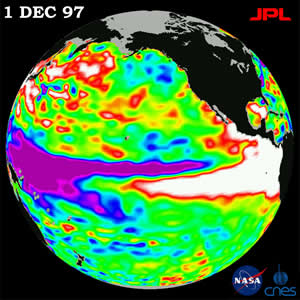
Satellite image of sea surface temperature anomalies during the historic El Niño of 1997-1998. Image: NASA Jet Propulsion Laboratory.
El Niño is the warm phase of a phenomena known as the El Niño Southern Oscillation (ENSO), a periodical change in atmospheric conditions caused by variations in sea surface temperatures over the tropical Pacific Ocean. The cold phase is known as La Niña, while the absence of El Niño or La Niña conditions is called the Neutral phase. During an El Niño, the ocean surface in the equatorial eastern Pacific Ocean typically warms by a few degrees Celsius above the long term normal. This occurs because of a change in the winds over the equatorial Pacific. Changes occur on the time frame of several months to a year.
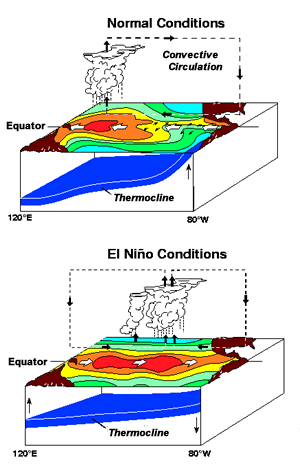
The convective circulation during normal and El Niño conditions in the equatorial Pacific Ocean. Image credit: NOAA Pacific Marine Environmental Laboratory.
In a normal setting, trade winds along the equator blow strongly from east to west. This pushes surface water from the eastern equatorial Pacific towards the west, where it “piles up”. In the eastern Pacific, colder water rises from the deep ocean to the surface to replace the water the winds displaced. This results in a sea surface temperature difference of about 8°C from west to east. When the trade winds become weaker, less surface water is transported to the west, keeping cooler water deep below the surface in the east. This allows the eastern equatorial Pacific to warm, leading to an El Niño.
The warm region during an El Niño generally extends from the central Pacific Ocean to the coasts of Ecuador and Peru. This results in a shift in the convective rainfall pattern in the Pacific, as showers and thunderstorms tend to develop over warmer waters where air can more easily rise. This produces changes in the overall atmospheric circulation over the equatorial Pacific with rising air in the central Pacific spreading out to the east and the west. Descending air in the western Pacific results in high pressure and dry weather in Australia.
Numerical Definitions of El Niño
There are a number of ways to define and monitor the El Niño Southern Oscillation using numerical indices derived from weather and climate data. The Southern Oscillation Index (SOI) is based on pressure differences between Tahiti and Darwin, Australia. The SOI is a mathematical way of smoothing the daily fluctuations in air pressure between Tahiti and Darwin and standardizing the information. During El Niño conditions, the average air pressure is higher in Darwin than in Tahiti. The lower the SOI, the stronger the El Niño, and conversely the higher the SOI, the stronger the La Niña. The cyclic nature of the Southern Oscillation can be seen in the chart below.
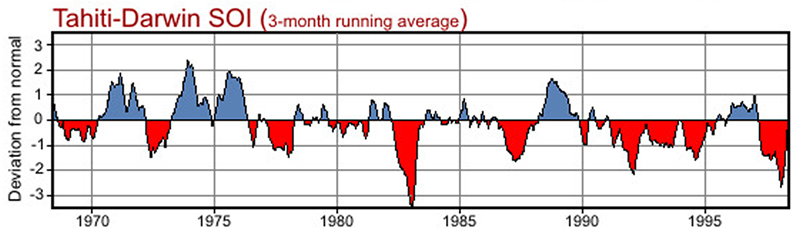
Chart of the Southern Oscillation Index (SOI). Red indicates El Niño conditions while blue indicates La Niña conditions.
Image credit: NOAA
The four Niño regions. Image credit: NOAA.
Another index, called the Oceanic Niño Index (ONI), uses sea surface temperatures to monitor ENSO conditions. Sea surface temperatures are monitored in four “Niño” regions extending from the west coast of South America across the equatorial Pacific. These regions were created in the 1980s, but since then have been modified. Regions 1 and 2 were combined to form the Niño 1+2 region. An overlap of regions 3 and 4 was found to have a good correlation with the SOI, and this region is called Niño 3.4.
While the Niño 1+2, 3, and 4 regions are used to track sea surface temperatures in the tropical Pacific Ocean, the ONI uses sea surface temperature anomalies in the Niño 3.4 region. When sea surface temperature anomalies exceed +0.5°C for at least five consecutive 3-month mean periods, an El Niño is present. A La Niña is similarly defined, only with anomalies of -0.5°C or lower. Current and historical ONI values can be viewed on the National Weather Service’s Climate Prediction Center website.
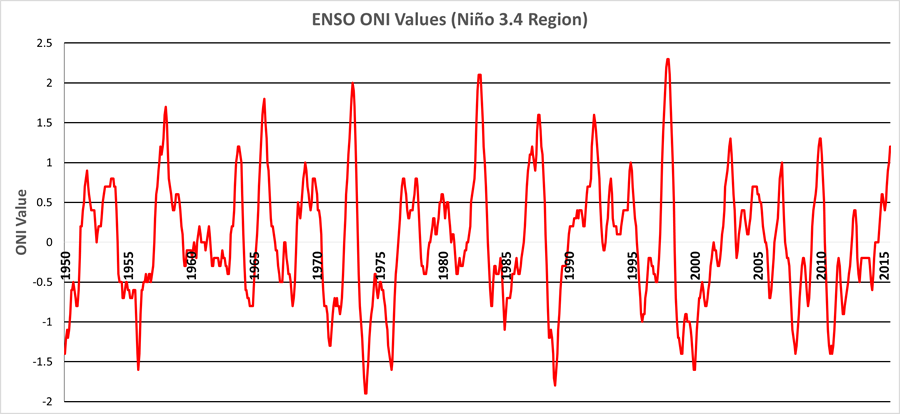
Oceanic Niño Index values since 1950. Positive values represent El Niño conditions, while negative values represent La Niña conditions.
External Info:
- More on Equatorial Sea Surface Temperatures - NCEI/NOAA
[https://www.ncdc.noaa.gov/teleconnections/enso/indicators/sst.php] - So What is an El Niño, Anyway? (A Non-Technical Discussion) – Scripps Institution of Oceanography
[http://meteora.ucsd.edu/~pierce/elnino/whatis.html] - El Niño Theme Page - NOAA
[http://www.pmel.noaa.gov/tao/elnino/nino-home.html] - Glossary of ENSO Terms – NOAA Earth System Research Laboratory
[http://www.esrl.noaa.gov/psd/enso/enso.glossary.html] - El Niño Southern Oscillation (ENSO) – NWS JetStream – Online School for Weather
[http://oceanservice.noaa.gov/education/yos/resource/JetStream/tropics/enso_patterns.htm]