ENSO Indices and Past Events
Oceanic Niño Index
Many different indices have been created to track ENSO, but one of the most commonly used index is the Oceanic Niño Index (ONI). This index is tracked and released monthly on the Climate Prediction Center's website. The ONI uses a three month mean of sea surface temperature anomalies in the Niño 3.4 Region. Events happen when ONI values meet the thresholds for a minimum of five overlapping seasons (monthly 3-month averages):
- ENSO Neutral: ONI greater than -0.5 AND less than 0.5
- El Niño: ONI greater than or equal to 0.5
- La Niña: ONI less than or equal to -0.5
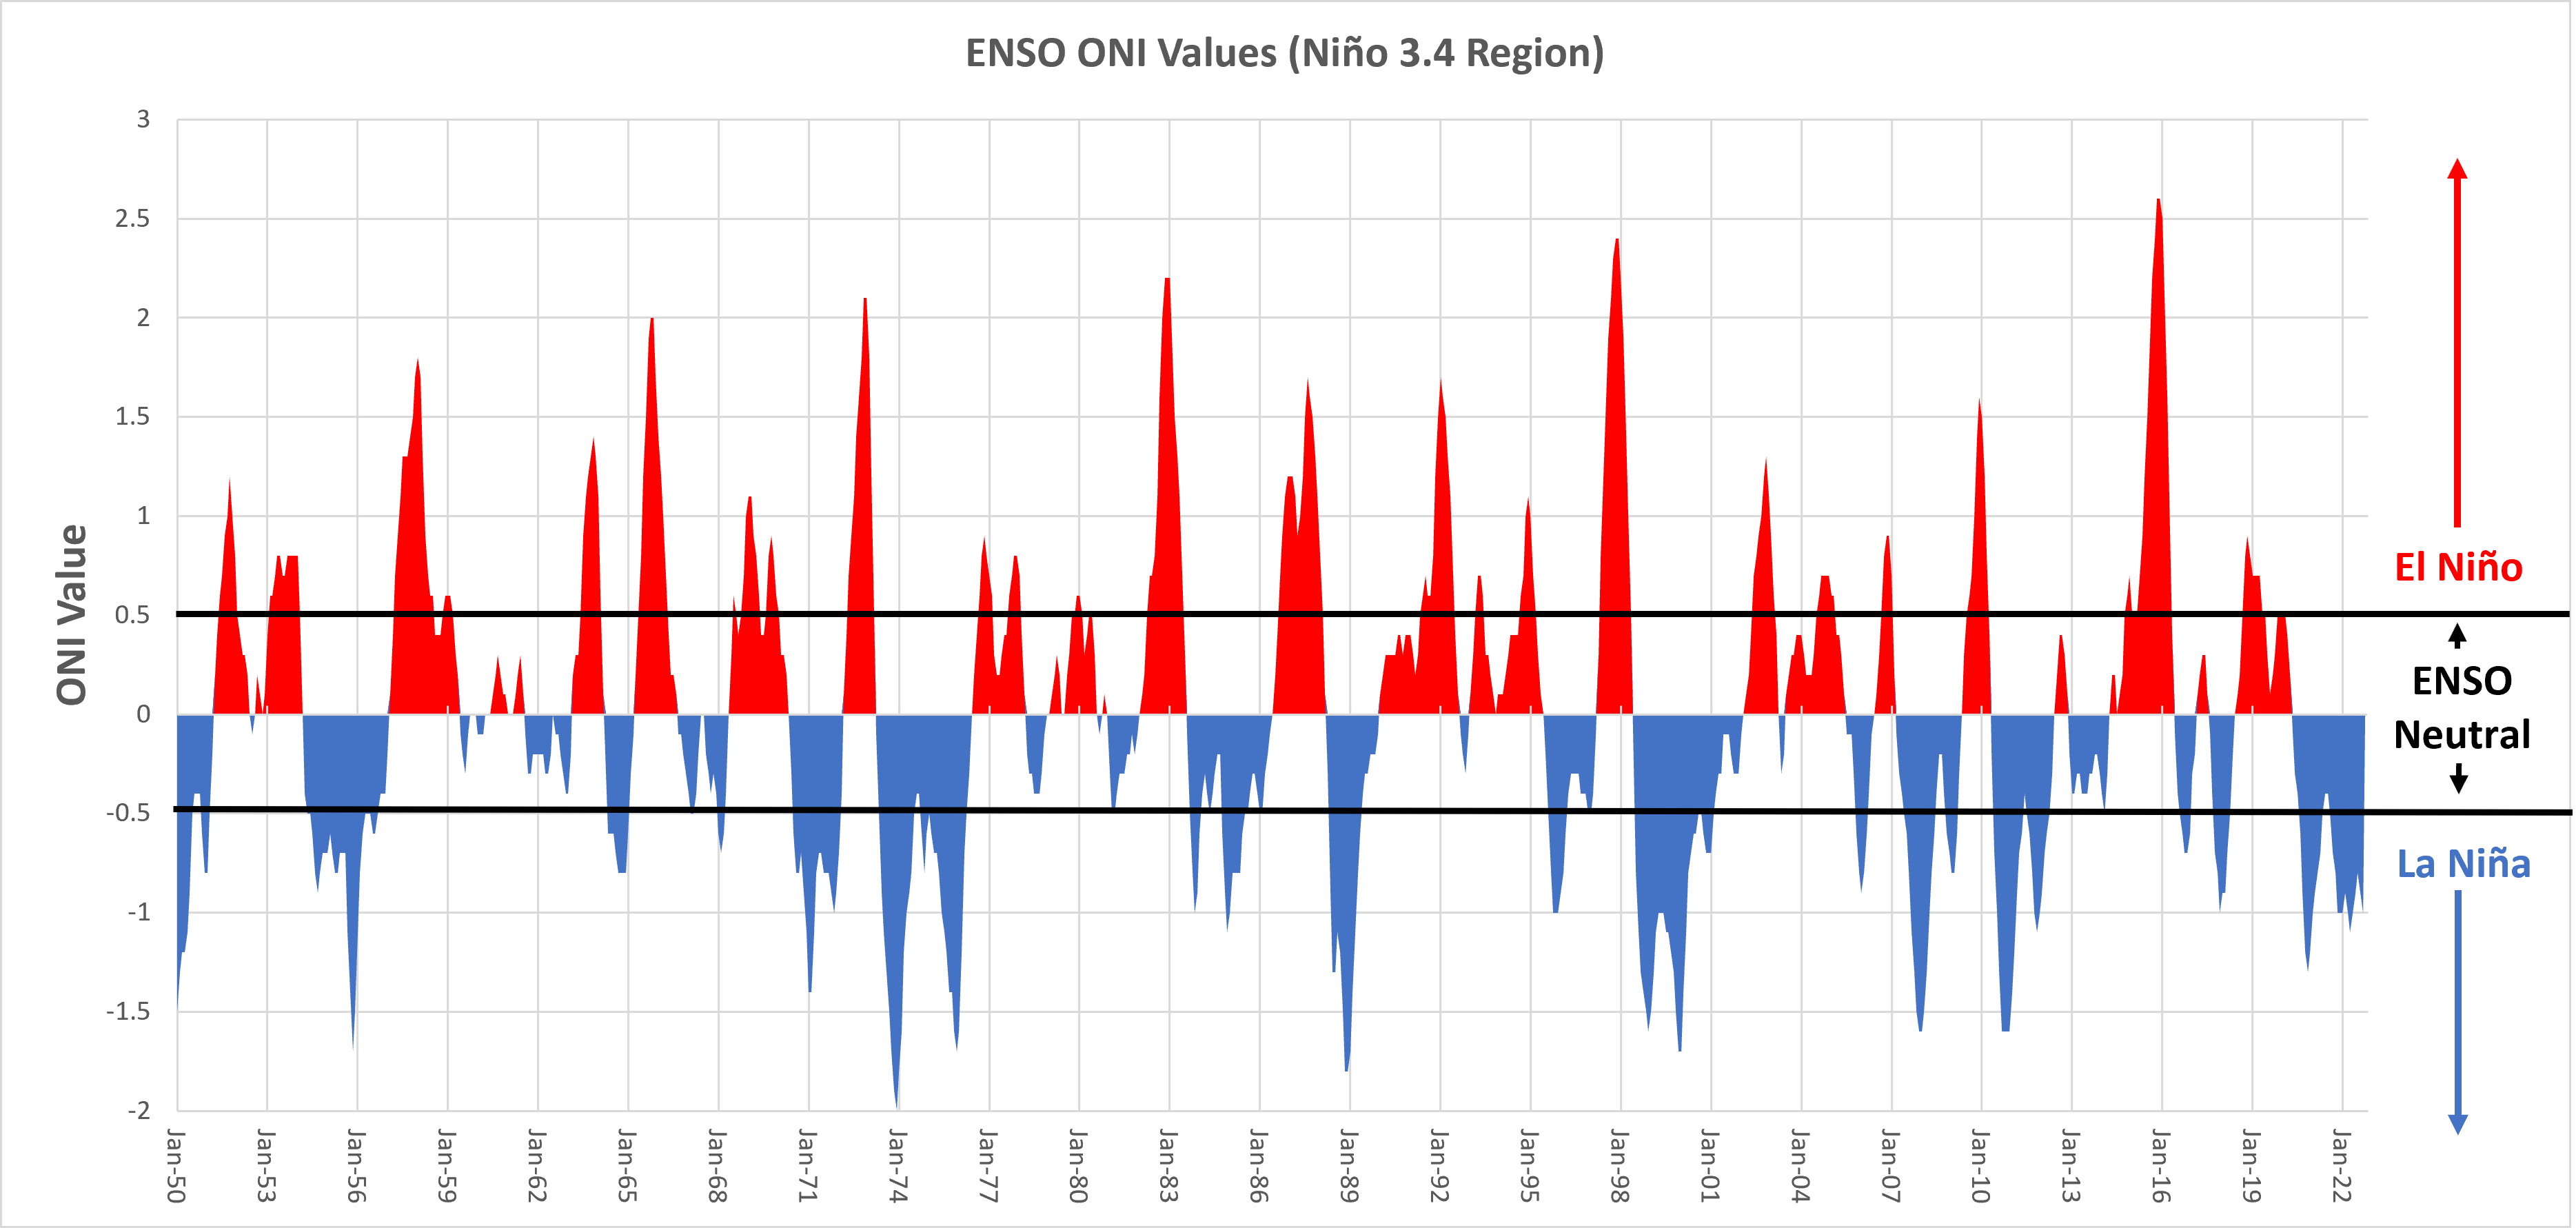
Oceanic Niño Index since 1950.
ENSO events vary not only in duration, but also strength. El Niño events are considered weak when ONI values are between 0.5-0.9, moderate from 1.0-1.4, and strong for greater than 1.5. The strongest El Niño ONI values on record since 1950 occurred in Nov-Dec 2015 (2.6), Nov-Dec 1997 (2.3), and Nov-Dec 1982 (2.2).
La Niña events are considered weak when ONI values are between -0.5 to -0.9, moderate from -1.0 to -1.4, and strong for less than -1.5. The strongest La Niña ONI values occurred in Nov-Dec 1973 (-2), January 1974 (-1.9), and Nov-Dec 1988 (-1.8).
Extended Multivariate ENSO Index
Another index that is used by the NOAA Physical Sciences Laboratory is the Extended Multivariate ENSO Index (MEI). This index was created to create a more reliable ENSO index to incorporate additional measured variables (sea-level pressure, sea surface temperature, surface winds, and outgoing longwave radiation) and was used for research purposes. Rather than three month averages, like the ONI, this index uses bi-monthly seasons (Dec-Jan, Jan-Feb, etc.). This index is released on the NOAA Physical Sciences Laboratory website.
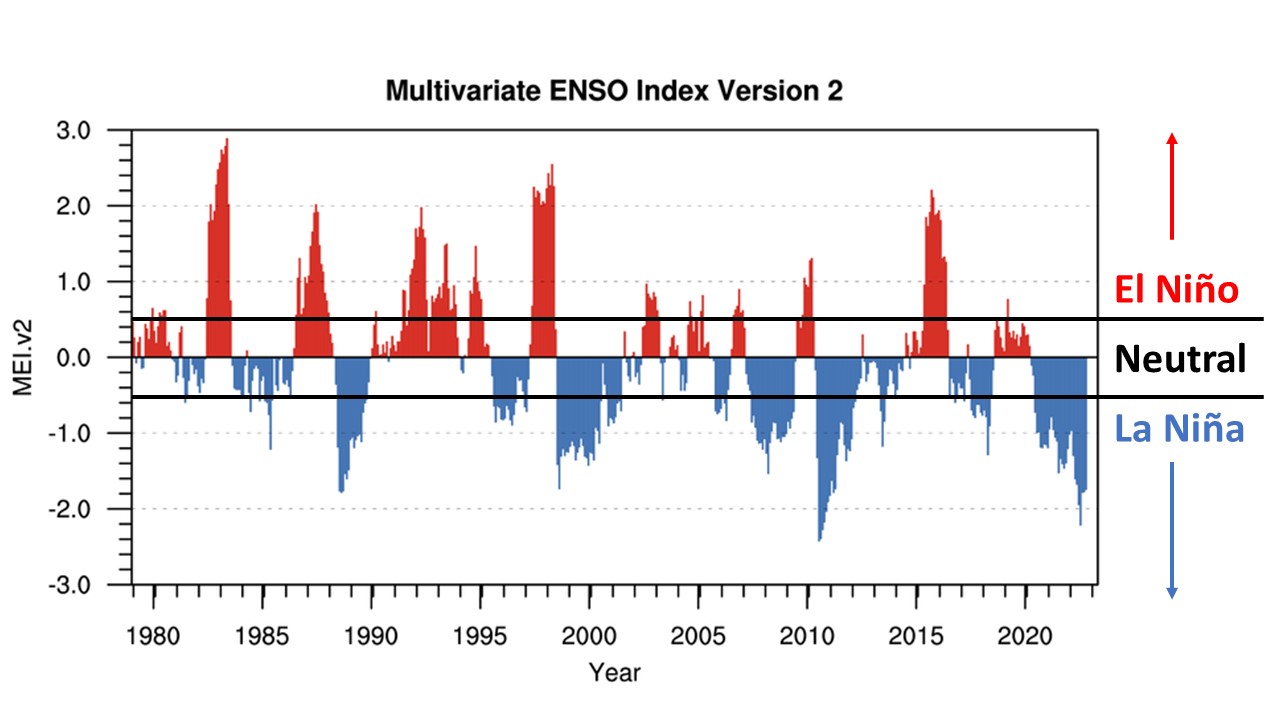
MEI since 1979. Source
Similar to the ONI, MEI ENSO events are classified by the following thresholds being met:
- ENSO Neutral: MEI greater than -0.5 AND less than 0.5
- El Niño: MEI greater than or equal to 0.5
- La Niña: MEI less than or equal to -0.5
The strongest MEI values since 1979 (not same event) recorded for El Niño events were Mar-Apr 1983 (2.9) and Mar-Apr 1998 (2.5). For La Niña events, largest MEI values were Jun-Jul and Jul-Aug 2010 (-2.4) and Jun-Jul 2022 (-2.2).
Other ENSO Indices
There are other ENSO Indices, such as the Southern Oscillation Index, which is monitored at the Climate Prediction Center.
Past ENSO Events
Based on the MEI, there have been 15 El Niño, 19 neutral, and 16 La Niña events since 1950 (table below). Ranks of the ENSO events can be seen at the NOAA Physical Sciences Laboratory website
.| El Niño | Neutral | La Niña |
|---|---|---|
| 1958 | 1952-1954 | 1950 |
| 1966 | 1957 | 1951 |
| 1973 | 1959-1961 | 1955 |
| 1978 | 1963-1965 | 1956 |
| 1980 | 1967-1970 | 1962 |
| 1983 | 1972 | 1971 |
| 1987 | 1975 | 1974 |
| 1988 | 1977 | 1976 |
| 1992 | 1979 | 1989 |
| 1995 | 1981-1982 | 1999 |
| 1998 | 1984-1986 | 2000 |
| 2003 | 1990-1991 | 2008 |
| 2007 | 1993-1994 | 2011 |
| 2010 | 1996-1997 | 2012 |
| 2016 | 2001-2002 | 2021 |
| 2004-2006 | 2022 | |
| 2009 | ||
| 2013-2015 | ||
| 2017-2020 |