July 2026
July 2026 Overview – Midwestern Regional Climate Center
Temperature
The average July temperature for the Midwest was 75.3°F, which was 2.6°F above the 1991–2020 normal (Figure 1). Final rankings indicated that the Midwest had its 14th warmest July on record, dating back to 1895. Temperatures were above normal region-wide, with increasing anomalies from south to north (Figure 2).
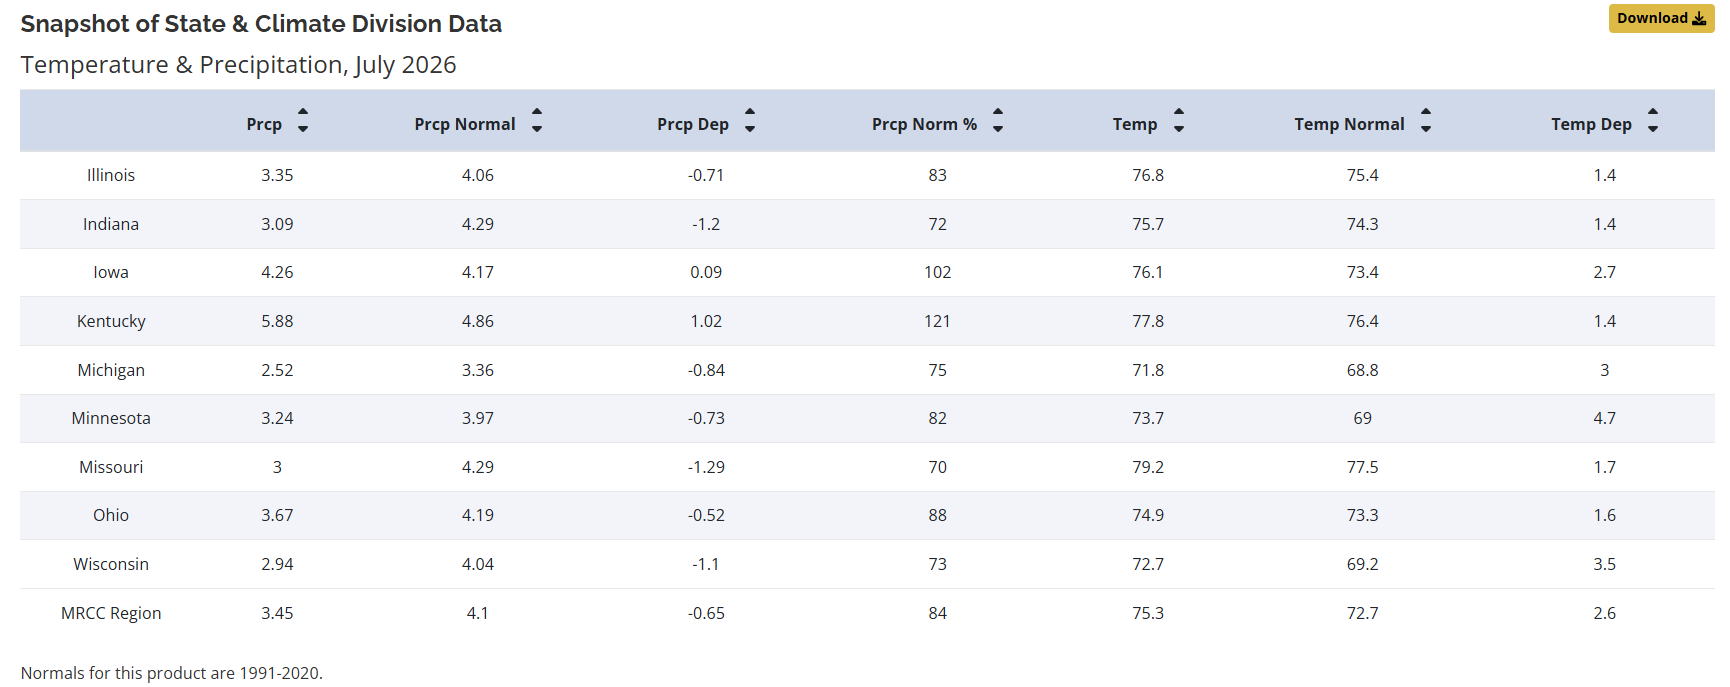
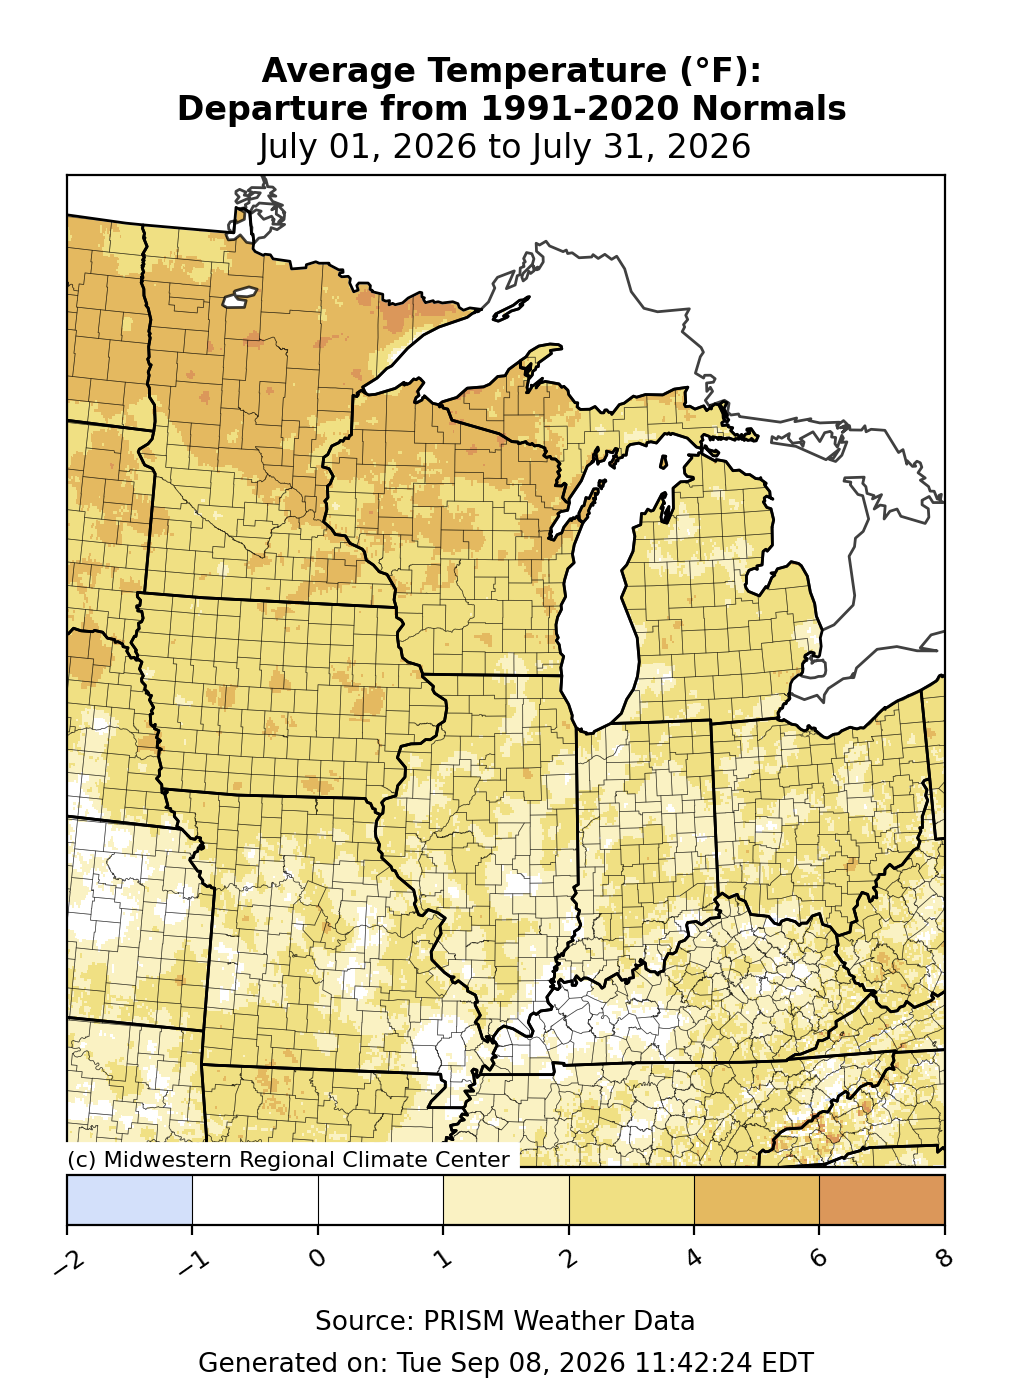
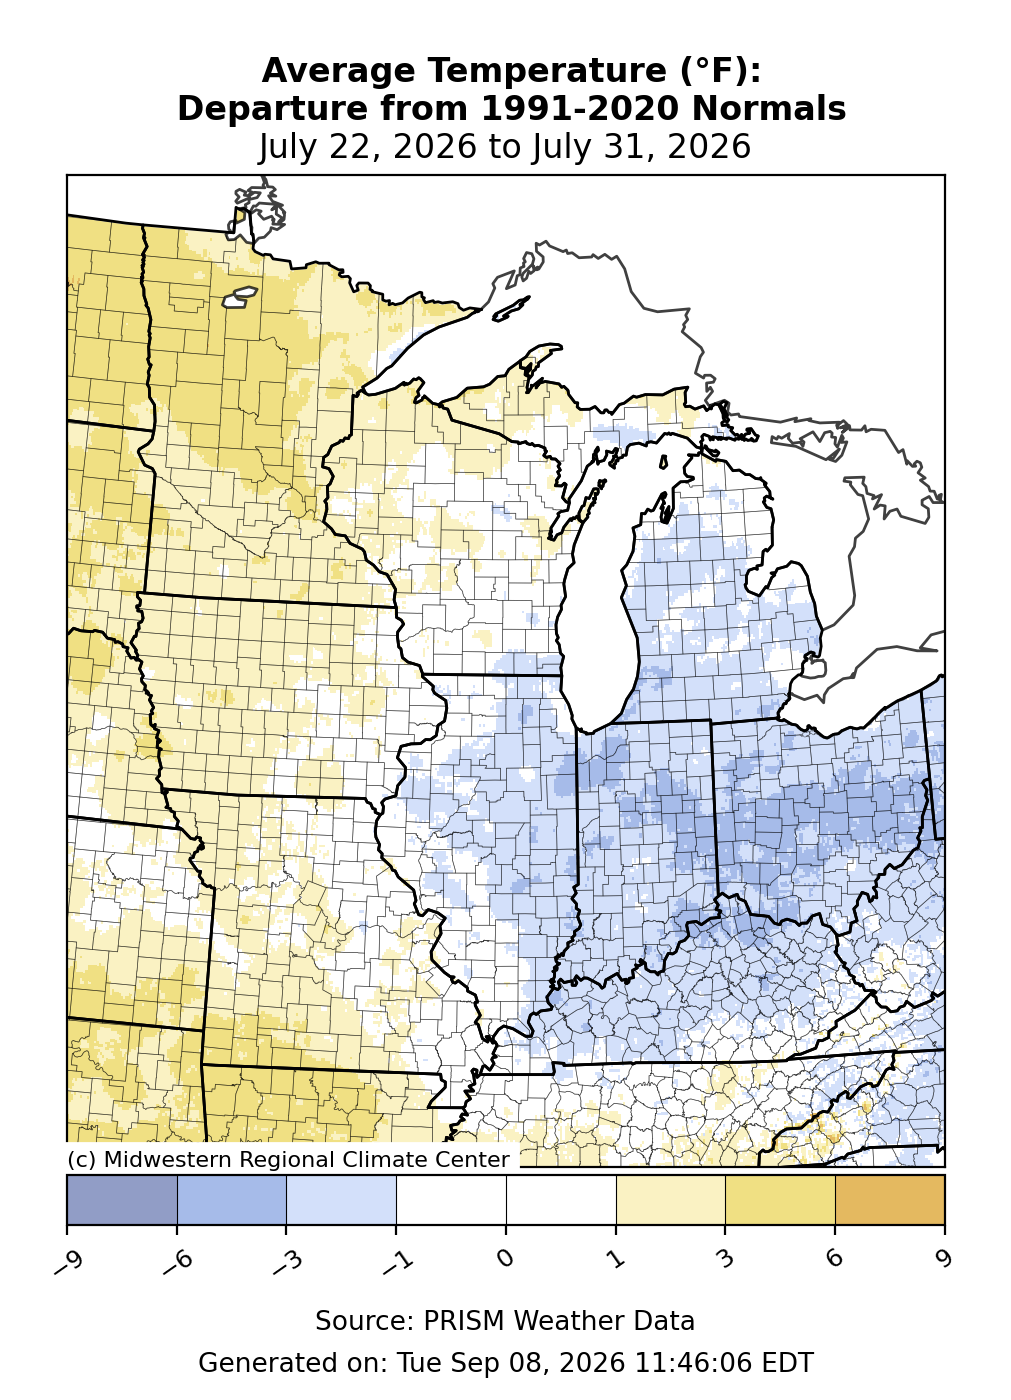
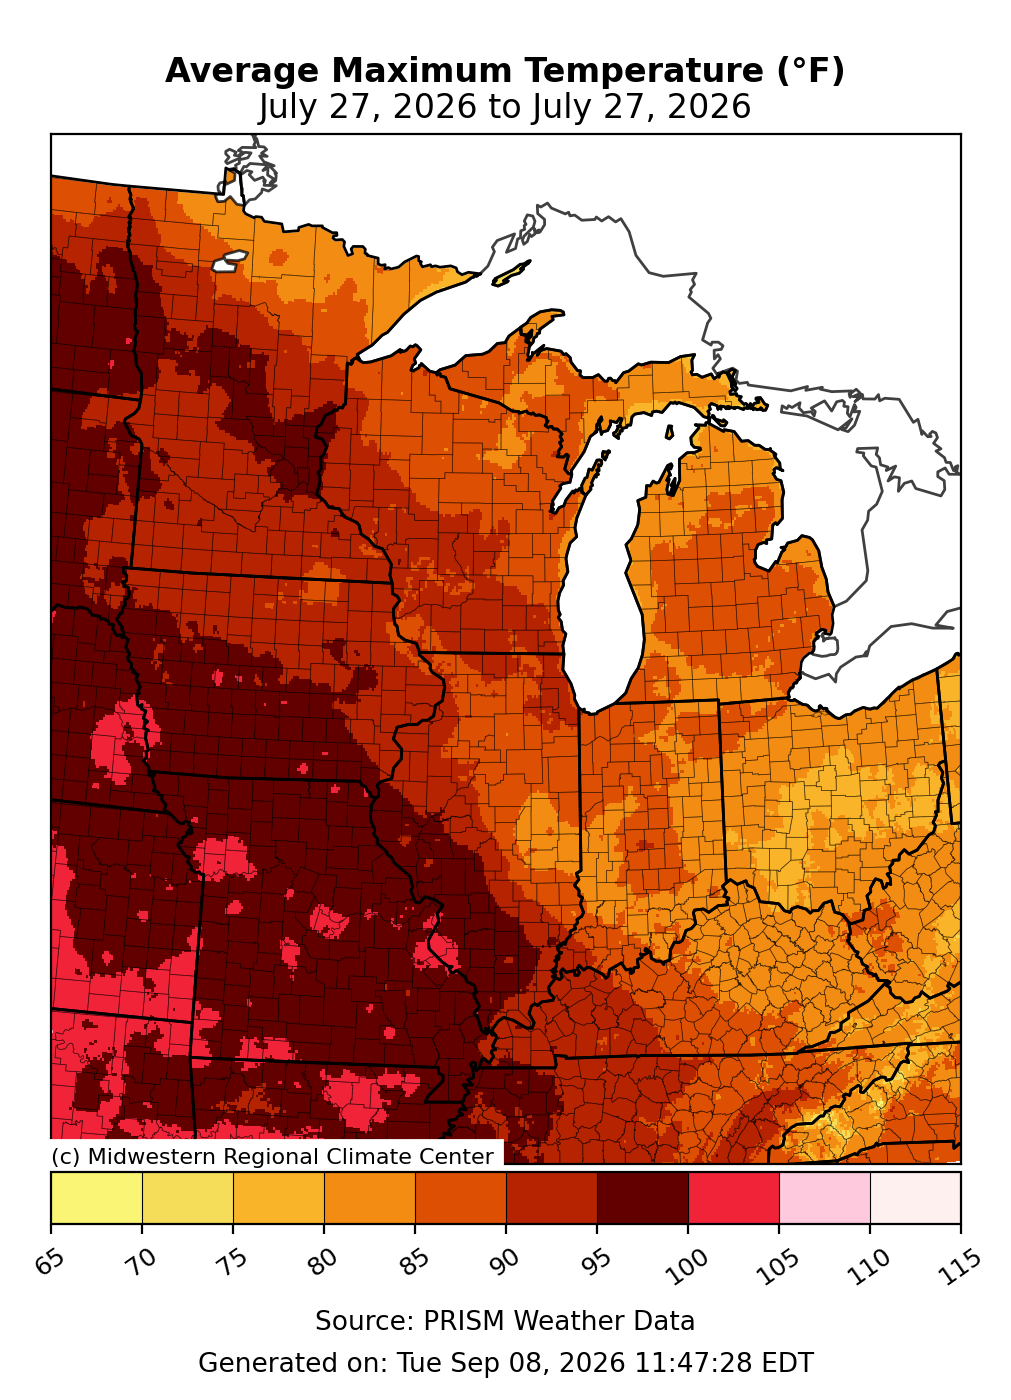
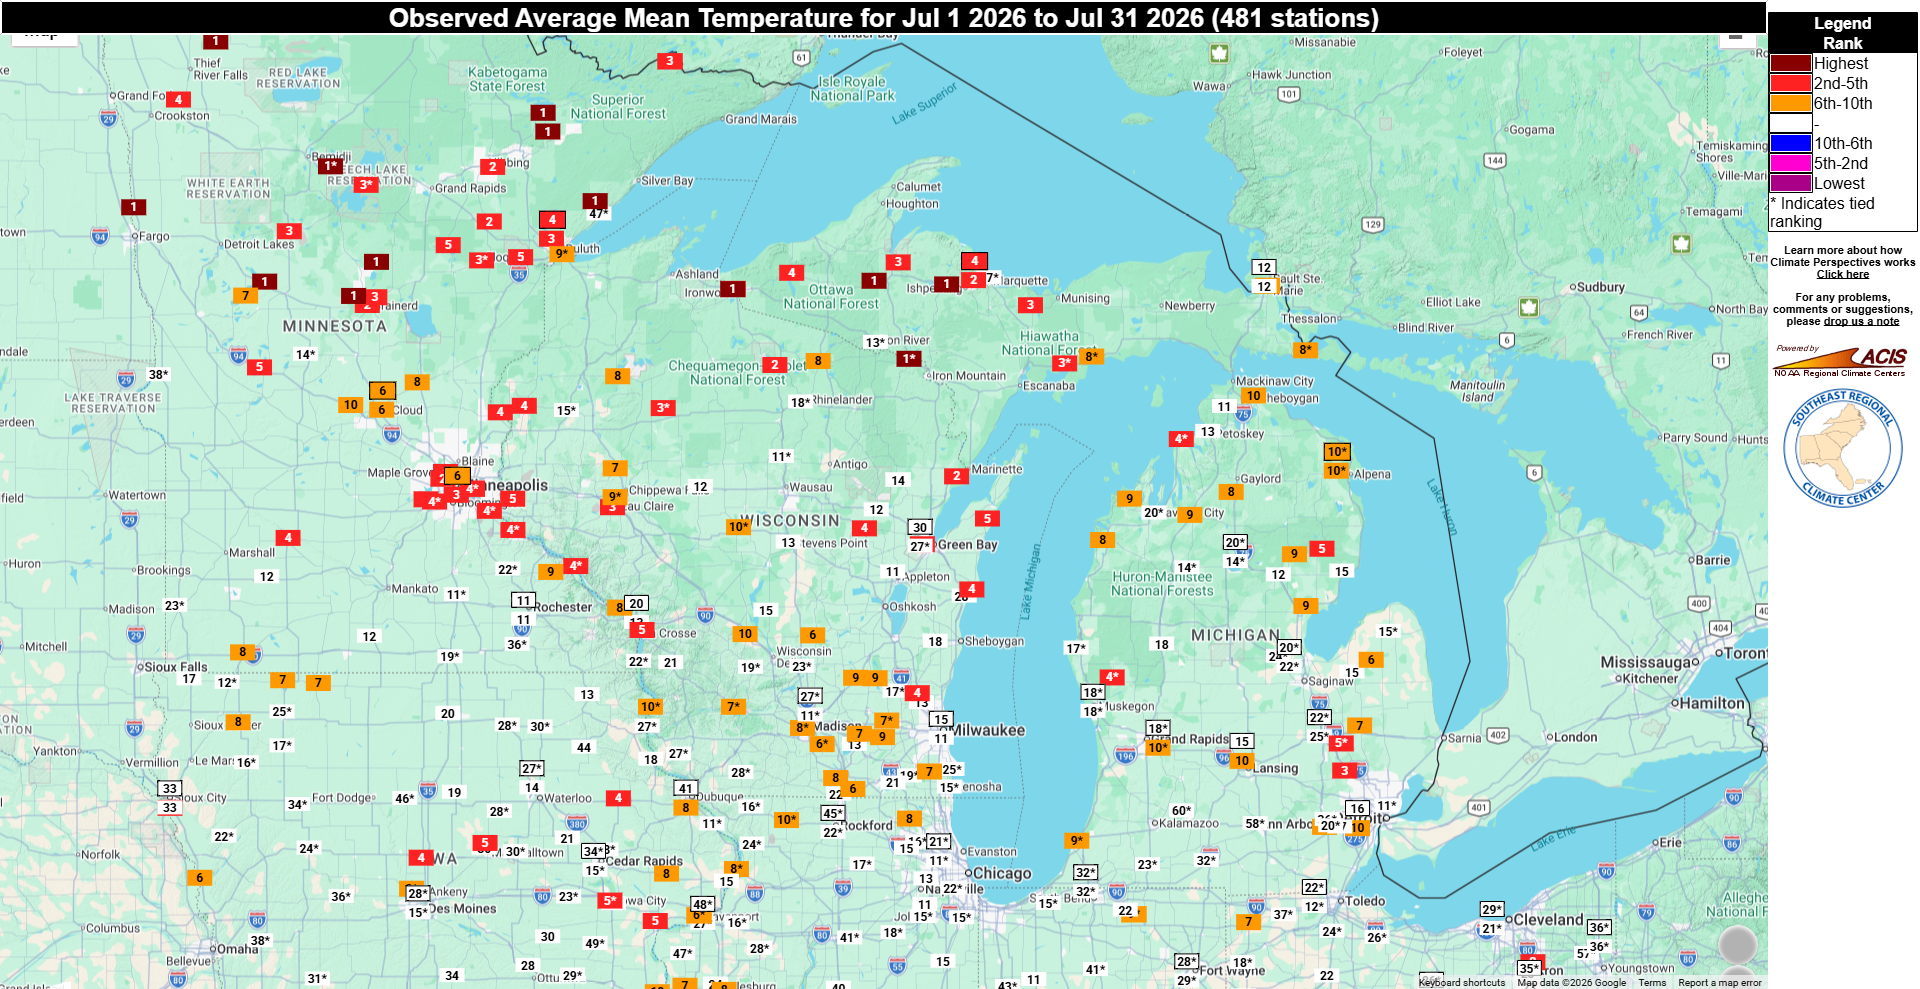
Statewide average temperatures ranged from 1.4°F above normal in Kentucky, Indiana, and Illinois, to 4.7°F above normal in Minnesota (Figure 1). Final rankings indicate that Minnesota, Wisconsin, and Michigan had their 5th, 11th (tied), and 10th (tied) warmest July on record, respectively. July began amid a heatwave that started in the closing days of June. A ridge of high pressure in the eastern U.S. brought a steady stream of Gulf moisture into the region, bringing heat index values from July 1–4 to over 100°F across the central and lower Midwest, with multiple days of widespread excessive heat warnings. Air temperatures were in the low 90s with dew points in the mid- to upper-70s, creating dangerous conditions. Overnight low temperatures were elevated for multiple days, providing little relief from the daytime heat. The extreme heat caused roadways to buckle in Illinois, school and activity adjustments in Iowa, and increased energy and cooling demands in Wisconsin. Extreme heat resettled across the upper Midwest mid-month. The Twin Cities (Minnesota) recorded 10 consecutive days with high temperatures at or above 90°F from July 11 to July 20, which was its third-longest stretch dating back to 1871. Temperatures moderated toward the end of the month for the eastern half of the region, with temperatures 1°F to 4°F below normal from July 22 to 31 (Figure 3); temperatures remained elevated by 2°F to 4°F across Minnesota in late July. On July 27, the high temperature in Minneapolis, Minnesota, reached 100°F (Figure 4), and dew point temperatures reached 80°F—a very rare occurrence—for six consecutive hours. Cities across the far upper Midwest, from northern Minnesota eastward across Michigan’s Upper Peninsula, had a top-five warmest July on record (Figure 5).
Precipitation
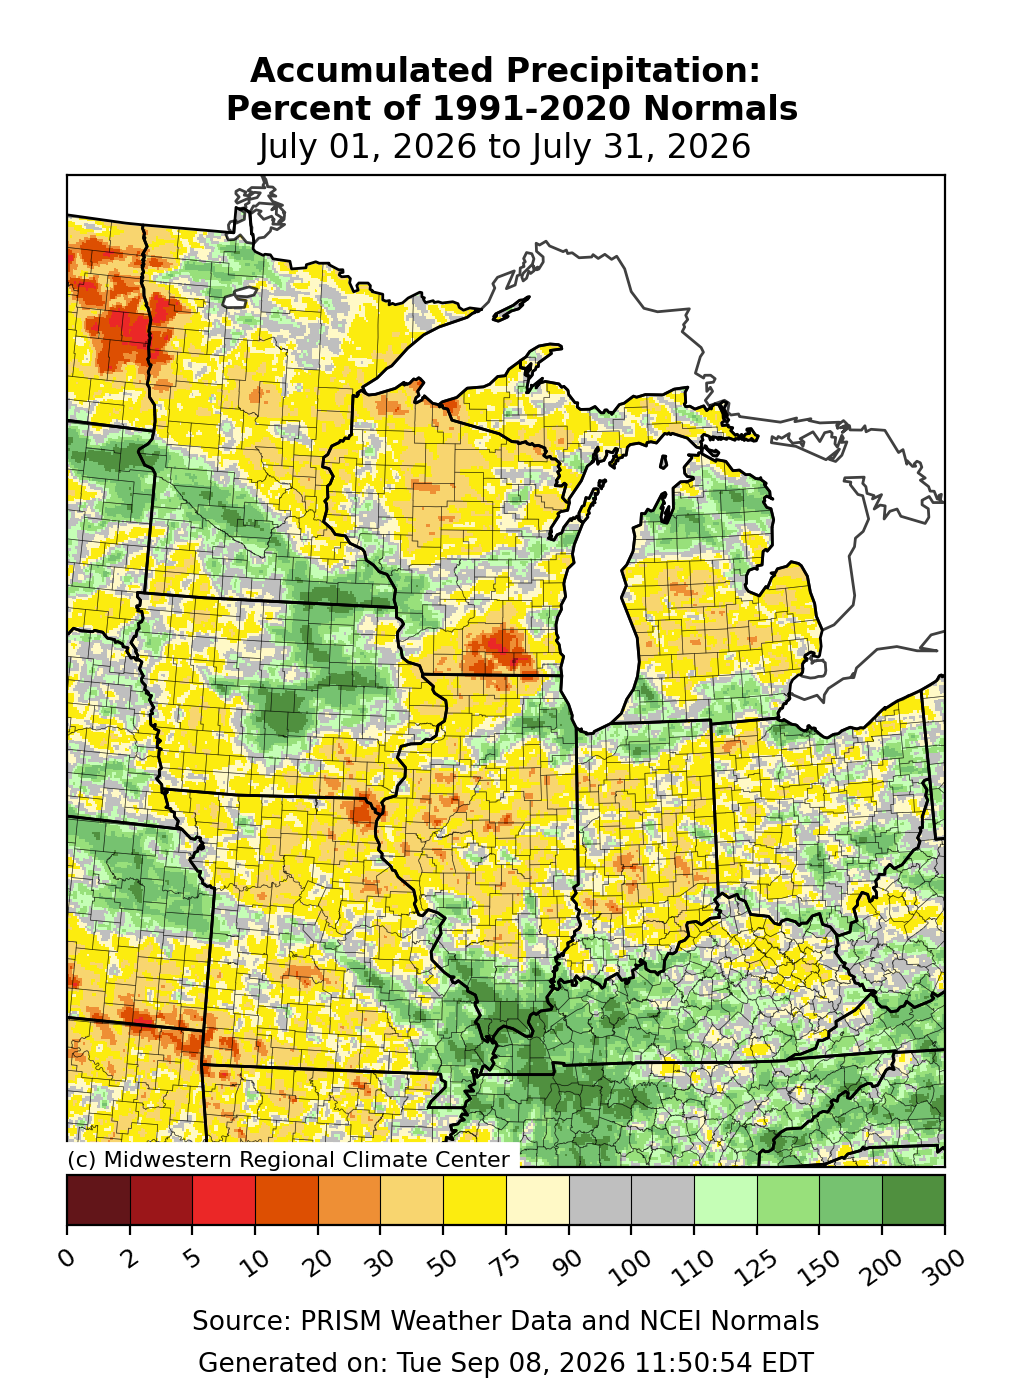
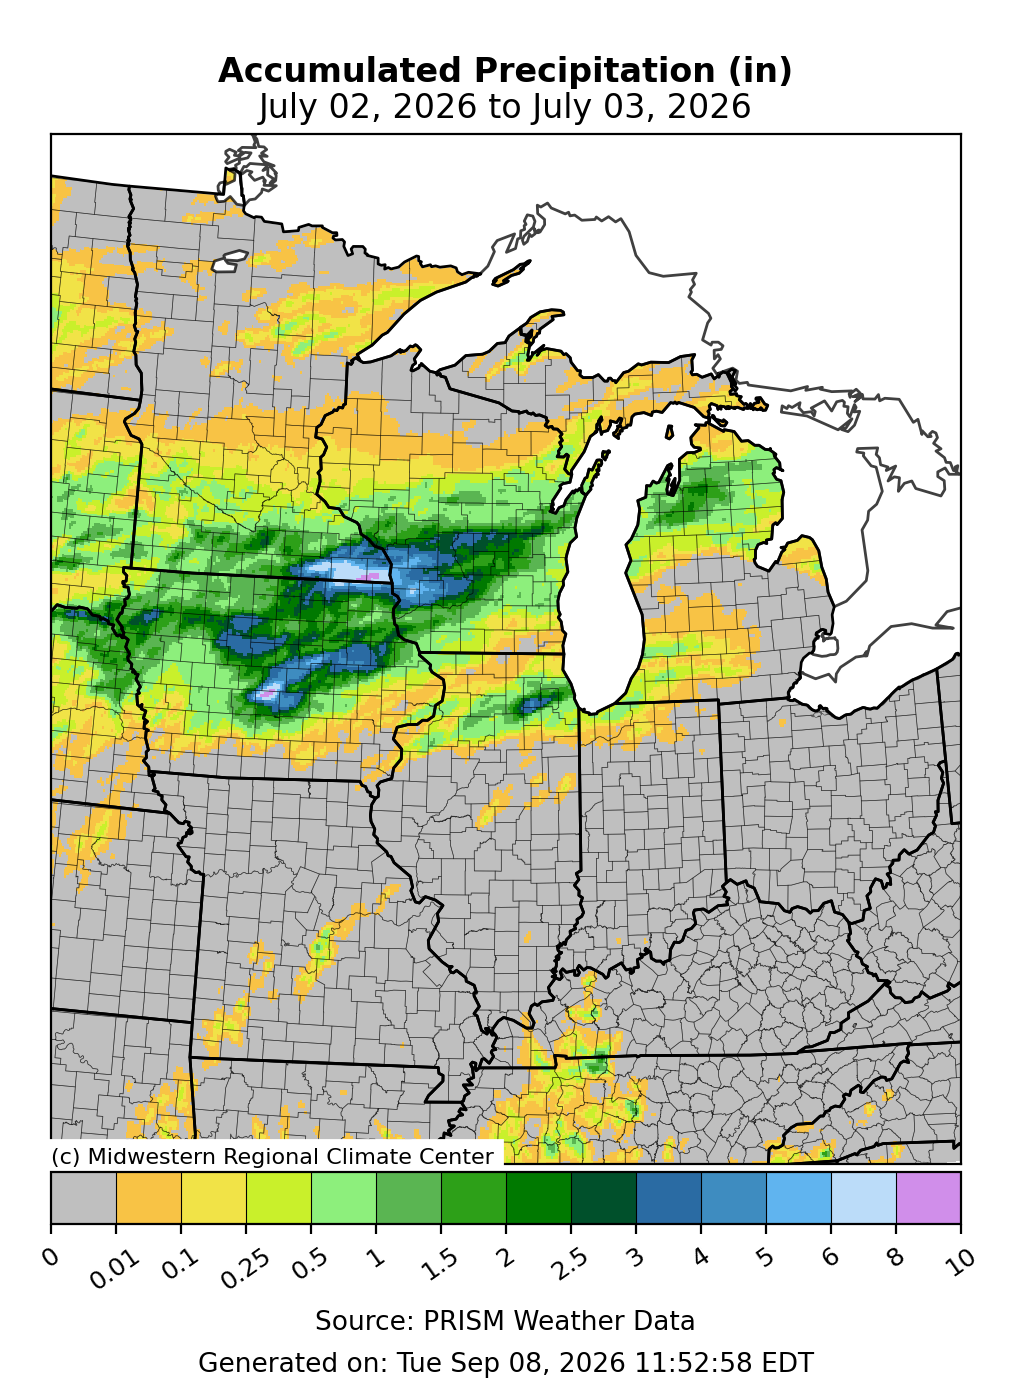
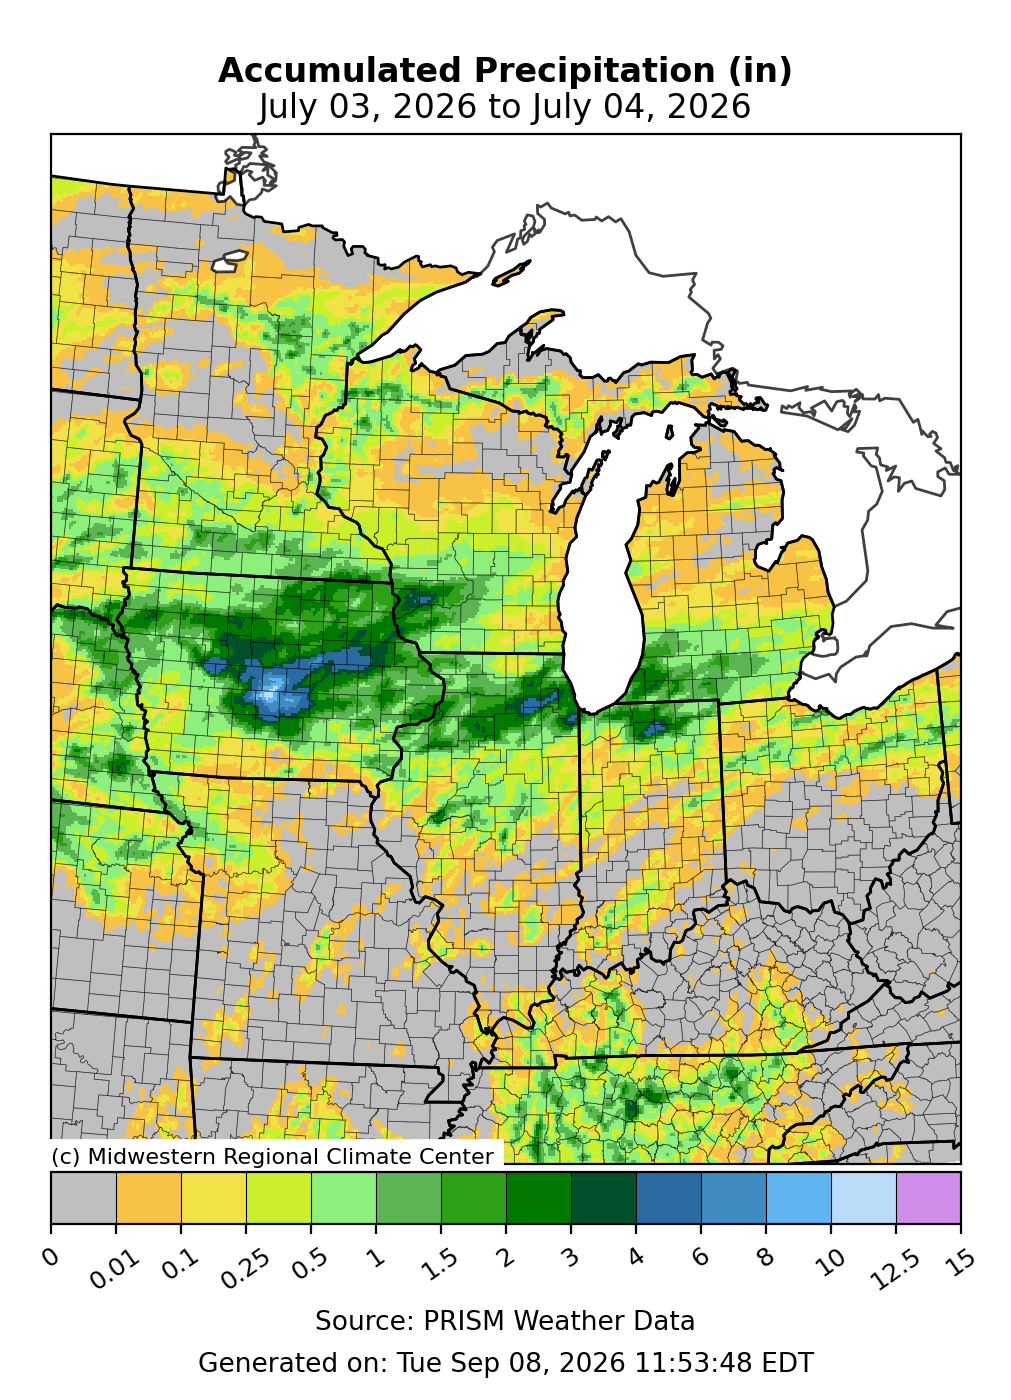
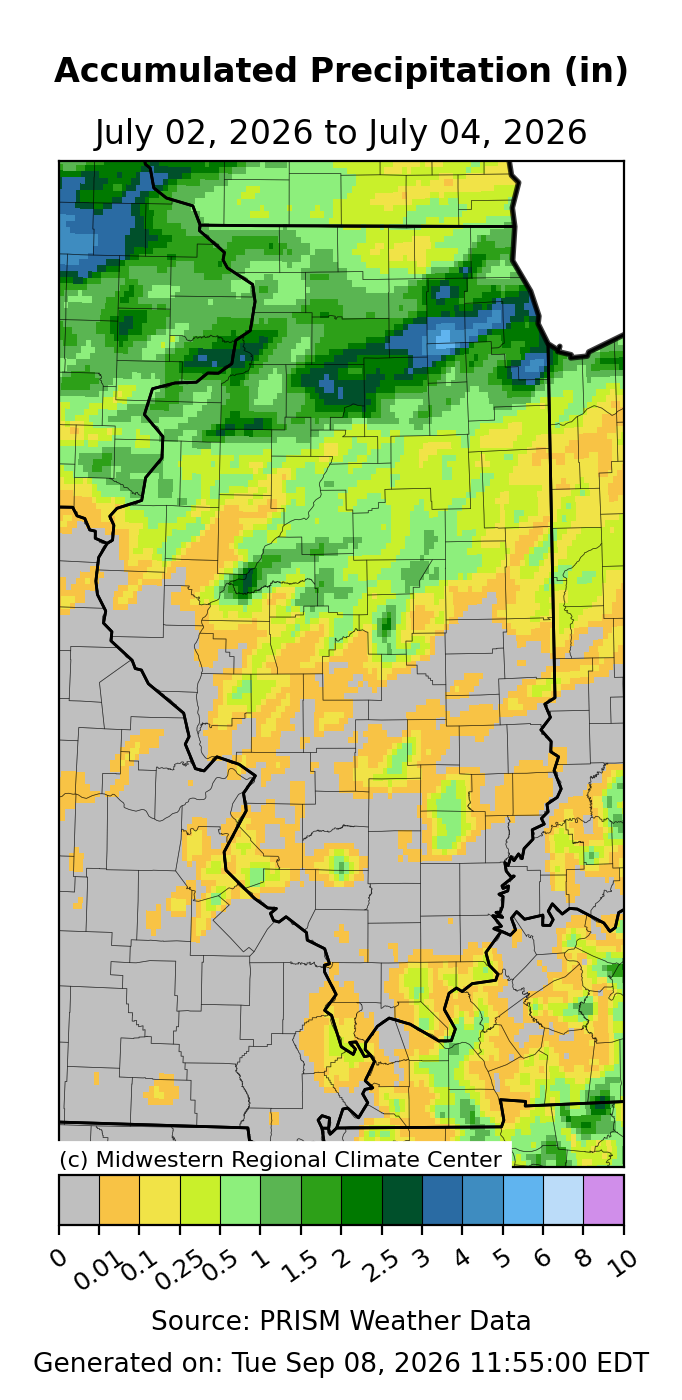
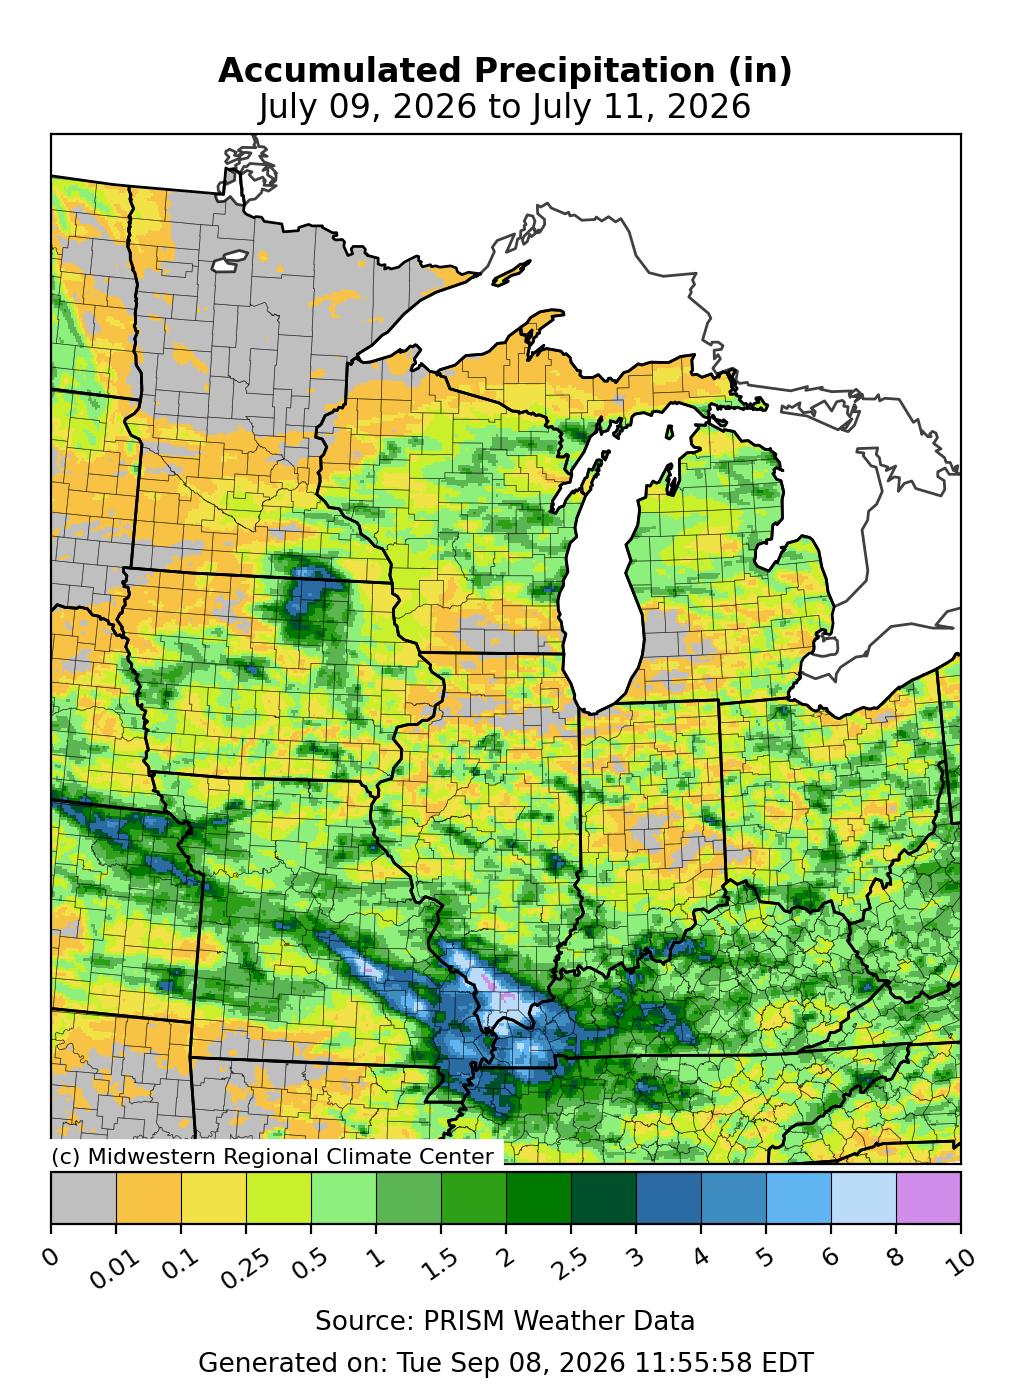
July precipitation totaled 3.45 inches for the Midwest, which was 0.65 inches below normal, or about 84 percent of normal. While most of the region had monthly precipitation between 30–75 percent of normal, there were areas with notable wetness in central Iowa and the south-central Midwest and notable dryness in southern Wisconsin (Figure 6). Statewide precipitation totals ranged from 1.02 inches above normal in Kentucky to 1.29 inches below normal in Missouri. The early July weather pattern that brought extreme heat to the region also enabled significant rainfall from multiple storm systems, mainly affecting central Iowa, southeast Minnesota, and northern Illinois. In southeast Minnesota, weather stations across multiple counties reported 48-hour rainfall totals of 6 to 8.5 inches on July 2–3 (Figure 7). In central Iowa, 5 to 10 inches fell from late July 2 to early July 3, followed by 4 to 7 inches from late July 3 to early July 4, resulting in flash flooding and river flooding (Figure 8). Across northern Illinois, 3 to 8 inches fell July 2–4, with several automated gauges reporting rainfall rates of 3 to 4 inches per hour at the peak of the storm on July 4 (Figure 9). For the first time since its construction over 50 years ago, Chicago’s Deep Tunnel stormwater storage system was nearly at full capacity. The following week, significant rainfall affected the south-central Midwest. A wide area of 5 to 11 inches of rain fell in southern Illinois, southeastern Missouri, and western Kentucky from July 9–11, washing out roads and inundating structures with floodwaters (Figure 10). In Lesterville (southeast Missouri), over 200 children and staff required an airlift evacuation from a summer camp after nearby roads were washed away by heavy rainfall. Dryness was much more widespread throughout the region for the second half of the month, with a wide swath arching from central Minnesota into Wisconsin and central Illinois having little to no measurable precipitation. For the month as a whole, Grand Meadow (southeast Minnesota) had its 2nd wettest July in 139 years with 13.2 inches, which was 8.54 inches above normal. In western Kentucky, Murray had its 2nd wettest July in 97 years with 12.15 inches, and it tied the record for the greatest number of days (6 days) in July with at least 1 inch of precipitation. Conversely, Ironwood (in Michigan’s far western Upper Peninsula) had its 3rd driest July in 125 years with just 0.93 inches, which was 3.28 inches below normal.
Drought
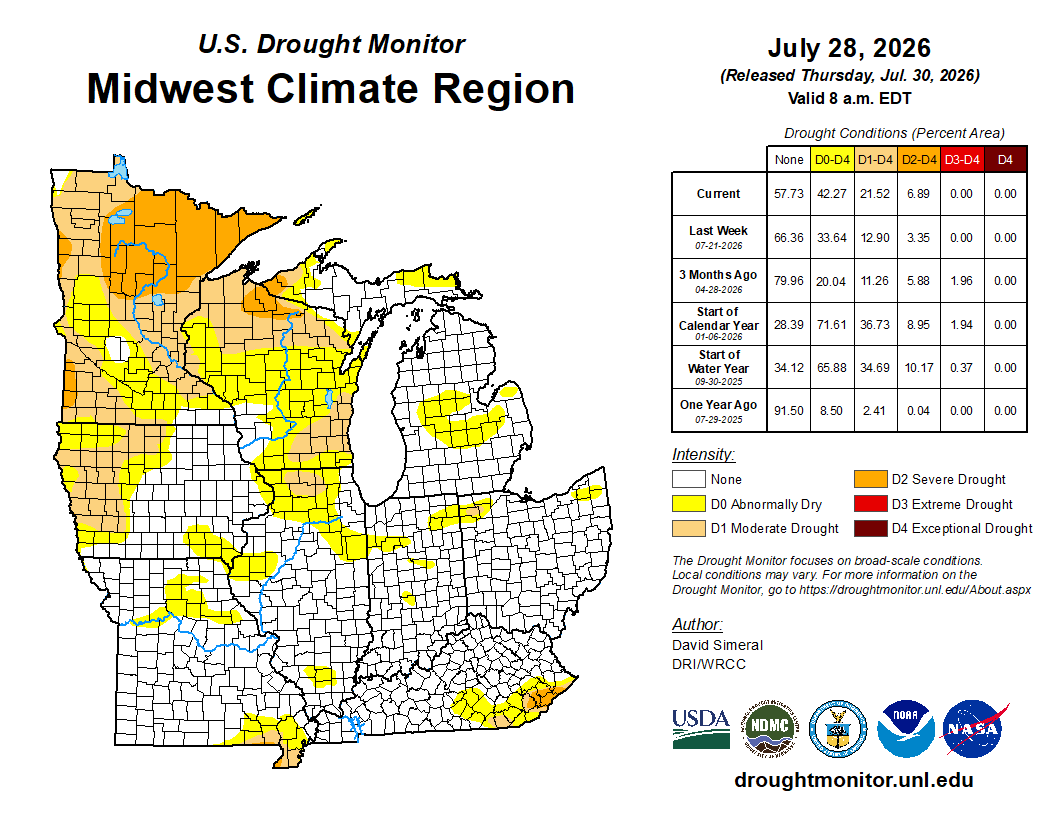
Drought and abnormal dryness expanded across the upper Midwest throughout July, while conditions slightly improved across the far lower Midwest (Figure 11). As a whole, the Midwest concluded the month with about 21 percent of the region in drought and about 20 percent abnormally dry, most of which was confined to the northern half of the region. In Minnesota alone, about three-quarters of the state was in drought by late July, with nearly 35 percent in severe (D2) drought on the U.S. Drought Monitor map.
Mid-July Reduced Air Quality
Smoke from Canadian wildfires pushed into and lingered throughout the upper and central Midwest in mid-July, resulting in Minnesota’s worst smoke outbreak in at least 50 years, according to the state’s climate office. Air quality alerts were issued across Minnesota, Wisconsin, Michigan, Illinois, Indiana, Ohio, and surrounding areas for nearly a week. Across Michigan, extremely poor air quality forced the cancellation of summer school classes, sports, and activities. In Detroit, non-essential city staff were sent home. Chicago closed its beaches and pools despite the heat due to hazardous air quality levels.