June 22-30, 2026
Temperature
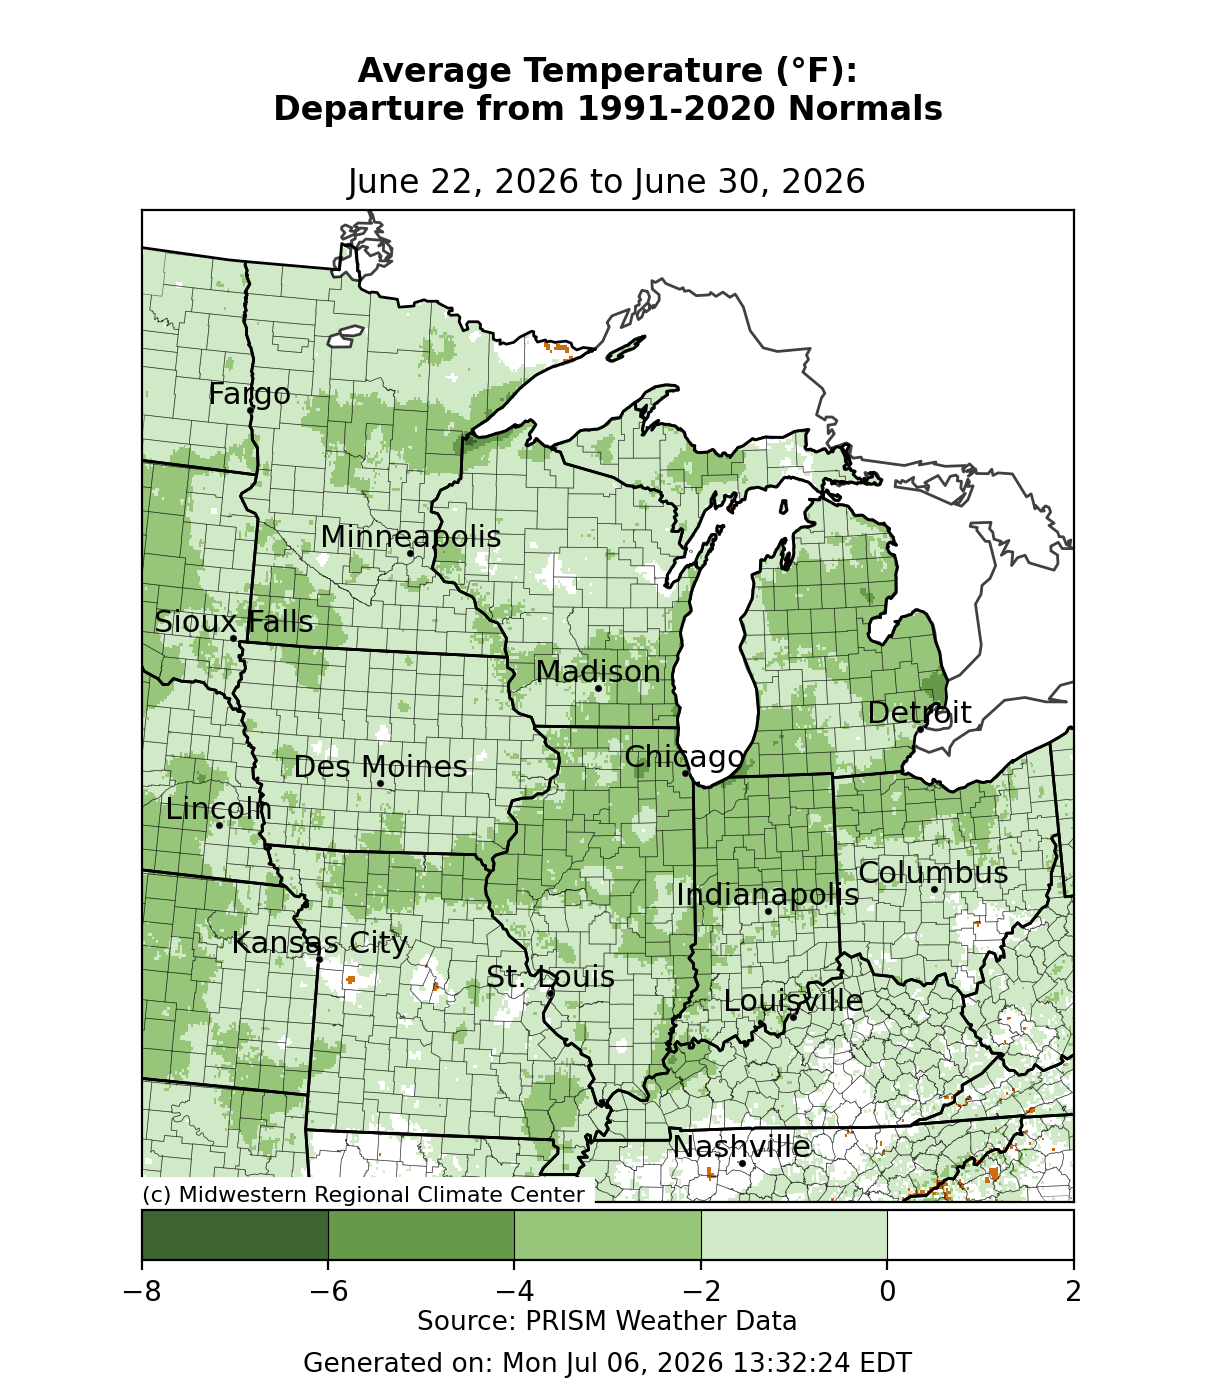
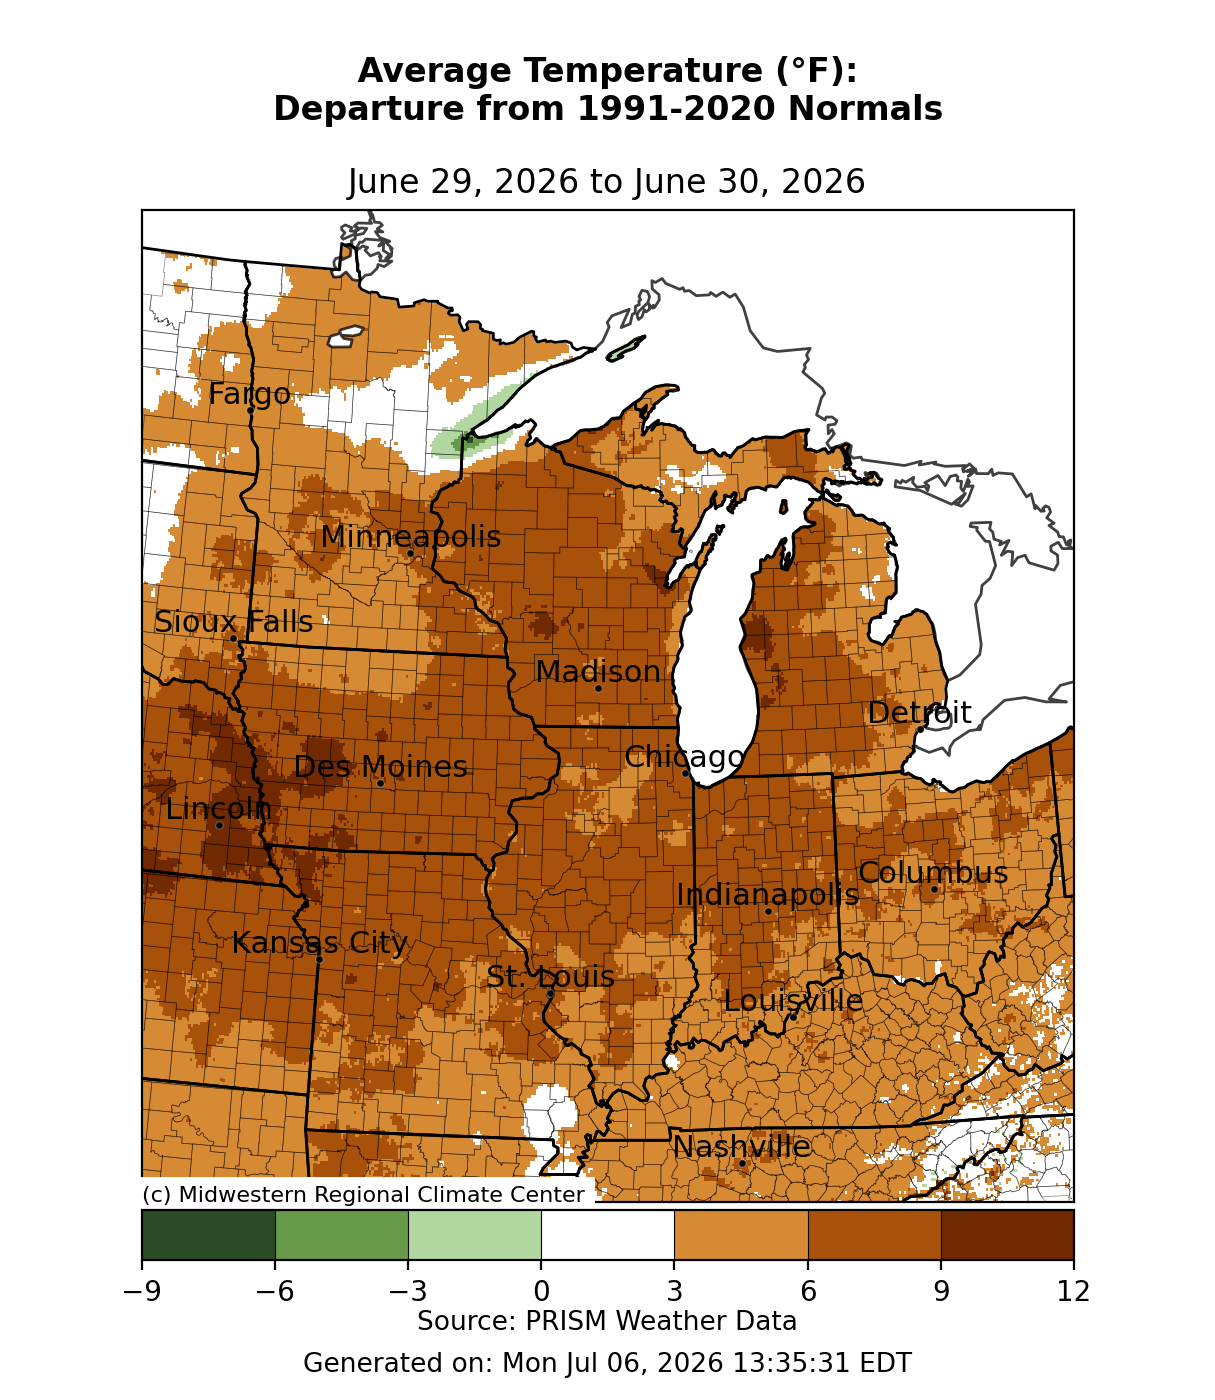
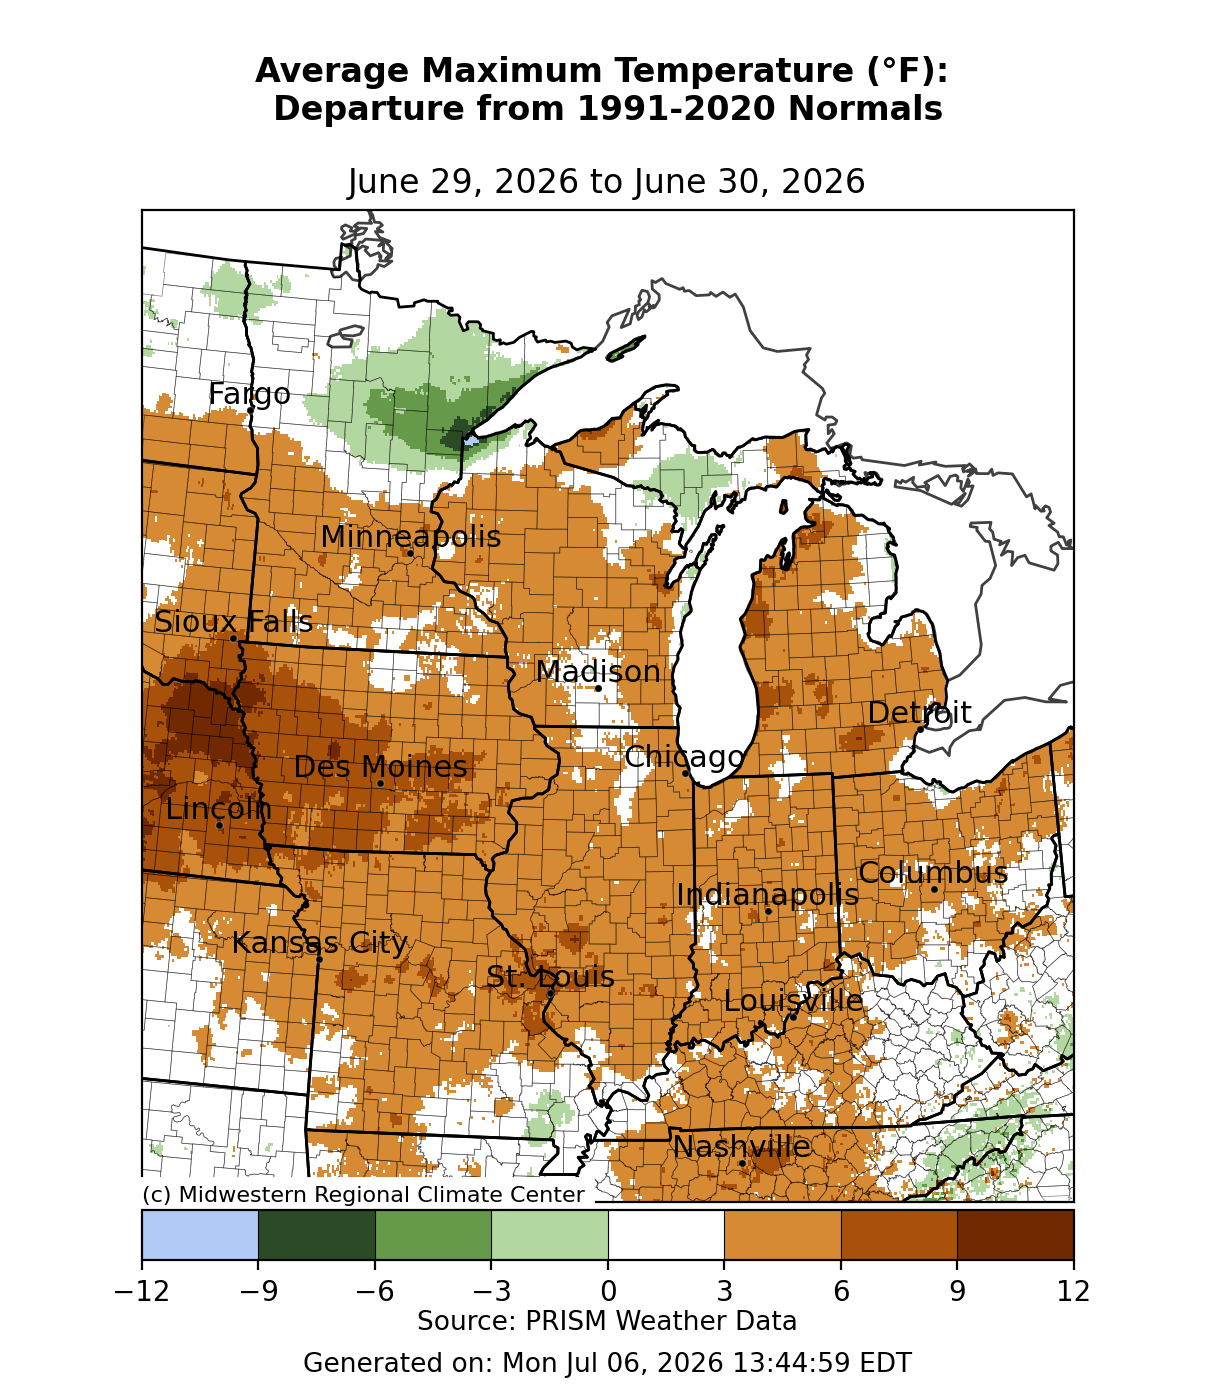
Average temperatures were slightly below normal for most of the period (Figure 1). Temperatures were 1-3°F below normal across much of the region, with some areas up to 4°F below normal for the week. Conversely, a look at the final two days of the period alone, June 29-30, reveals that temperatures were well above normal, often by 5-10°F as a heat dome began to settle over the region (Figure 2).
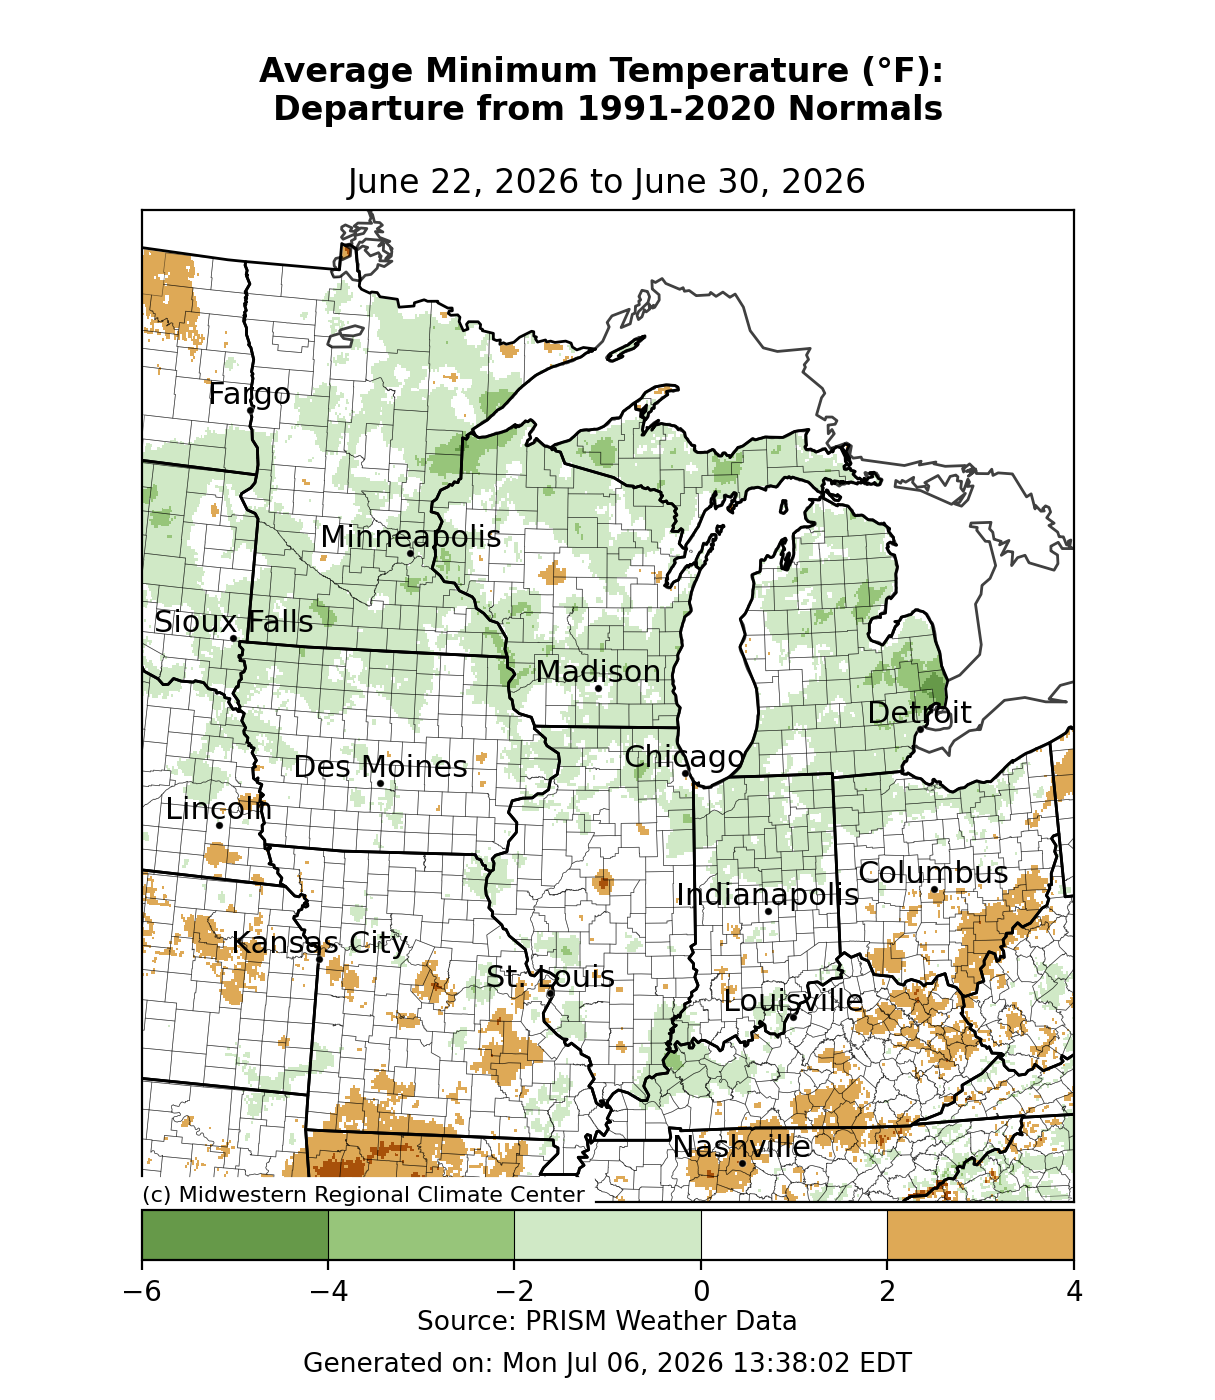
Minimum temperatures were mostly near normal across the region (Figure 3). There were some pockets of slightly below-normal minimum temperatures, particularly across the Upper Midwest. There were also areas of slightly above-normal minimum temperatures across southern areas.
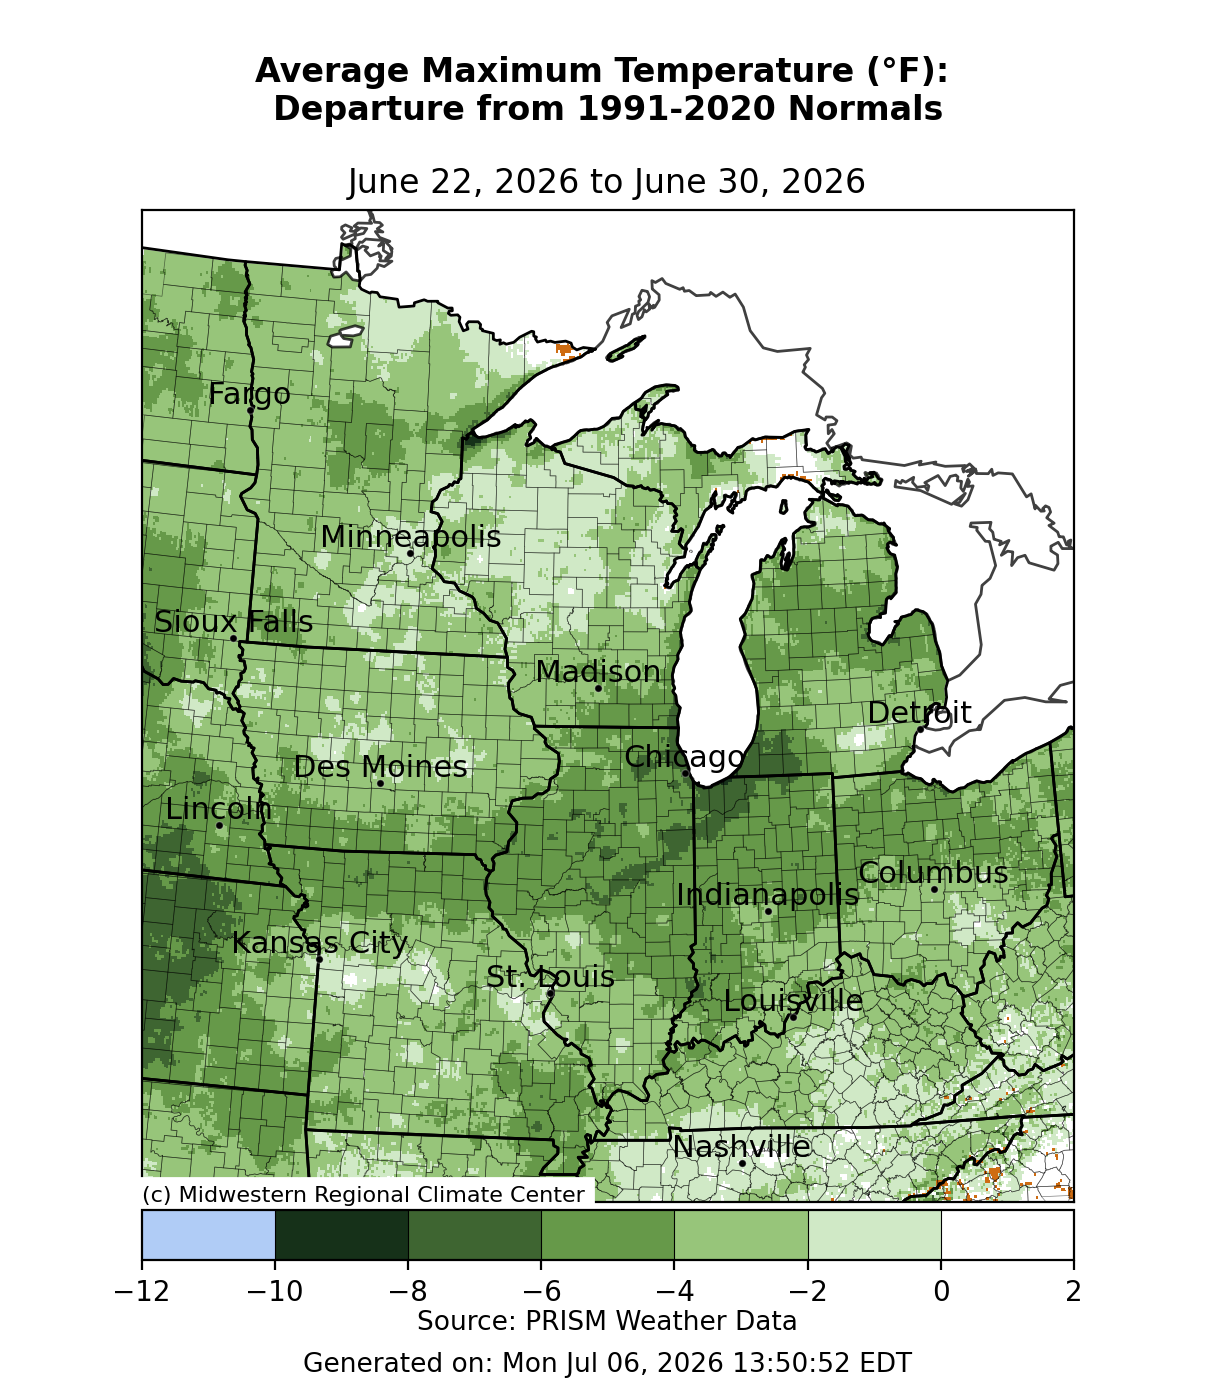
Maximum temperatures were 5-10°F below normal for much of the region (Figure 4). The greatest departures from normal were along and south of I-80. Despite this, maximum temperatures did rise above normal to end the period, with much of the region 3-6°F above normal from June 29-30 (Figure 5).
Precipitation/Drought
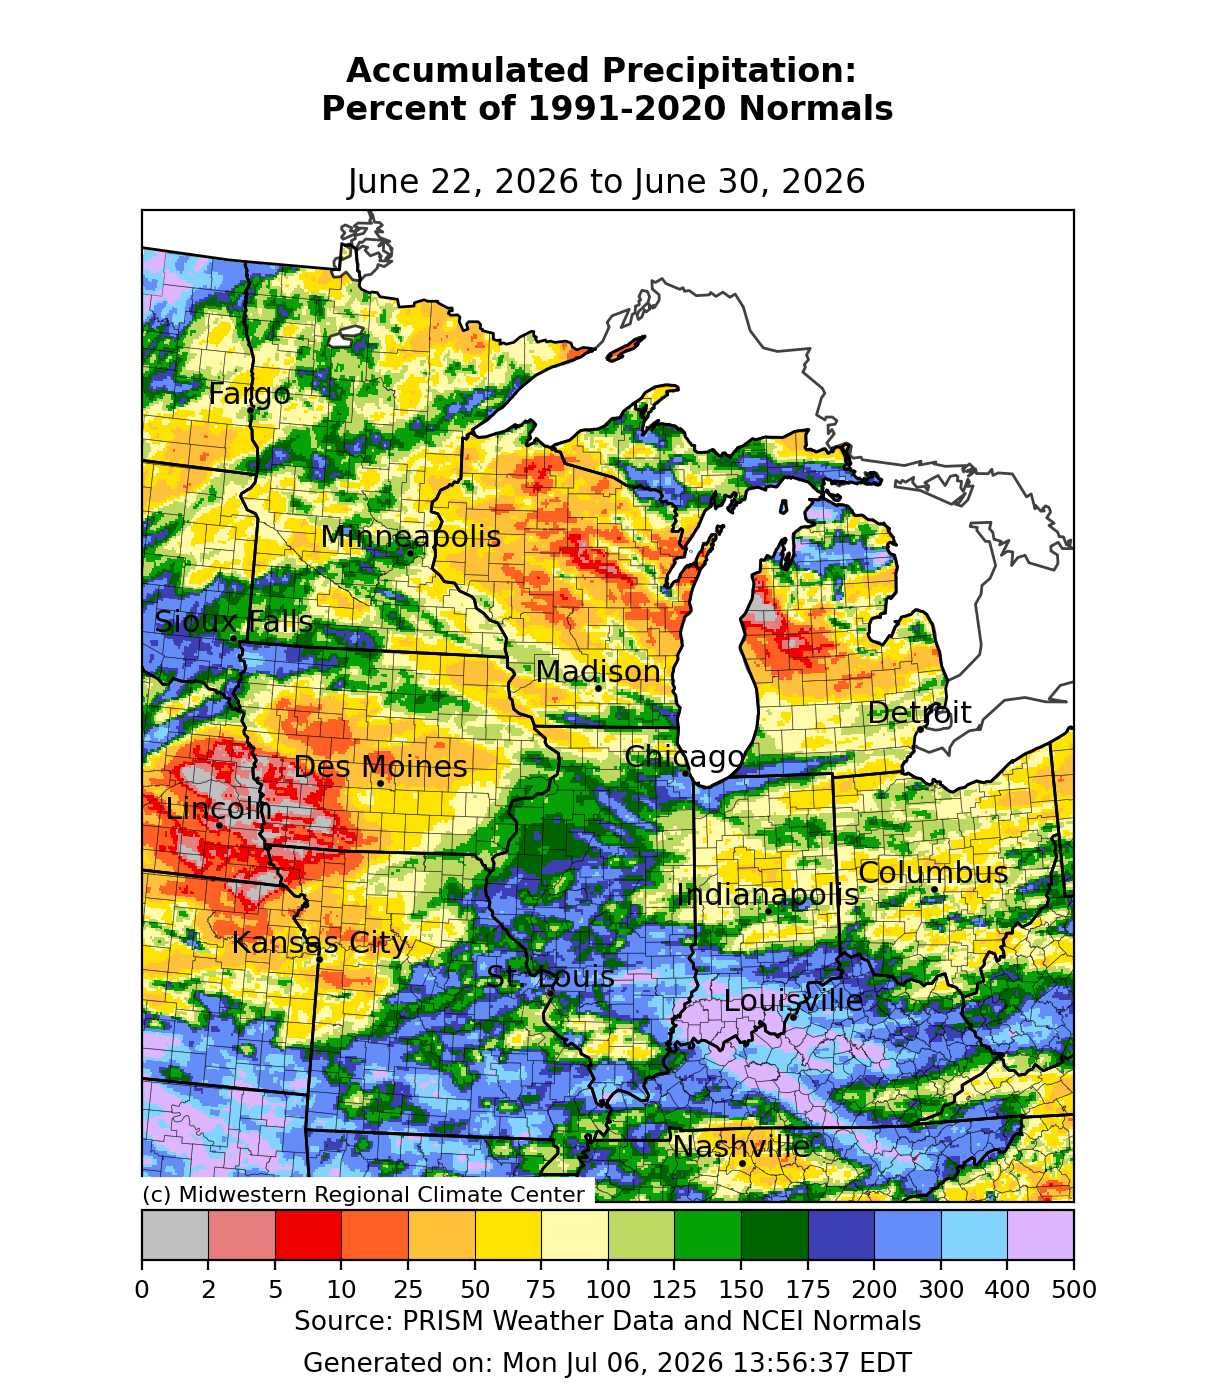
Precipitation departures varied across the region, with some areas receiving above-normal precipitation and others receiving below-normal precipitation. Many areas across the southern tier of the region observed over 200 percent of normal precipitation, and some parts of southern Indiana and central Kentucky observed over 400 percent of normal precipitation (Figure 6). Meanwhile, parts of northwestern Missouri, western Iowa, western Michigan, and Wisconsin observed less than 50 percent of normal precipitation. Precipitation was near or slightly below normal for much of Indiana, Ohio, Minnesota, and Michigan’s Upper Peninsula (UP). Evansville, Indiana, observed its wettest 7-day period in June since records began in 1897, with a total of 8.09 inches of precipitation from June 22 through June 28. This made it Evansville’s 2nd wettest June on record.
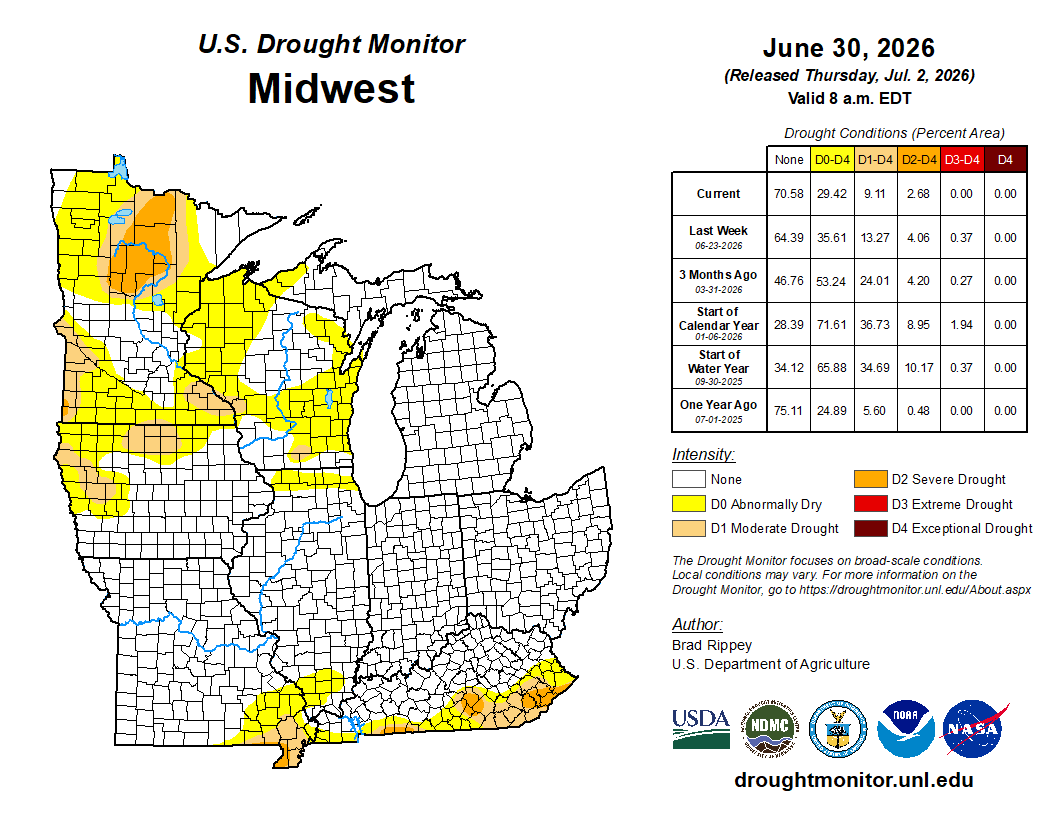
With frequent rainfall, drought conditions improved across the region from June 23 to June 30 (Figure 7). D0 (abnormally dry) decreased, covering less than 30 percent of the region. D1 (moderate drought) and D2 (severe drought) improved across western Iowa, southern Missouri, and Kentucky. D3 (extreme drought) was eliminated from Kentucky.
Severe Weather
There were over 300 reports of severe weather this week (Figure 8). There were 200 wind reports, 18 high-wind reports, 97 hail reports, and 7 large-hail reports. On June 29, a severe weather outbreak in northern Minnesota brought hail the size of golf balls and hen eggs to Aitkin County. On the same day, a personal weather station in Dickinson County, Iowa, observed a 75-mph straight-line wind gust, and an NDAWN station in Jackson County, Minnesota, reported an 80-mph straight-line wind gust.
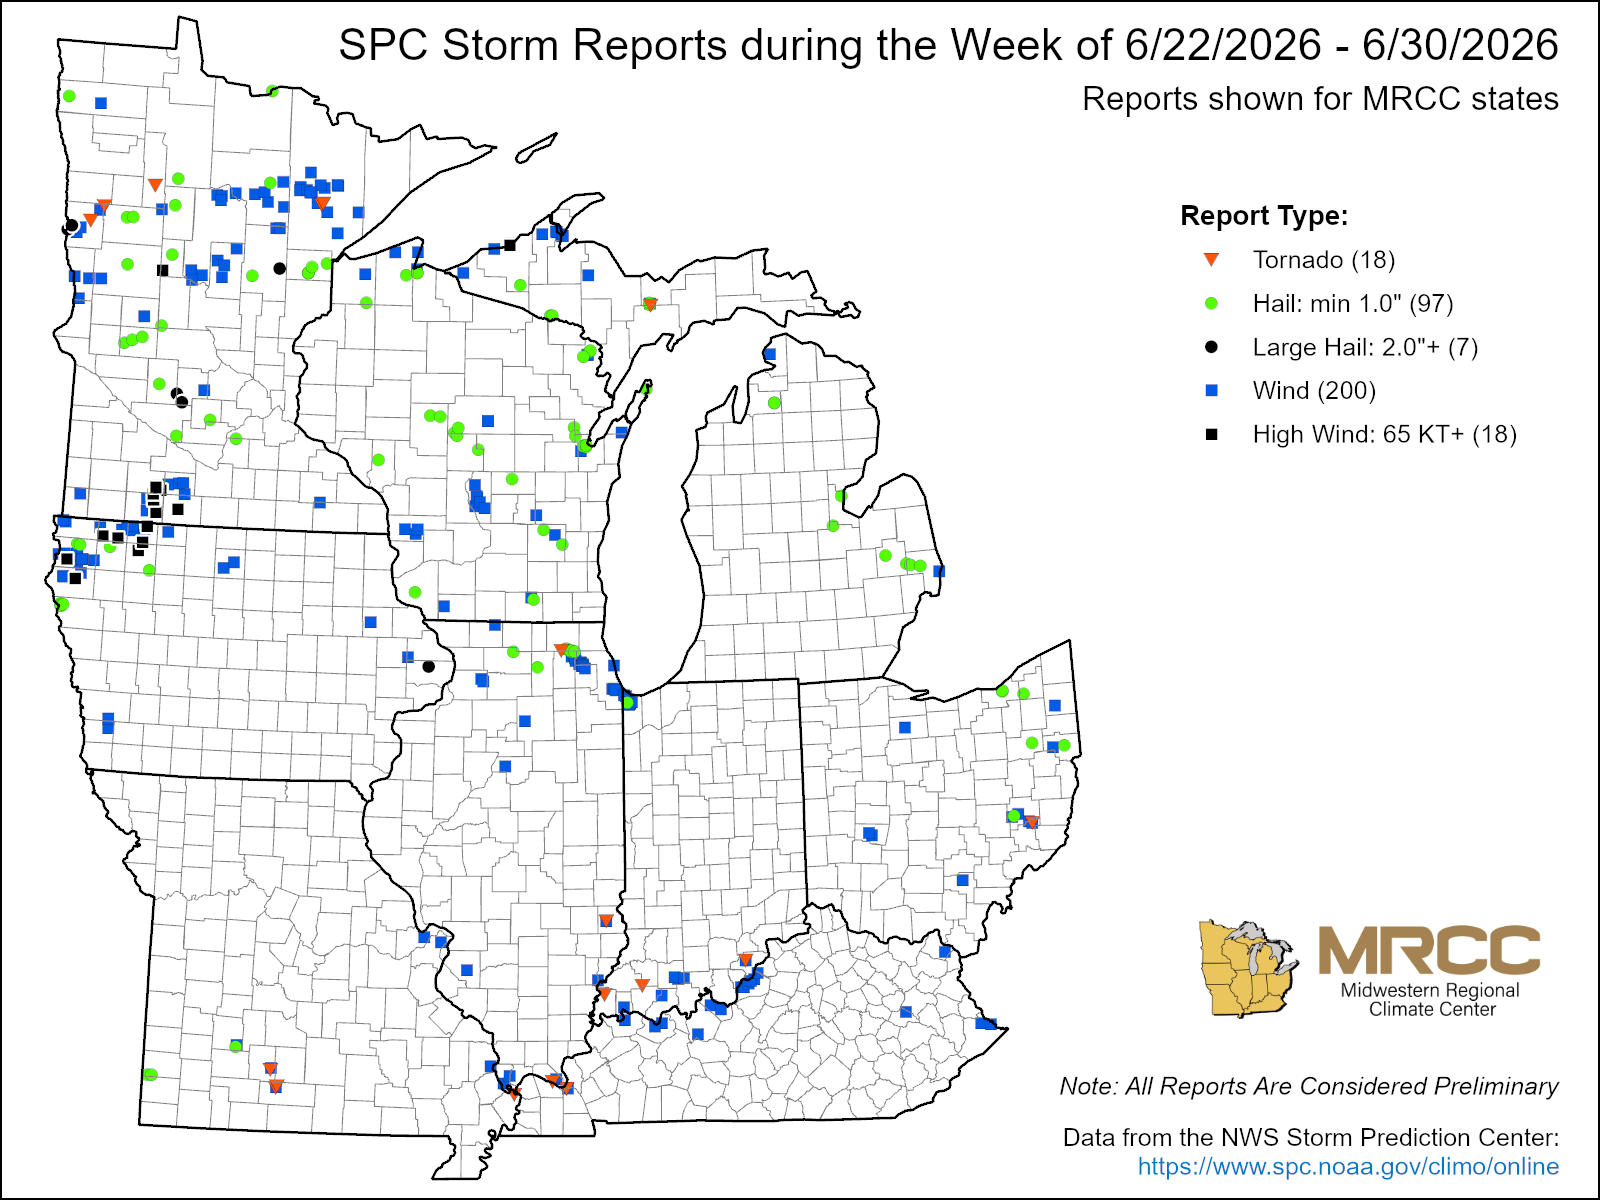
There were also 18 tornado reports throughout the period. In Missouri, on July 26, an EF1 tornado with estimated peak winds of 95 mph occurred in Douglas County. On the same day, a brief EF0 tornado touched down in Clark County, Indiana. On June 27, several brief EF0 and EF1 tornadoes touched down across southern Illinois, southern Indiana, and Kentucky. On June 29, an EF1 tornado briefly touched down in rural St. Louis County in Minnesota. On June 30, a brief EF0 tornado touched down in Michigan’s UP, the first there since 2021.