May 2026
May 2026 Overview – Midwestern Regional Climate Center
Temperature
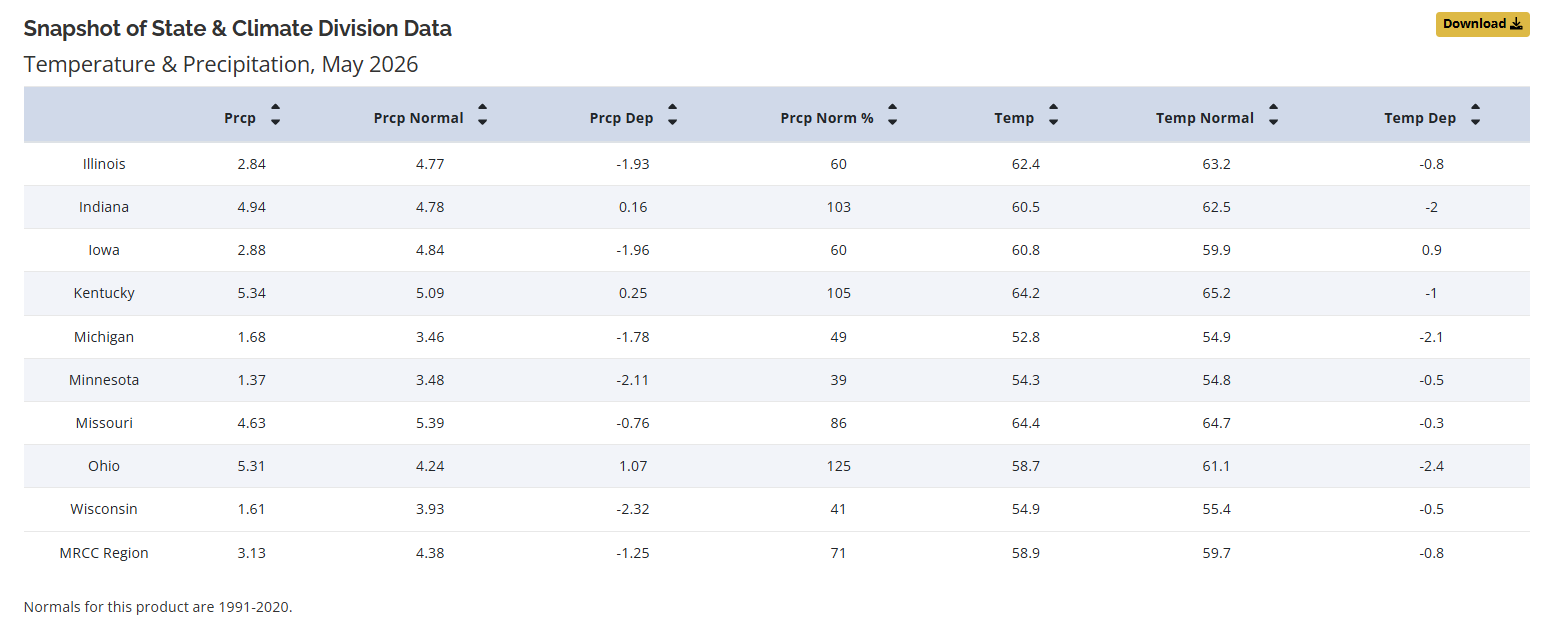
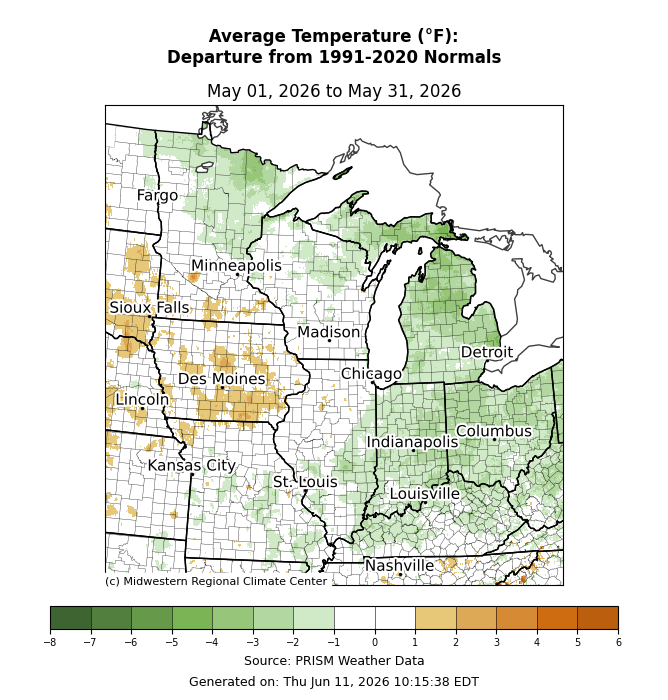
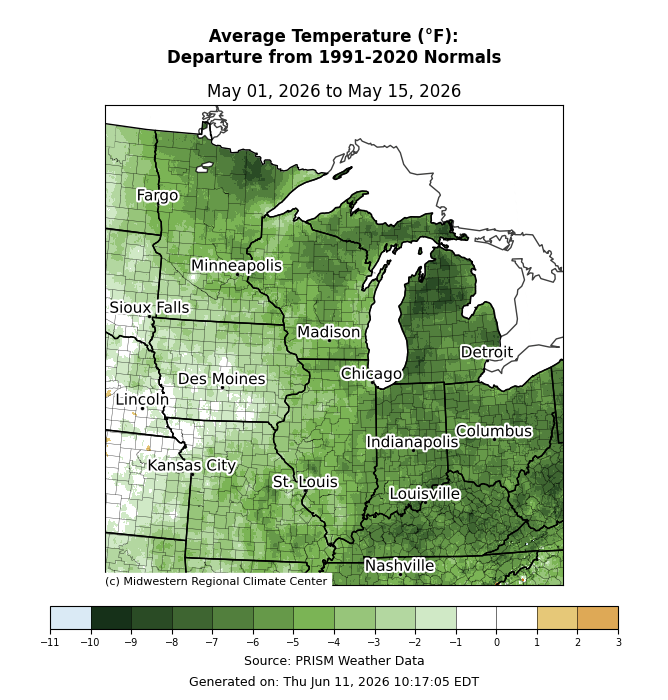
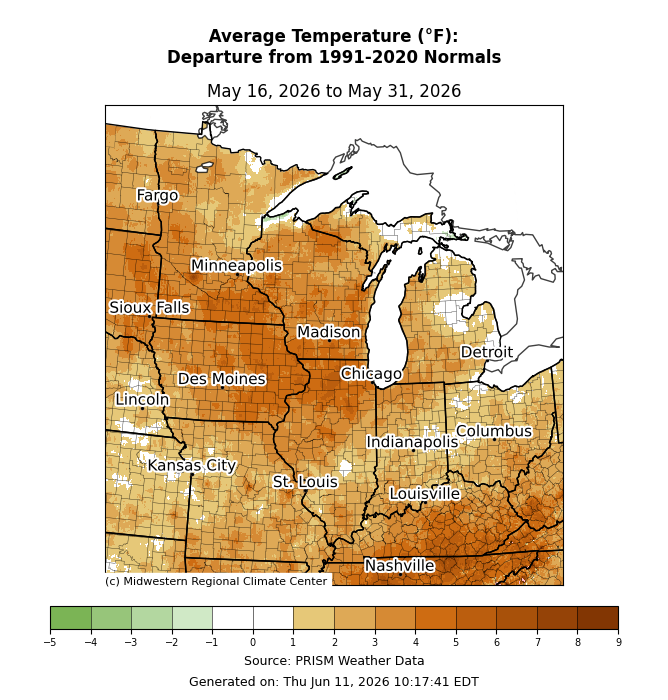
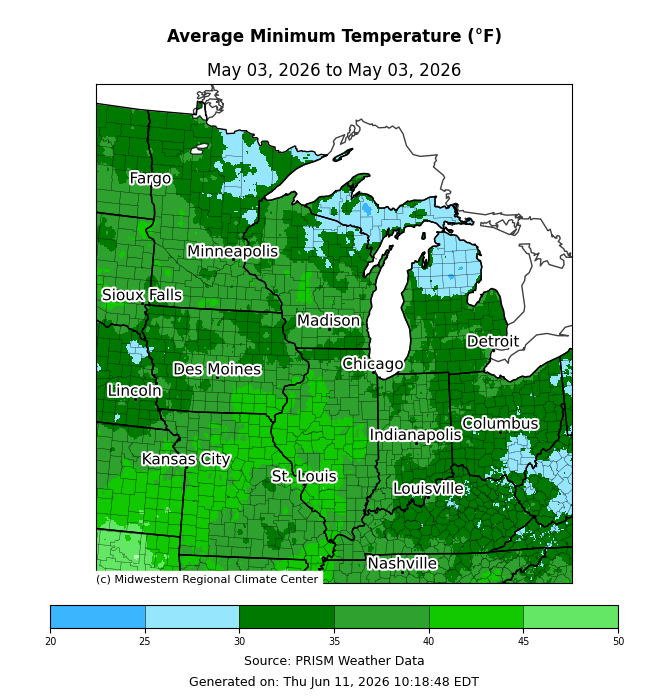
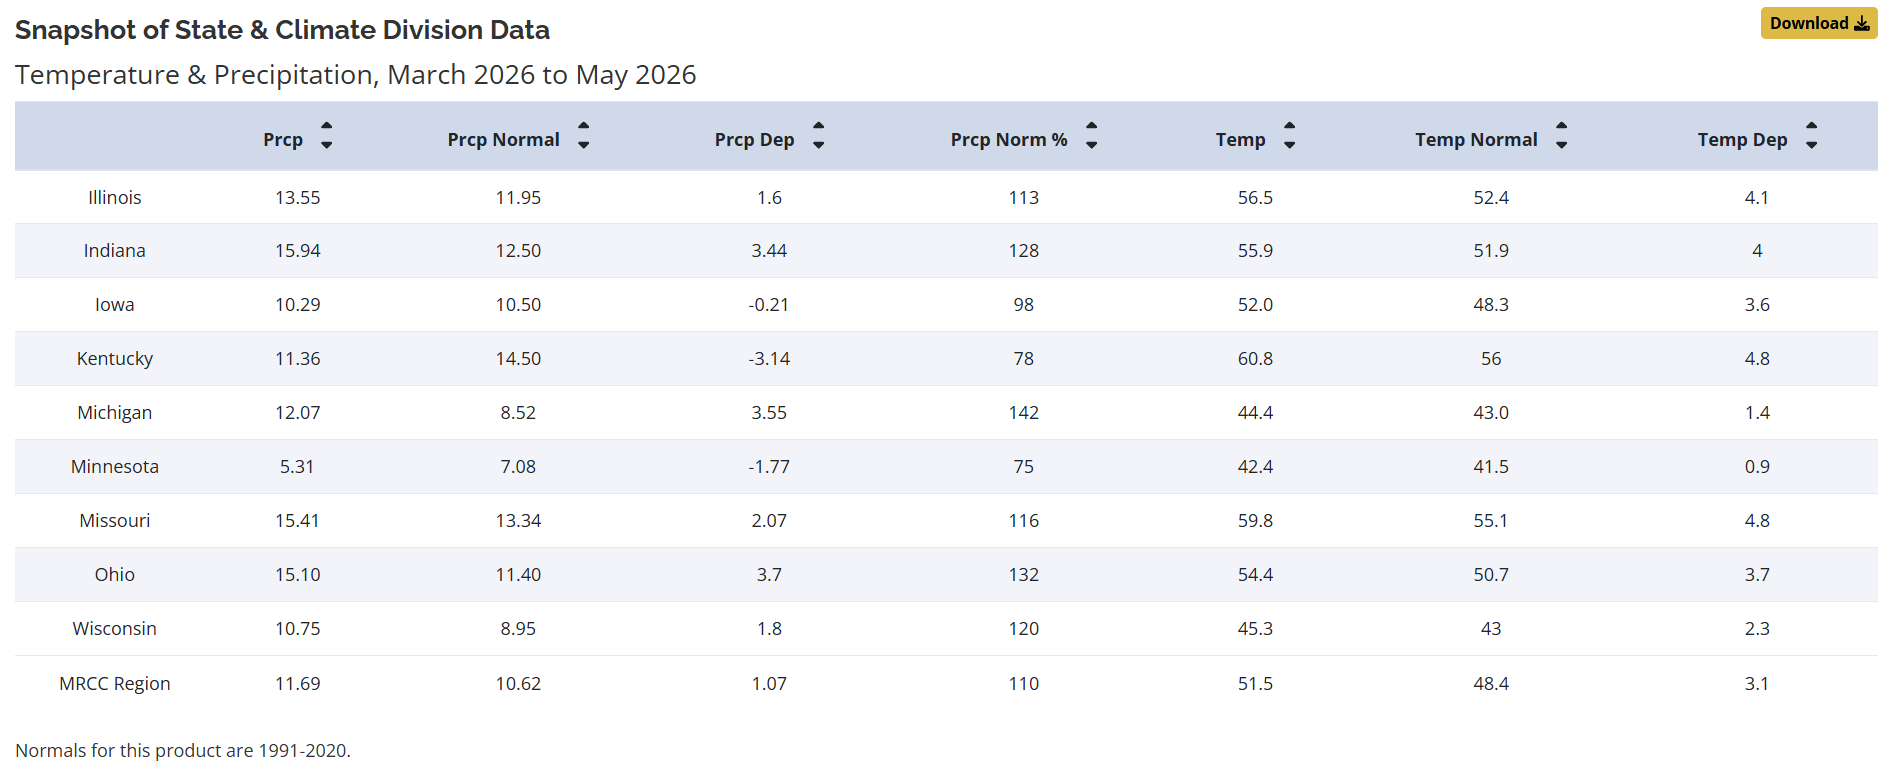
The average May temperature for the Midwest was 58.9°F, which was 0.8°F below the 1991–2020 normal (Figure 1). Monthly temperatures ranged from 1 to 3°F below average in the far upper Midwest and the eastern half of the region, with temperatures near to slightly above average in the western half of the region (Figure 2). Statewide average temperatures ranged from 0.9°F above normal in Iowa to 2.4°F below normal in Ohio. Overall, the month was split roughly in half, with below-normal temperatures dominating the region in the first half (Figure 3) and above-normal temperatures prevailing in the second half (Figure 4). As a result, monthly temperature rankings were unremarkable at the state and city levels across the region. Notably, though, areas across eastern Missouri and Kentucky briefly experienced freezing temperatures on May 3, after nearly six weeks above freezing, resulting in damage to crops and other plants that had advanced phenology due to a warm April (Figure 5). The Midwest's average spring (March–May) temperature was 3.1°F above normal (Figure 6). Final rankings indicate that spring 2026 was tied with spring 1985 for the 7th-warmest on record in the Midwest.
Precipitation
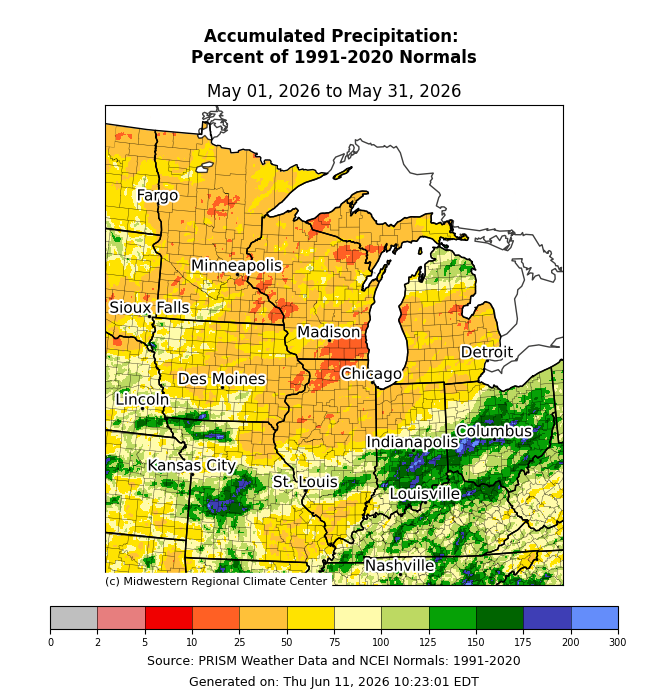
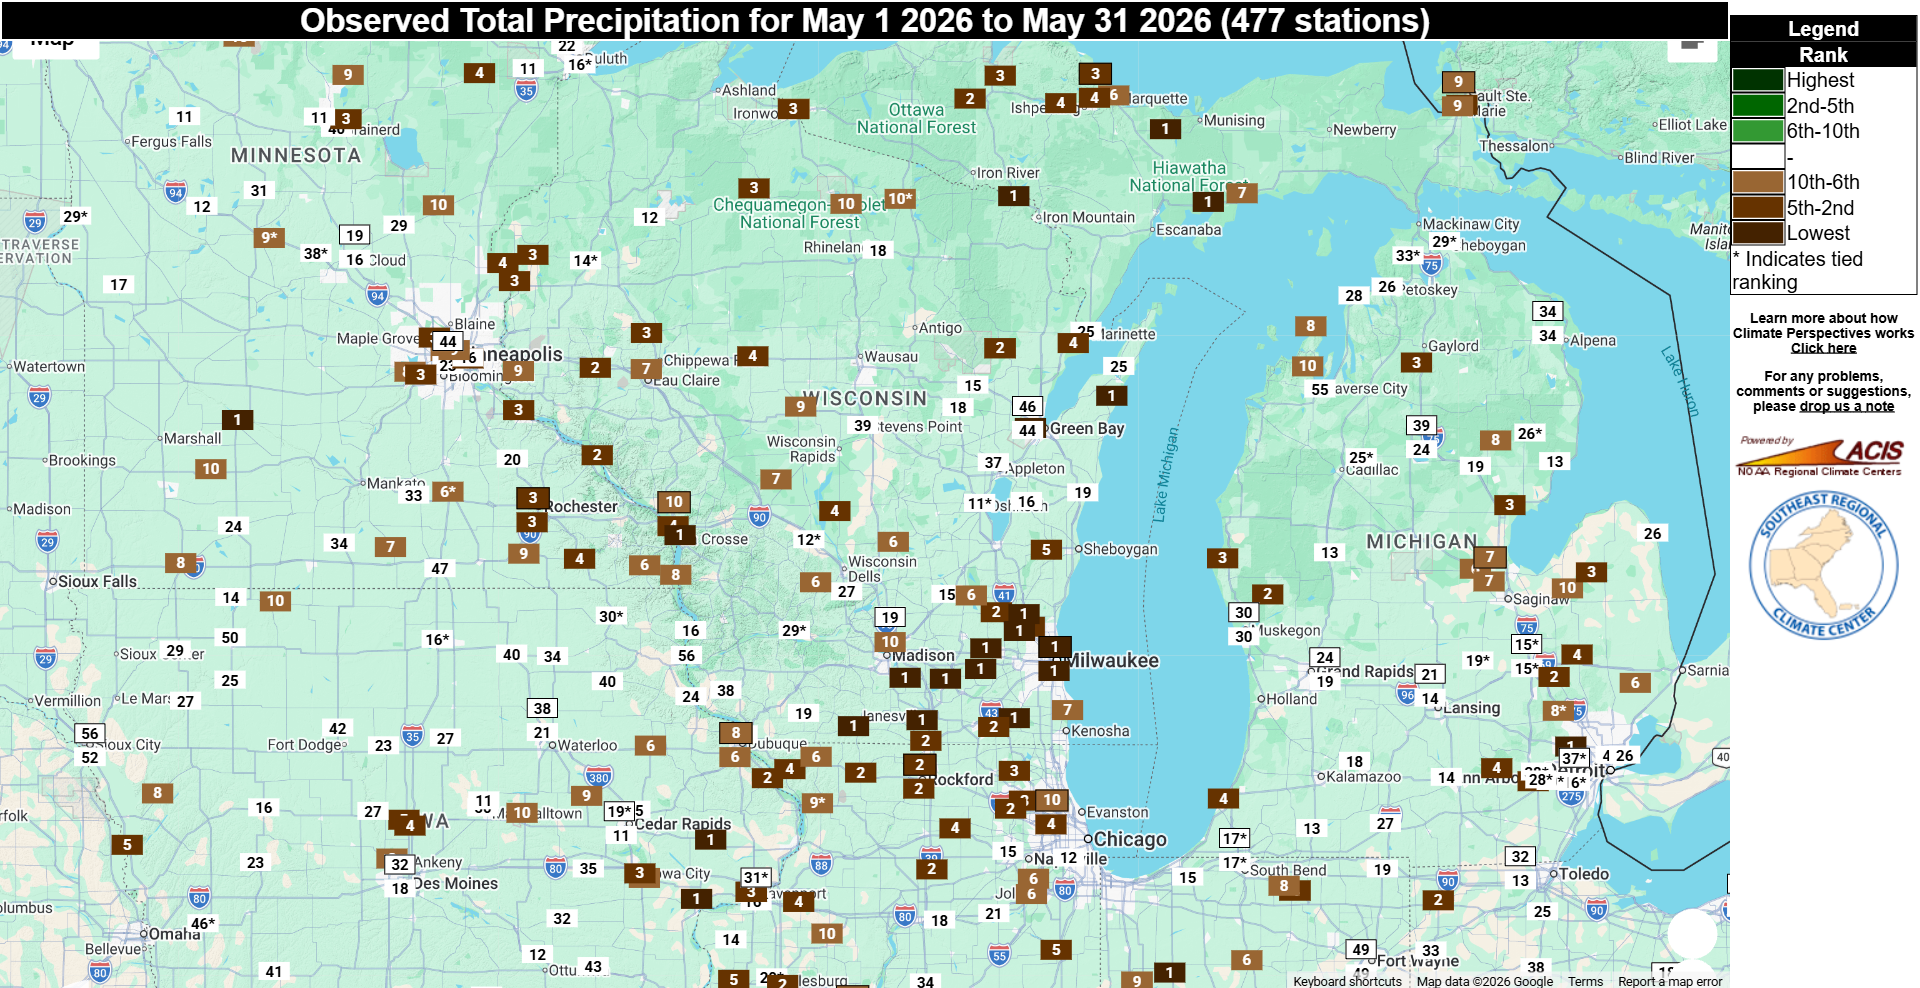
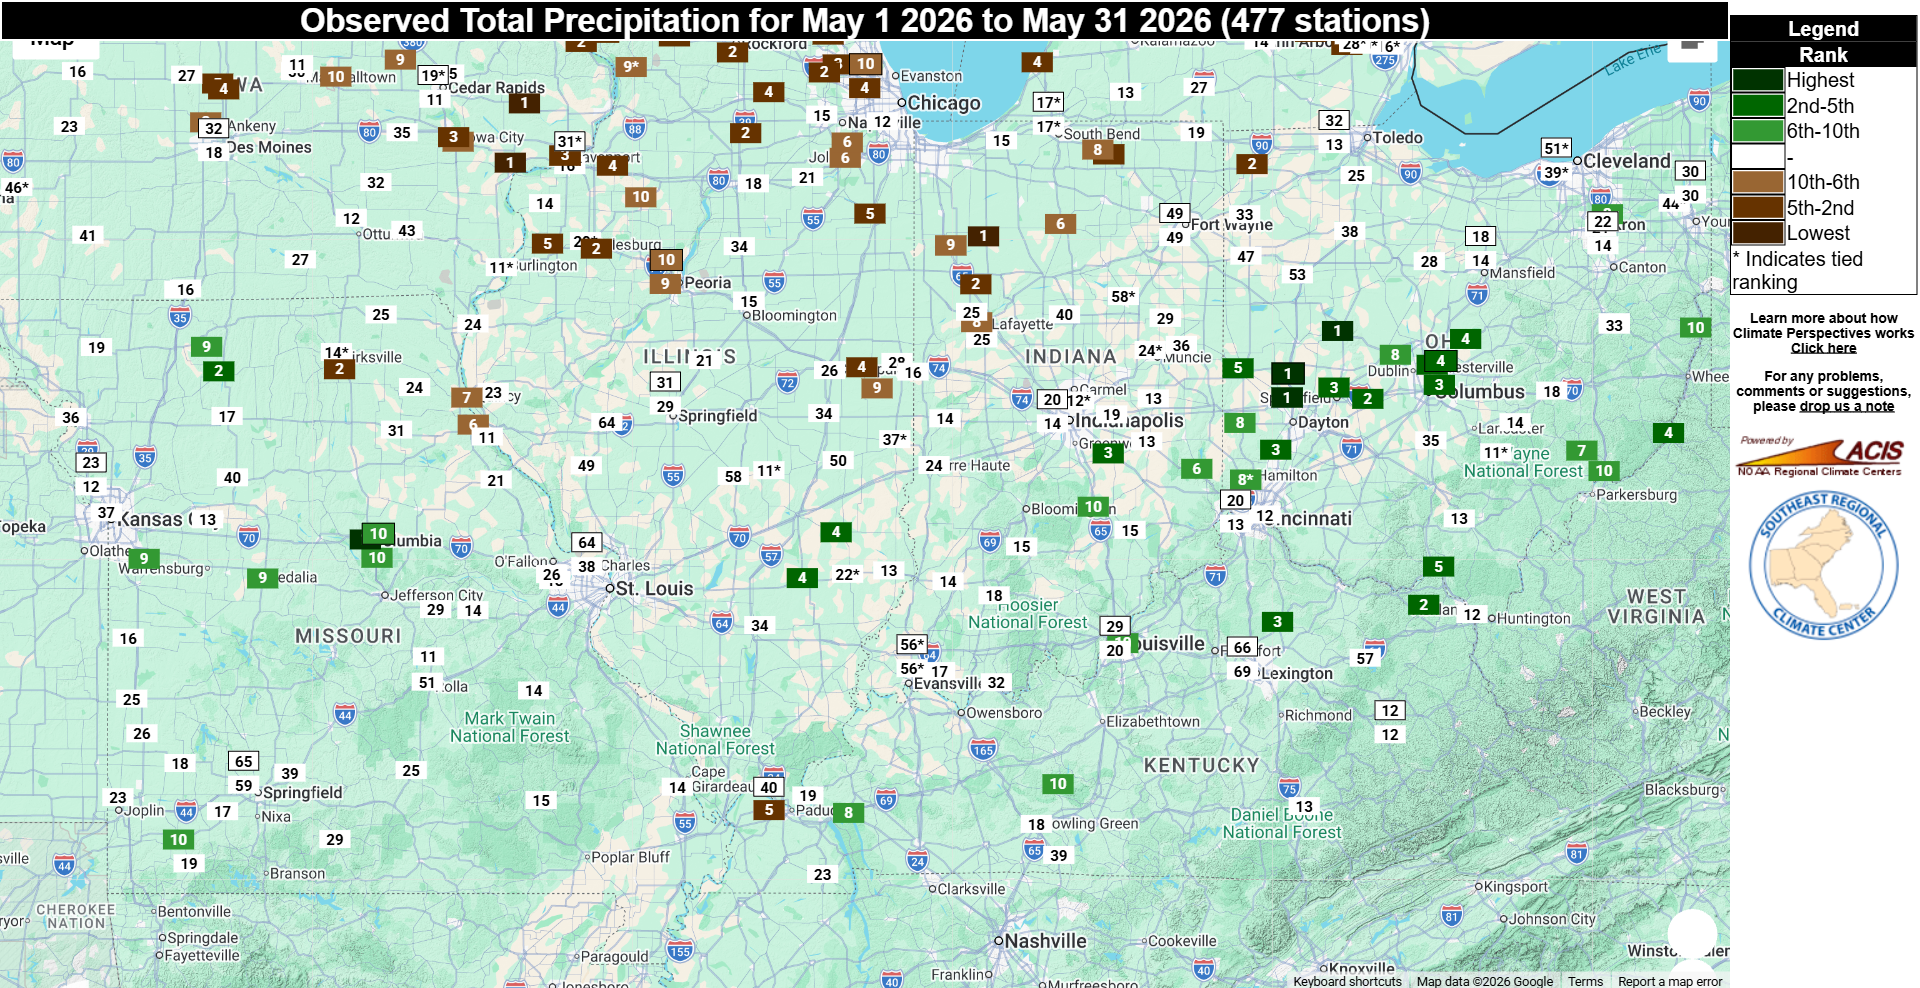
May precipitation totaled 3.13 inches in the Midwest, 1.25 inches below normal, or about 71 percent of normal (Figure 1). Precipitation was 10 to 50 percent of normal for most of the central and upper Midwest (Figure 7). Across the lower Midwest, conditions were variable, with totals 125 to 175 percent of normal in the western half of Missouri and across much of the Ohio River Valley, and a pocket of 25 to 75 percent of normal precipitation in the south-central Midwest. Statewide precipitation totals ranged from 1.07 inches above normal in Ohio to 2.32 inches below normal in Wisconsin. Final rankings indicate Wisconsin tied with 2023 for its 4th driest May on record. Numerous long-running weather stations across the upper Midwest had a top 10 driest May, including: Milwaukee, WI (driest in 155 years), Rockford, IL (2nd driest in 125 years), Rochester, MN (3rd driest in 112 years), Marquette, MI (6th driest in 146 years), and Chicago, IL (10th driest in 154 years) (Figure 8). Across the lower Midwest, the following cities had their wettest May: Dayton, OH (wettest in 133 years); Shelbyville, IN (3rd wettest in 115 years); Columbus, OH (4th wettest in 148 years); and Columbia, MO (10th wettest in 137 years) (Figure 9). Spring (March–May) precipitation for the Midwest totaled 11.69 inches, which was 1.07 inches above normal (Figure 6). Final rankings indicate that spring 2026 was the 21st wettest on record for the Midwest.
Drought
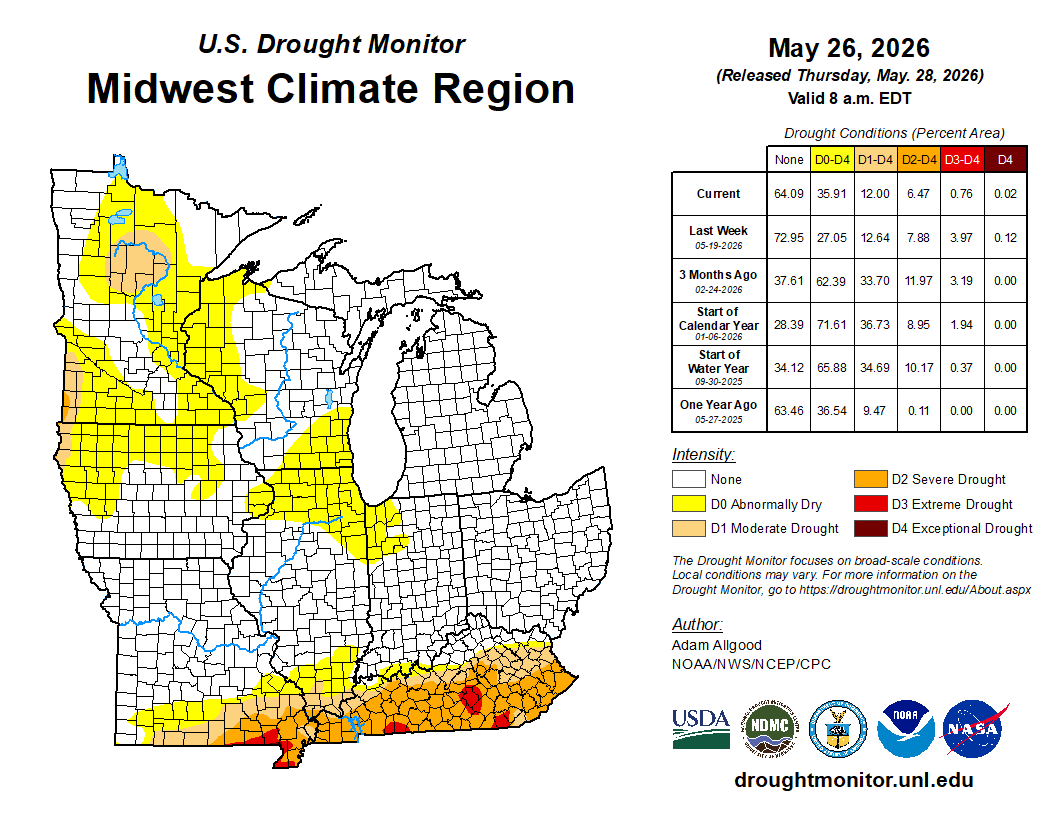
Drought coverage remained largely unchanged in May, with the worst conditions spanning the far lower Midwest (southeast Missouri, southern Illinois, and most of Kentucky) and isolated areas in Minnesota. Below-normal precipitation resulted in abnormal dryness across the northwest quadrant of the region. In total, about 36 percent of the Midwest was classified as abnormally dry or in drought on the U.S. Drought Monitor map at the end of May (Figure 10).