About Custom Chilling Hours Tool
Description
The Custom Chilling Hours Tool was developed by the Midwestern Regional Climate Center (MRCC) in collaboration with the USDA Midwest Climate Hub. It allows users to track chilling hour accumulation for locations across the United States using customized temperature thresholds and time periods. The tool can help answer questions such as:
- How many chilling hours accumulated from September 1, 2022, through March 31, 2023, at a selected location using temperature bounds of 32°F and 45°F? How does that total compare with previous seasons?
- On what date did the 2019–2020 season reach 500 chilling hours? Was that date earlier or later than in previous seasons?
- How does the chilling hour accumulation at a selected station compare with totals at other stations across the United States?
Definitions
- Lower Temperature Bound: The inclusive lower-bound temperature used to calculate chilling hour accumulation.
- Upper Temperature Bound: The inclusive upper-bound temperature used to calculate chilling hour accumulation.
- Accumulation Start Date: The first date in the chilling hour accumulation period.
- Accumulation End Date: The final date in the chilling hour accumulation period.
- Chilling Hour Accumulation: The number of hours during the selected period when the observed temperature was between the lower and upper temperature bounds, inclusive.
- Season: The year of the accumulation start date, regardless of whether the end date occurs in the same calendar year.
How to Use the Tool
Custom Chilling Hours Map
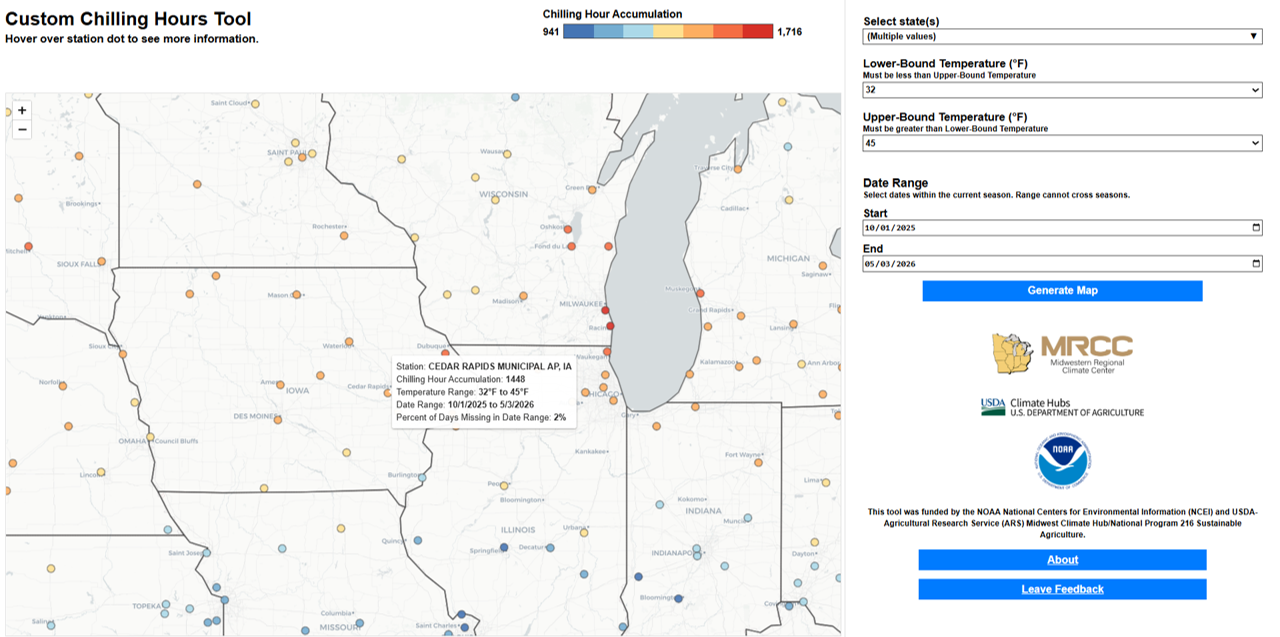
Each dot on the Chilling Hour Accumulation map represents a station with a high-quality record of hourly temperature observations. The dots are colored according to the chilling hour accumulation for the user-selected temperature bounds and dates. Hover over a dot to display the station name and the accumulation for the selected season.
Chilling Hour Accumulation Across All Seasons
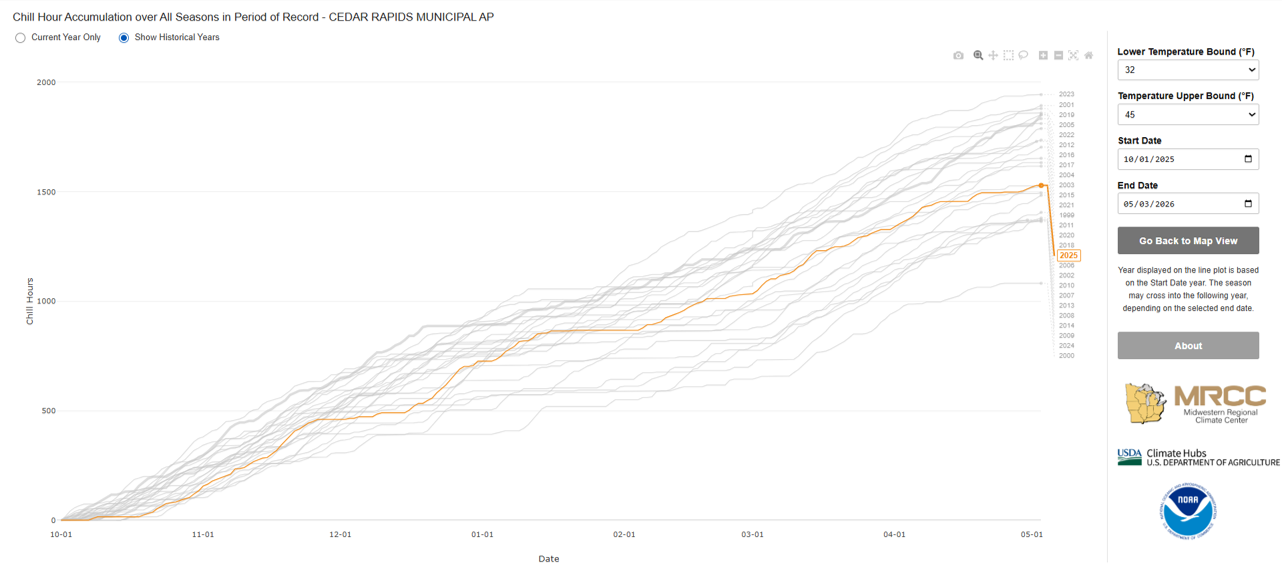
Select a location to view accumulated chilling hours for all available seasons. The selected season appears as an orange line. To compare it with historical years, select the Show Historical Years option. Previous seasons appear as gray lines. Hover over the chart to view season-specific details.
Considerations for Adjusting Temperature and Date Range
When adjusting the temperature threshold and date range, note the following requirements below. The map data will not display data if date or temperature selection rules are not followed.
Temperature Threshold- The lower temperature bound must be less than the upper temperature bound.
- The accumulation start date must be earlier than the accumulation end date.
- The accumulation end date must be no more than one year after the accumulation start date.
- Chilling hours are primarily accumulated during fall, winter, and spring. Therefore, the chilling hour accumulation period uses an October 1 to September 30 calendar scheme rather than a standard calendar year. Selected dates must be between Oct 1 of a selected year and September 30 of the following year, and the range cannot exceed a one-year period. For example, you CAN set the accumulation range from October 15, 2021 to February 20, 2022, but you CANNOT select the range from February 20, 2021 to October 15, 2021.
Data
Hourly temperature observations from U.S. stations in the Automated Surface Observing System (ASOS) and Automated Weather Observing System (AWOS) networks are obtained through the Applied Climate Information System (ACIS) web services. Records are available as far back as 1944. The tool uses these hourly observations to calculate chilling hour accumulation from the user-selected temperature bounds and dates.
Stations with excessive missing hourly temperature data are handled using the following criteria:
- If a station is missing more than three hourly observations on a given day (approximately 10% of the expected 24 observations) that day is excluded from the accumulation. A day is the 24-hour period from midnight to midnight in the station’s local time zone.
- If more than 10% of the days in a station’s period of record are missing under the first criterion, the station is not displayed on the Chilling Hour Accumulation map.
- For a station displayed on the map, a season is not shown on the historical accumulation chart if more than 10% of its days are missing.
Excessive Missing Data from the Mid-1960s Through the Early 1980s
Users may notice substantial amounts of missing data from the mid-1960s through the early 1980s across the United States. During this period, most hourly reporting stations recorded observations only once every three hours. Because that reporting frequency produces too much missing data for reliable chilling hour monitoring, those periods are unavailable in this tool.
Why Do People Care About Chilling Hours?
Many plants become dormant during the cool season. If that season is not cool enough for a sufficient length of time, many fruit-producing plants may have difficulty emerging from dormancy. Similar to growing degree-day units, which track temperatures above a selected threshold over time, chilling hours measure the length of exposure to temperatures favorable for dormancy.
Chilling Hour Requirements
Each type of fruit plant requires a different range of accumulated chilling hours for optimal productivity during the following growing season. Ideal temperature ranges may also differ by fruit type and variety.
| Fruit type | Required chilling hours |
|---|---|
| Almond | 500–600 |
| Apple | 400–1,000; low-chill varieties may require fewer |
| Apricot | 500–600 |
| Blackberry | 200–500 |
| Blueberry, Northern | 800 |
| Cherry | 700–800 |
| Chestnut | 400–500 |
| Citrus | 0 |
| Currant | 800–1,000 |
| Fig | 100–200 |
| Filbert | 800 |
| Gooseberry | 800–1,000 |
| Grape | 100+ |
| Kiwi | 600–800 |
| Mulberry | 400 |
| Peach | 600–800 |
| Pear, European | 600–800 |
| Pear, Japanese | 400–500 |
| Persimmon | 200–400 |
| Plum cot | 400 |
| Plum, European | 800–900 |
| Plum, Japanese | 300–500 |
| Pomegranate | 100–200 |
| Quince | 300–500 |
| Raspberries | 700–800 |
| Strawberry | 200–300 |
| Walnut | 600–700 |
Further Reading
- Chilling Hour Requirements for Fruit Crops, Mississippi State University Extension
- Chilling Hours/First Frost, Texas A&M AgriLife
- Winter Chill Brings Summer Fruit, Climate Central