Evapotranspiration and Water Balance Maps
Evapotranspiration (ET), Potential Evapotranspiration (PET), and Water Balance maps help illustrate current moisture conditions and atmospheric water demand. ET represents the actual water lost from the land through evaporation and plant transpiration, while PET represents the amount of water that could be lost if moisture were unlimited. Combined with precipitation, these products help identify moisture surplus or deficit, assess crop water demand, and monitor changing hydrologic and drought conditions.
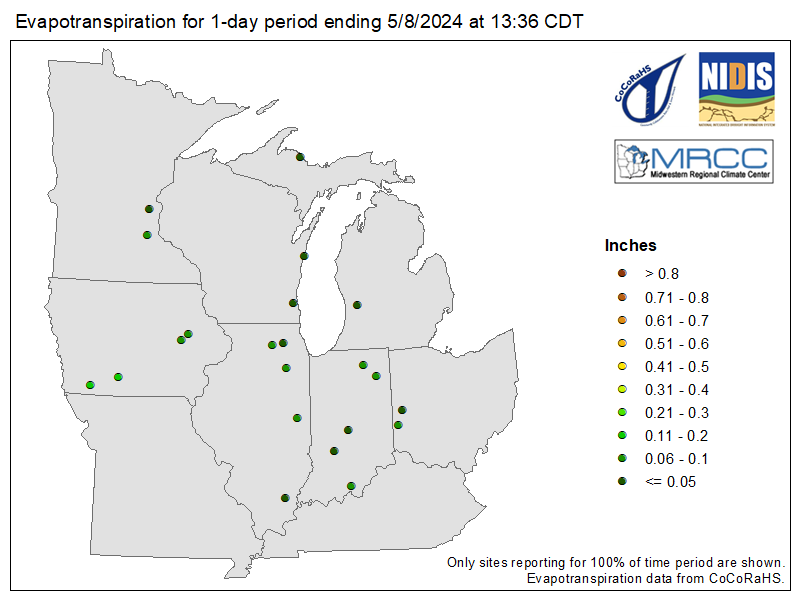
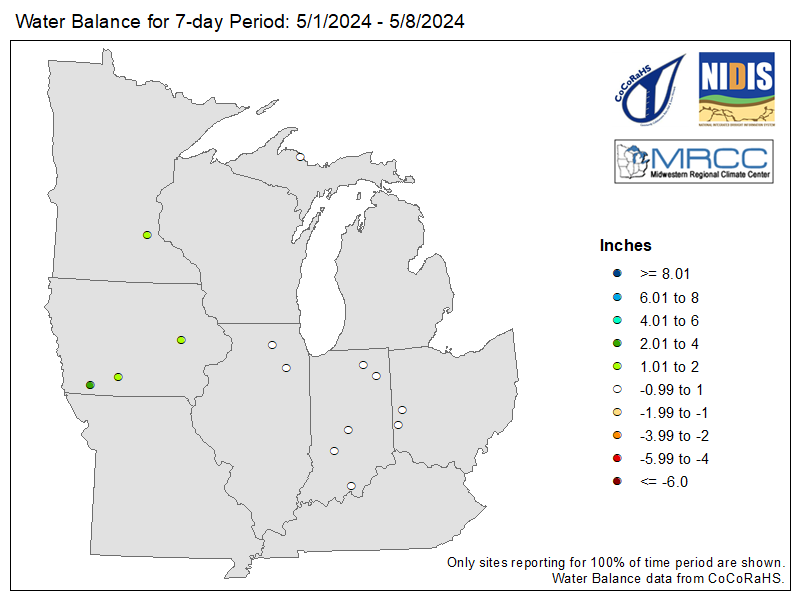
ET & Water Balance Maps
Evapotranspiration (ET) is water loss through evaporation and plant transpiration. ET maps utilize
CoCoRaHS ET data.
Water Balance compares precipitation to ET, helping identify moisture surplus or deficit. Water Balance maps utilize
CoCoRaHS Water Balance data.
Evapotranspiration
Water Balance
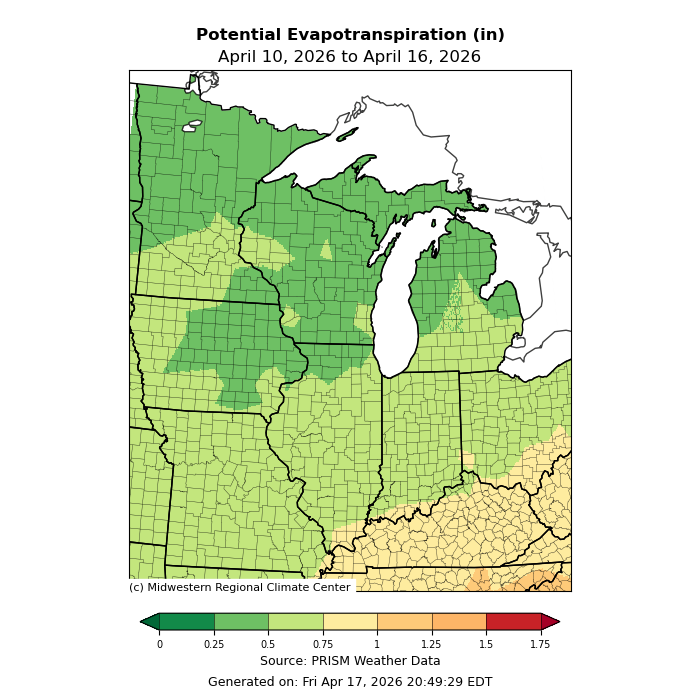
PET & Water Balance Maps
Potential Evapotranspiration (PET) estimates atmospheric water demand when moisture is available.
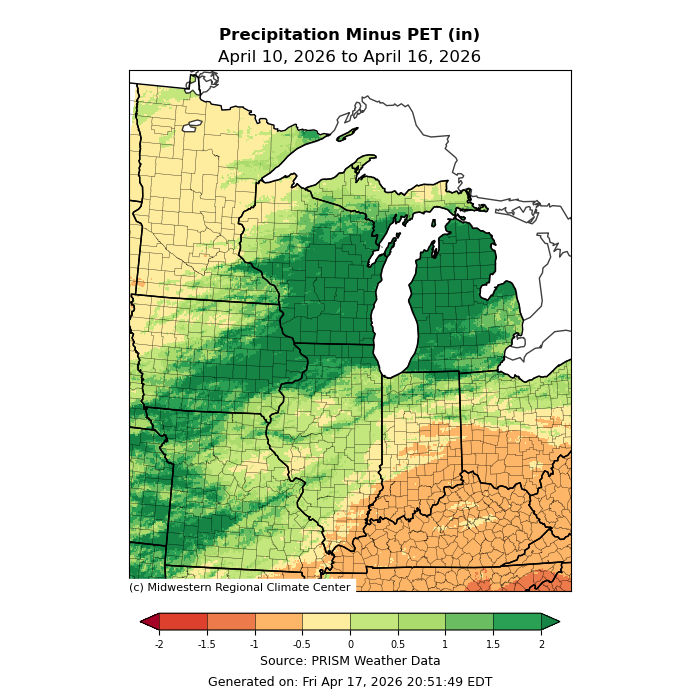
Water Balance, or precipitation minus PET, highlights areas where precipitation exceeds or falls short of atmospheric demand.
Data are obtained from the Northeast Regional Climate Center.
Potential Evapotranspiration
Water Balance
Mouse over or tab to a button to preview a map. Click a map to open the full-size image.