On the Road: MI - MRCC-NOAA Climate Services Workshop IL - Illinois Public Health
Assn. Annual Conference MI - Great Lakes
Adaptation Forum KY - Ohio River Basin
Association Summit
IL - Illinois Geographic
Info. Systems Assn.
The Importance of Soil Moisture Monitoring in the Midwest
Trent W. Ford, Assistant Professor, Southern Illinois University-Carbondale and
Steve M. Quiring, Professor, The Ohio State University
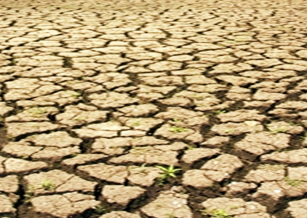
Soil moisture, the amount of water in the soil, is a great indicator of prolonged dryness, and is regarded as the key variable for agricultural drought. Accurate monitoring and prediction of drought events, particularly on weekly to monthly timescales, are vital for reducing societal vulnerability to drought via improving drought early warning and drought response. Soil moisture is a key source of information that helps to identify the onset and characterize the severity of agricultural drought because soil moisture is informed by both atmospheric contribution (i.e., precipitation) and extraction (i.e., evapotranspiration) of water, and is the central limiting factor for plant root water uptake. In-ground soil moisture observations in Illinois exhibited drought conditions several weeks prior to drought depiction by the U.S. Drought Monitor in 2012. Rapid soil moisture drawdown – driven by below normal precipitation and above normal air temperature – in March and April forewarned impending drought conditions heading into the summer 2012 season. This indicates that soil moisture observations provide value for drought monitoring and forecasting, particularly for rapid-intensification or “flash drought” events. In addition to its importance for drought monitoring, soil moisture is a key contributor to elevated temperature during heat waves. The warmer weather of the Midwest summer season causes elevated rates of plant root water uptake and evapotranspiration as natural and managed landscapes become more productive. If increased plant productivity is combined with precipitation deficiency, plant-extracted soil moisture will not be sufficiently replaced. Persistence of these conditions for weeks to months will desiccate the soil and help elevate air temperature. This land-atmosphere feedback is a key feature of heat waves in the Midwest, and soil moisture often contributes significantly to the persistence and intensity of Midwest heat waves, such as the summer 2012 event.
Top panel shows monthly-average (0-20") soil moisture anomalies in inches of water for April through July, 2012 in Illinois. The bottom panel shows the U.S. Drought Monitor Illinois drought map from the month following each soil moisture map. Soil moisture observations were obtained from the Water and Atmospheric Resources Monitoring Program (WARM, 2015)1. The U.S. Drought Monitor weekly maps are available at http://droughtmonitor.unl.edu/. (Svoboda et al. 2002)2
Despite the demonstrated value of soil moisture for early warning of drought and extreme heat, there are relatively few locations that directly measure soil moisture. For example, the state of Illinois contains 20 high-quality, operational weather stations that continuously monitor soil moisture; these stations are part of the Water and Atmospheric Resources Monitoring Program’s Illinois Climate Network (WARM ICN). This equates to one soil moisture monitoring station for every 2,900 square miles of Illinois land, and pales in comparison with the over 1,300 stations in Illinois continuously monitoring air temperature and precipitation (one every 44 square miles). The lack of direct measurements of soil moisture is not unique to Illinois. Many states in the Midwest have fewer than 10 locations that monitor soil moisture. This is particularly concerning for the Midwest region because of the importance of agriculture. Additionally, the existing soil moisture stations are operated by a variety of different agencies and organizations, often using different sensors and taking measurements at different depths. These data are not stored in a consistent format which poses significant challenges for accessing and using these data. In response to these challenges, the President’s 2013 Climate Action Plan called for the development of a coordinated national soil moisture network (NSMN). The NSMN serves to process and integrate soil moisture observations in real-time from a variety of in-ground data sources and make these datasets accessible at a single endpoint. Although the NSMN is still being developed, it has spurred the development of a variety of national soil moisture products. These products are updated on a daily basis and are based on hundreds of monitoring stations across the United States, including many in the Midwest. As a continuation of the NSMN, an ongoing NOAA-funded project is developing a high-resolution, near-real-time gridded soil moisture product that will leverage soil moisture data from in-ground measurements, satellite remote sensing, and land surface models. The resultant soil moisture products will help support drought monitoring and prediction capabilities through the generation of new and improved national soil moisture maps. Importantly, these blended in-ground/model/satellite datasets will help “fill the gaps” for soil moisture monitoring in states/regions that have few soil moisture monitoring stations. Beta versions of in-ground only soil moisture maps are available at nationalsoilmoisture.com.
Distribution of continuously-monitoring soil moisture stations across the United States. Data from many of these stations are available via the National Soil Moisture Network (NSMN)
The NSMN represents a great advancement of in-ground soil moisture data capacity and accessibility. However, the current dearth of in-ground soil moisture monitoring stations is still a significant problem for drought monitoring and prediction. Recent developments of new in-ground soil moisture monitoring networks, and federal- and state-level support for operational soil moisture monitoring and related research are encouraging; however, continued federal-, state-, and local-level support for soil moisture monitoring is crucial for the future success of the NSMN and new or existing soil moisture monitoring networks. Additionally, new sources of soil moisture information, such as soil moisture monitoring through the Community Collaborative Rain, Hail, & Snow (CoCoRaHS) Network could prove quite valuable for operational drought monitoring, particularly in regions not well-surveyed by federal- or state-level soil monitoring networks. Our capacity for in-ground soil moisture monitoring in the Midwest is underdeveloped. However, researchers, stakeholders, and elected officials at all levels of government have begun to better understand the importance of high-quality, timely soil moisture monitoring. We hope we can continue to advance our soil moisture monitoring infrastructure and further reduce the Midwest region’s vulnerability to drought and extreme heat.
1Water and Atmospheric Resources Monitoring Program. Illinois Climate Network. (2015). Illinois State Water Survey, 2204 Griffith Drive, Champaign, IL 61820-7495. http://dx.doi.org/10.13012/J8MW2F2Q.
2Svoboda, M., et al. (2002), The drought monitor. Bulletin of the American Meteorological Society, 83, 1181-1190.
Evapotranspiration and Water Balance Maps Available
Steve Hilberg, MRCC
Figure 1: Atmometer used to measure evapotransportation.
A recent addition to the MRCC web site are maps of measured evapotranspiration (ET) and calculated water balance for the Midwest and the U.S. These maps are compiled for periods of 7, 14, 30, and 60 days, and can be found in the Drought Information section of the Midwest Climate Watch.
The evapotranspiration measurements and the precipitation measurements used to calculate the water balance, are made by observers with the Community Collaborative Rain, Hail, and Snow network (CoCoRaHS). Observers measure "reference ET" using an atmometer.
Evapotranspiration is the water evaporated from the ground back to the atmosphere both as transpiration from the leaves of plants and also as direct evaporation from open water and soil. Reference Evapotranspiration is defined as "the ET from an extensive surface of clipped grass (ETo) or alfalfa (ETr) that is well-watered, and fully shades the ground." The atmometer used by CoCoRaHS observers has a canvas cover that simulates clipped grass. Measurements are taken once a day, usually in the morning at the same time precipitation measurements are made. These measurements are accumulated over the periods designated to produce the maps.
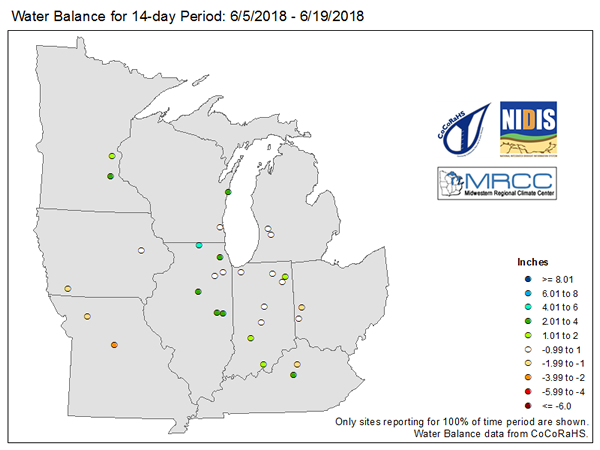
Water balance is the difference between the accumulated ET and the accumulated precipitation over a period. If ET exceeds precipitation then there is a negative water balance. When precipitation exceeds ET then there is a positive water balance. Changes and trends in water balance can be early indicators of changing drought status.
The ET and water balance maps are updated once a day, usually in late morning. You can view the actual ET data at https://www.cocorahs.org/ViewData/ListETReports.aspx
Map showing evapotranspiration for the 14-day period from June 5-19, 2019 for locations in the Midwest.
Map showing water Balance for the 14-day period from June 5-19, 2019 for locations in the Midwest.
For more information on this article, please contact Steve Hilberg via email
The Midwest finally got relief from consistently above-normal temperatures in mid-July. The region saw near-normal to below-normal temperatures in the third week of July. Across the central parts of the region, temperatures were 3-5°F below normal for July 18-24. The week was also busy with severe weather. On the 19th, 12 confirmed tornadoes touched down in Iowa, two of which were rated as EF-3 storms. Strong thunderstorm winds were reported across Missouri as well. On the 20th, the severe weather shifted further east with Indiana and Kentucky taking the brunt of the damage. There were numerous reports of hail at least 2" in diameter, and up to 4" near Tompkinsville, KY. Along with some weak tornadoes, thunderstorm winds toppled trees onto cars in Michigan City, IN and Norwood, OH with injuries in both cases.
Drought expanded in the Midwest this summer. The most persistent area has been in northern Missouri, southeastern Iowa, and a small corner of west-central Illinois which has had areas in drought since April and May. In July, drought has ramped up to the extreme level, covering about 15% of Missouri and a small part of Iowa. July has also seen moderate drought introduced to Michigan. See the Midwest Climate Watch pages for more …
Number of Days Since Last Precipitation maps - There are many factors that contribute to the development and magnitude of drought, with the most obvious being an extended period with a lack of precipitation. However, is it a complete lack of precipitation that is necessary? What if there has been some precipitation in recent days, but not a lot? The answers to these questions may vary depending upon the application and individual. Therefore, the MRCC has developed an operational tool that allows users to monitor how long it has been (in number of days) since the last 24-hour precipitation amount of either 0.01”, 0.10”, 0.25”, 0.50”, or 1.00”. By monitoring the information provided by these daily-updated maps, users can include that information when assessing the magnitude and duration of drought for their area.
This maps series can be found in the Midwest Climate Watch Drought Page, under the Precipitation Maps section. Also, an archives page for these maps is under development, and will be coming soon! You will be able to select maps by precipitation amount and date, then click forward and backwards through that type of map.
The Evaporative Demand Drought Index (EDDI) is an experimental drought monitoring and early warning guidance tool. It examines how anomalous the atmospheric evaporative demand (E0; also known as "the thirst of the atmosphere") is for a given location and across a time period of interest. EDDI is multi-scalar, meaning that this period—or "timescale"—can vary to capture drying dynamics that themselves operate at different timescales. EDDI maps are generated at 1-week through 12-month timescales.
EDDI can offer early warning of agricultural drought, hydrologic drought, and fire-weather risk by providing near-real-time information on the emergence or persistence of anomalous evaporative demand in a region. You can also access 1-week, 2-week, 1-month and 3-month EDDI maps for the Midwest region from the Drought Indices section of the Drought page in Midwest Climate Watch.
Ann Arbor, MI (Aug 21-23) – MRCC-NOAA Climate Services Workshop
Beth Hall, Leslie Stoecker, and Veronica Fall will be participating in this workshop geared toward Climate Focal Point (CFP) forecasters from 8 Weather Forecast Offices (WFOs) around the Great Lakes region. The workshop will share the various climate services partners and resources and learn more about climate services needs for the region.
Bloomington, IL (Sep 5) – Illinois Public Health Association Annual Conference
Beth Hall will be hosting an information booth about the MRCC and the National Integrated Drought Information System (NIDIS).
Ann Arbor, MI (Sep 24-26) – Great Lakes Adaptation Forum
Veronica Fall will be attending to learn about strategies and approaches to climate adaptation in an engaged learning program.
Crestview Hills, KY (Oct 17-19) – Ohio River Basin Association Summit
Beth Hall will be presenting about the Midwest Drought Early Warning System (MW DEWS) to raise awareness of drought preparedness for river basin navigation, tourism, and other issues.
Lisle, IL (October 22-23) – Illinois Geographic Information Systems Association
Zoe Zaloudek will be attending the 2018 Annual Conference of the Illinois Geographic Information Systems Association (ILGISA).
Email us your local climate impacts! We are constantly keeping a log of how climate is impacting
our region, and our information would not be complete with YOUR help!
Have something to share as a feature article in an upcoming The Climate Observer issue, or
interested in being contacted for an article interview? Please let us know!


 Soil moisture, the amount of water in the soil, is a great indicator of prolonged dryness, and is regarded as the key variable for agricultural drought. Accurate monitoring and prediction of drought events, particularly on weekly to monthly timescales, are vital for reducing societal vulnerability to drought via improving drought early warning and drought response. Soil moisture is a key source of information that helps to identify the onset and characterize the severity of agricultural drought because soil moisture is informed by both atmospheric contribution (i.e., precipitation) and extraction (i.e., evapotranspiration) of water, and is the central limiting factor for plant root water uptake. In-ground soil moisture observations in Illinois exhibited drought conditions several weeks prior to drought depiction by the U.S. Drought Monitor in 2012. Rapid soil moisture drawdown – driven by below normal precipitation and above normal air temperature – in March and April forewarned impending drought conditions heading into the summer 2012 season. This indicates that soil moisture observations provide value for drought monitoring and forecasting, particularly for rapid-intensification or “flash drought” events. In addition to its importance for drought monitoring, soil moisture is a key contributor to elevated temperature during heat waves. The warmer weather of the Midwest summer season causes elevated rates of plant root water uptake and evapotranspiration as natural and managed landscapes become more productive. If increased plant productivity is combined with precipitation deficiency, plant-extracted soil moisture will not be sufficiently replaced. Persistence of these conditions for weeks to months will desiccate the soil and help elevate air temperature. This land-atmosphere feedback is a key feature of heat waves in the Midwest, and soil moisture often contributes significantly to the persistence and intensity of Midwest heat waves, such as the summer 2012 event.
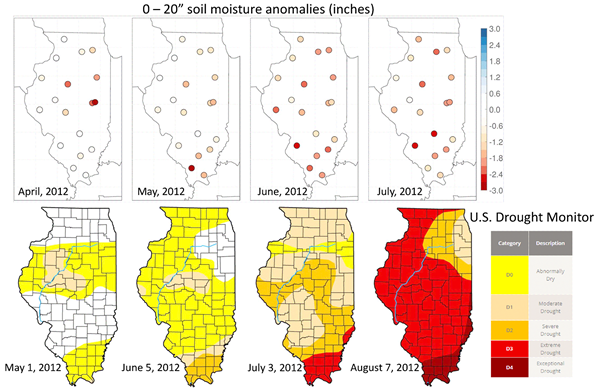
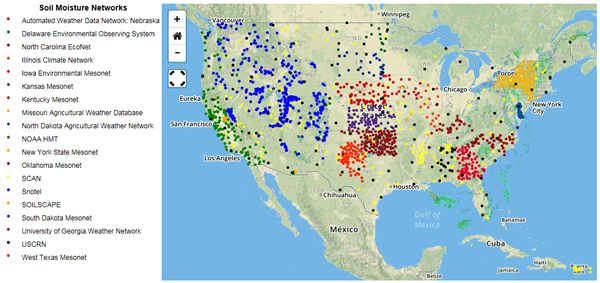
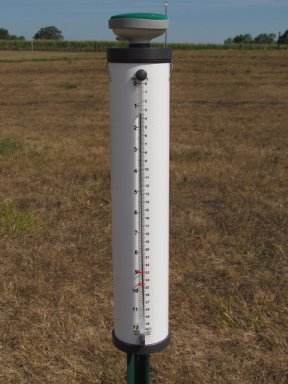 Figure 1: Atmometer used to measure evapotransportation.
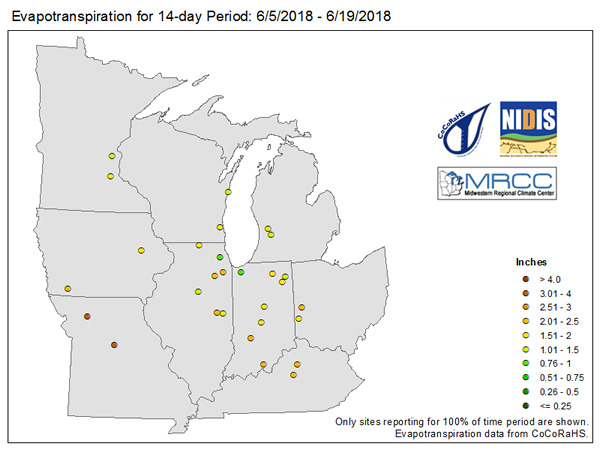
 The Midwest finally got relief from consistently above-normal temperatures in mid-July. The region saw near-normal to below-normal temperatures in the third week of July. Across the central parts of the region, temperatures were 3-5°F below normal for July 18-24. The week was also busy with severe weather. On the 19th, 12 confirmed tornadoes touched down in Iowa, two of which were rated as EF-3 storms. Strong thunderstorm winds were reported across Missouri as well. On the 20th, the severe weather shifted further east with Indiana and Kentucky taking the brunt of the damage. There were numerous reports of hail at least 2" in diameter, and up to 4" near Tompkinsville, KY. Along with some weak tornadoes, thunderstorm winds toppled trees onto cars in Michigan City, IN and Norwood, OH with injuries in both cases.
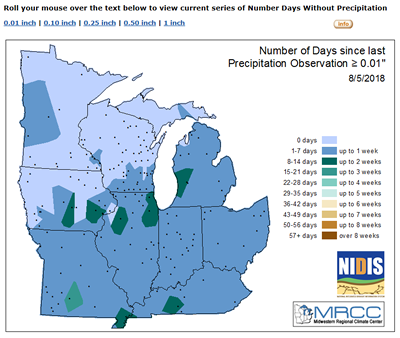 Number of Days Since Last Precipitation maps - There are many factors that contribute to the development and magnitude of drought, with the most obvious being an extended period with a lack of precipitation. However, is it a complete lack of precipitation that is necessary? What if there has been some precipitation in recent days, but not a lot? The answers to these questions may vary depending upon the application and individual. Therefore, the MRCC has developed an operational tool that allows users to monitor how long it has been (in number of days) since the last 24-hour precipitation amount of either 0.01”, 0.10”, 0.25”, 0.50”, or 1.00”. By monitoring the information provided by these daily-updated maps, users can include that information when assessing the magnitude and duration of drought for their area.
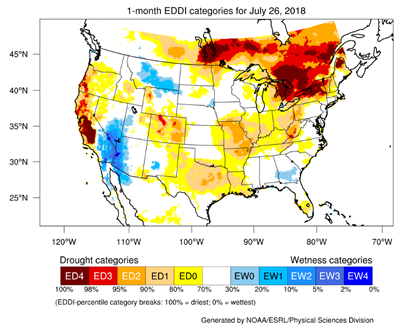
 Ann Arbor, MI (Aug 21-23) – MRCC-NOAA Climate Services Workshop