On the Road: MO - Vegetable Growers
Field Day IL - MRCC/NWS Climate
Services Workshop IL - Building Resilience
to Climate Change IL - Illinois GIS Assn.
Annual Conference OR - Sea Grant Academy
Monitoring the Demand Side of Drought with EDDI and ESI
Dan McEvoy, WRCC and Christopher Hain, NASA
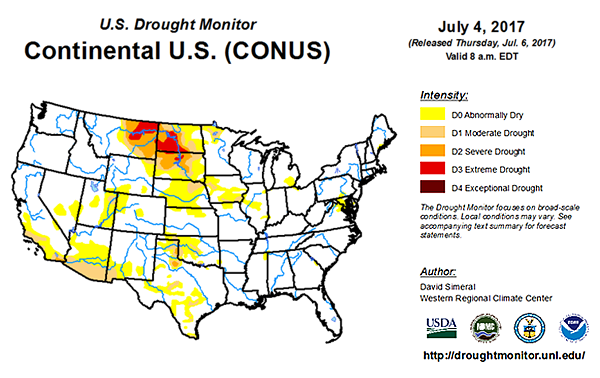
Drought is commonly thought of as moisture deficits manifested through a lack of precipitation. This is one side of the drought equation (supply), and the other side (demand) considers loss of water from the surface to the atmosphere through evaporative demand (E0) or actual evapotranspiration (ET). E0 is the “thirst of the atmosphere” estimated by the amount of water that would evaporate from the soil and be transpired by plants if the soil were well watered, while ET is the actual flux of water vapor from the land surface to the atmosphere. Two drought indicators, the Evaporative Demand Drought Index (EDDI) and the Evaporative Stress Index (ESI), will be described and will be used to highlight the recent evolution of the Northern Plains “flash” drought (Figures 1 and 2).
Figure 1: The U.S. Drought Monitor from July 4th, 2017 highlights a large region of extreme drought (D3), covering portions of Montana, North Dakota, and South Dakota.
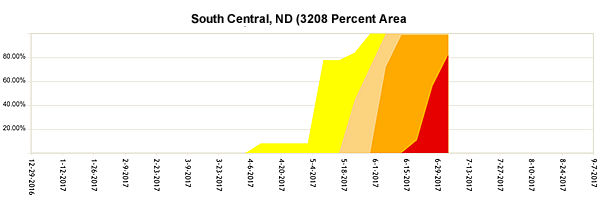
Figure 2: Time series of the percent area of the South Central North Dakota climate division in each U.S. Drought Monitor category. Note the rapid increase in spatial extent and severity of the drought from early May to early July. This rapid onset is known as “flash” drought.
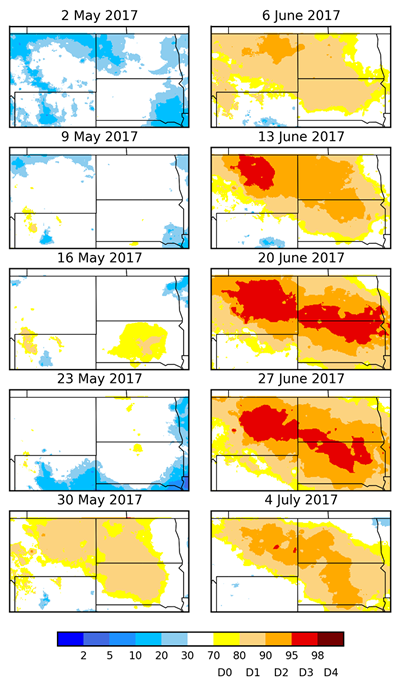
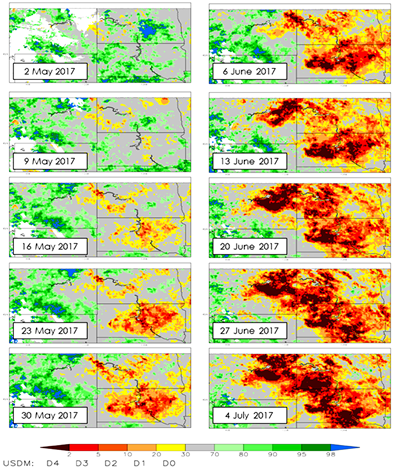
Figure 3: Evolution of the 1-month EDDI percentiles over eastern Montana, North Dakota, and South Dakota from May 2, 2017 through July 4, 2017. EDDI values have been converted to U.S. Drought Monitor percentile classes and reflect severity classes shown in Figure 1.
Evaporative
Demand Drought
Index
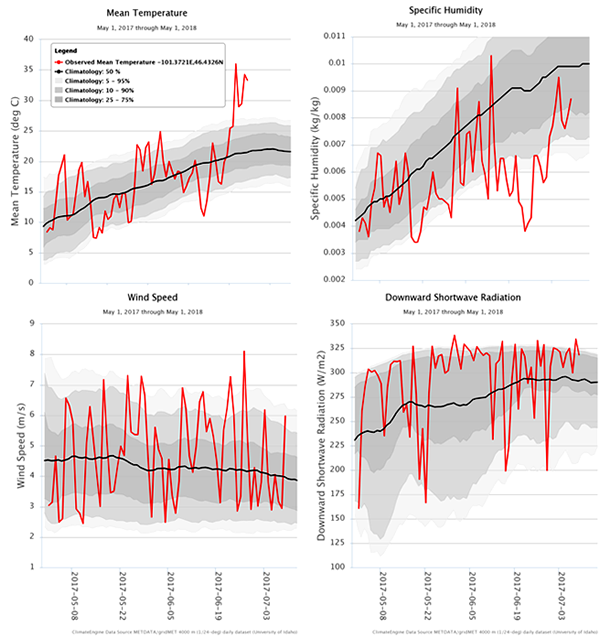
The EDDI uses E0 anomalies across a time-window of interest relative to its climatology to indicate the spatial extent and severity of drought. A strong physical relationship exists between E0 and ET. At the onset of drought, or during rapidly evolving “flash” droughts, E0 will often increase first and cause a rise in ET until surface moisture has been depleted. This is followed by decreasing ET, depletion of soil moisture, and often vegetative stress on the ground (which can be seen using ESI) while E0 continues to increase during the extended drought. EDDI is calculated using a physically-based E0 model driven by gridded weather data inputs of daily temperature, humidity, wind speed, and incoming shortwave solar radiation. Positive EDDI values (brown and red shading, Figure 3) indicate a “thirsty” atmosphere, and the potential for drought development (if not already in a drought), driven by some combination of high temperatures, low humidity, increased wind speeds, and few clouds (see Figure 4 for recent evolution of E0 drivers in south-central North Dakota).
Figure 4: (CLICK IMAGE FOR LARGE PDF VERSION) Evolution of mean temperature (top left), specific humidity (top right), wind speed (bottom left), and downward shortwave radiation (bottom left) from May 1 through July 9 for a point in south-central North Dakota (-101.37 W, 46.43 N). Red lines show the daily values, black line show the climatological mean (1981-2010), and grey shading denotes different percentile ranges from 25-75% (darkest grey) to 5-95% (lightest grey). Note extended periods of temperature, wind speed, and solar radiation all above the 75th percentile (%) line (occasionally exceeding 95%), and specific humidity below the 25th percentile (%) line (with an extended period below 5% in late June). Graphics generated using Climate Engine: http://clim-engine.appspot.com/
Evaporative Stress Index
Figure 5a: Evolution of the 1-month ESI percentiles over eastern Montana, North Dakota, and South Dakota from May 2, 2017 through July 4, 2017. ESI values have been converted to U.S. Drought Monitor percentile classes and reflect severity classes shown in Figure 1.
The ESI is based on satellite observations of land surface temperature which are used to estimate water loss due to ET. Generally, healthy green vegetation with access to an adequate supply of water warms much slower than vegetation that is dry and/or stressed. The ESI describes how the current rate of ET compares to normal conditions in terms of an anomaly (or departure from normal). Negative ESI values (brown and red shading, Figure 5a) show below normal ET rates, or vegetation that is showing significant soil moisture stress. Importantly, the ESI describes the current soil moisture status across the landscape without any use of observed precipitation data. This is important in regions of the world where sufficient ground-based observations of precipitation are not available. The ESI also demonstrates capability for capturing early signals of “flash drought”, brought on by extended periods of hot, dry and windy conditions leading to rapid soil moisture depletion. Reduced rates of water loss can be observed through the use of land surface temperature before it can be observed through decreases in vegetation health or “greenness”.
ESI/EDDI “Synergy”
The availability of EDDI and ESI datasets will provide an exciting opportunity to monitor the potential for development and onset of vegetation stress, especially in the case of flash drought. While EDDI focuses on relating atmospheric demand to developing drought conditions and highlighting the “potential” for vegetation stress, ESI provides the physical observation of the onset of vegetation stress based on the relationships between soil moisture and ET. Therefore, EDDI and ESI when employed together can be used to monitor the early evolution of drought. EDDI provides the earliest opportunity to denote regions of interest to “watch” for the development of vegetation stress, as increased demand precedes the development of actual vegetation stress, while ESI can provide a “warning” that vegetation stress has developed.
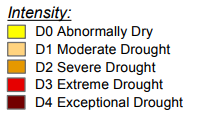
Figure 6: Hay field in poor condition outside of Richardton, N.D. in early June, 2017. All of North Dakota and large areas of South Dakota and Montana are abnormally dry or in drought conditions, leading ranchers to sell off cattle to make up for low feed supplies. (Jenny Schlecht/Agweek, http://www.agweek.com/news/nation-and-world/4280417-drought-conditions-lead-herd-trimming)
Evolution of the 2017 Northern Plains Drought
Figure 5b: U.S. Drought Monitor
intensity scale.
In early May, most of the region showed normal to above-average ESI and below-average EDDI values, in particular, only small sections of eastern Montana and western South Dakota showed ESI percentiles below 30% (consistent with D0, Figure 5b) (Figures 3 and 5a show the evolution of the 2017 Northern Plains drought discussed here). However, by mid-May, a rapid development of vegetation stress started to be observed in central South Dakota and began to develop across sections of North Dakota and northeastern Montana (ESI generally in the 5 to 30% range). Increased E0 begins to show up first in mid-May in much of central South Dakota with EDDI values in the 70 to 90% range (consistent with D0 and D1). A rapid expansion in North Dakota and the eastern half of Montana of EDDI values in the D0 and D1 range occurred at the end of May. This early warning drought potential signal in EDDI shown at the end of May, particularly in the eastern half of Montana, preceded the vegetative stress and soil moisture depletion shown by ESI beginning around mid-June. The month of June saw continued deterioration and expansion of increased E0 and vegetation stress, with much of the region experiencing ESI percentile values between 2 and 30% and EDDI percentile values between 80 and 98%. The latest ESI and EDDI maps (4 July 2017) shows a belt of ESI percentiles less the 2% (consistent with D4 conditions) across central South Dakota, southwestern North Dakota and eastern Montana with a general decrease in EDDI out of the D3 categories (95 to 98%). Drought impacts ranging from poor crop conditions and increased sale of cattle due to low feed supplies, to increased wildfire activity have been reported throughout June and continue into July (Figures 6 and 7).
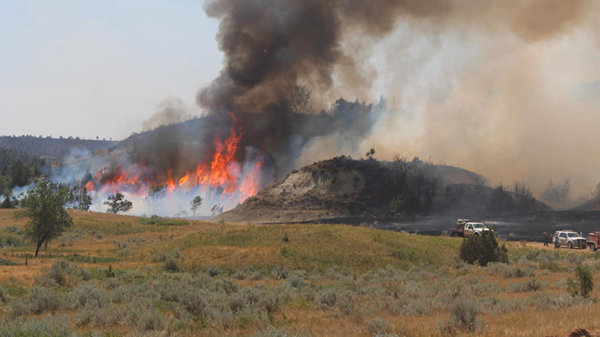
Figure 1: Summary of water levels on the Great Lakes at the end of May 2017 compared to average and last year (two left columns) and the change of water levels since March 1, 2017 compared to average (two right columns)
At the end of May, Lake Ontario’s water level was 32 in (82 cm) above average, which is the highest it has been since records began in 1918. Lake Erie was also close to reaching its all-time high water level, and all of the other lakes were at least 8.7 in (22 cm) above average and higher than they have been since at least 1998 (Figure 1). The high water levels have led to widespread flooding and erosion, particularly along the Lake Ontario shoreline. In addition, the high water levels and subsequent flooding has led to other impacts on water quality, navigation, infrastructure, and tourism and recreation.
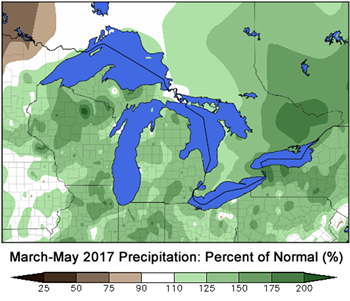
Figure 2: Percent of Normal Precipitation for the
March-May 2017 periods.
The high water levels this spring were primarily driven by very wet conditions across the Great Lakes basin this spring (Figure 2). In addition, the above-normal spring precipitation followed a wet winter in the basin. This spring, the overall basin received 152% of its normal precipitation in April and 120% of normal in May, while March had near-normal precipitation of 103% of normal. In the Lake Ontario basin, which saw the most notable rise in water levels and resulting impacts, over 4 trillion gallons of rainwater flowed into the lake during this time and the basin had its wettest May since 1900.
High Water Level Impacts
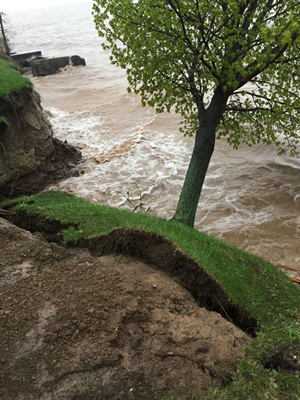
Figure 3: Erosion in Lyndonville, NY
(Photo by Alicia Bonanza)
Coastal Flooding and Erosion
High water levels on the Great Lakes and adjacent lakes and streams, combined with the frequent bouts of heavy precipitation, caused significant flooding and erosion damage around the Great Lakes, particularly Lake Ontario (Figures 3 and 4). Clean-up costs and infrastructure damages in Hamilton, Ontario totaled over $2.5 million. In New York and Ontario, residents were evacuated and over one million sandbags were used to protect shoreline property and infrastructure from rising waters and coastal flooding. A main road to Sodus Point, New York was inaccessible for several weeks. However, the community’s effort to remove water on that and other roads via water pumps, discharge intake sealing, and sandbagging was relatively successful. The inundation of roads became manageable and businesses were able to remain open. In some places, high winds amplified flooding and erosion issues.
Figure 4: Flooding in Oswego County, NY on May 15, 2017 (Photo by Cathy Goodnough)
Water Quality
The heavy rainfall events and high water levels forced the release of untreated water into Lake Ontario in order to mitigate flooding. There were reports in early May that the Toronto Harbour had E. Coli levels that were 16 to 30 times the safe amount for human contact or boating.
Navigation
Due to the high water levels, the Lake Ontario St. Lawrence River Board increased outflows from Lake Ontario to help alleviate flooding in this region, which created higher velocities in the shipping channels and increased the need for safety precautions by shipping.
Recreation and Tourism
The high water levels significantly reduced beach access around Lake Ontario and submerged docks and launches at marinas, which will continue to impact tourism and recreation this summer (Figure 5).
Figure 5: Dock in Sodus Bay, New York on April 17, 2017 (left) vs May 12, 2017 (right).
(Photo provided by Mary Austerman, New York Sea Grant).
Current Water Levels and Outlook
Typically, water levels in the Great Lakes peak in the summer months before beginning to decline in late summer as water supplies to the lakes tend to decrease. After receiving record high water supplies in May, Lake Ontario peaked at a record high level at the end of May. Since then, Lake Ontario water levels have generally been declining. Assuming average water supply conditions, this gradual decline is expected to continue into the fall. Lakes Superior, Michigan-Huron and Erie have more closely followed the typical seasonal pattern of peaking in the summer.
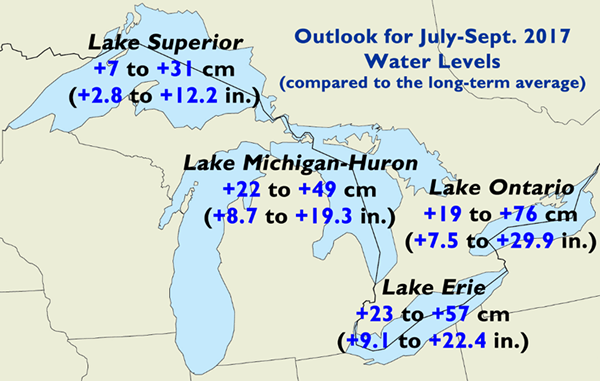
Even with the seasonal decline, all lakes are estimated to stay well-above average levels through the summer, even if dry conditions occur (Figure 6). For a full recap of water levels during the summer of 2017 (June-August), subscribe to receive the September 2017 Great Lakes Quarterly Climate Impacts and Outlooks report.
Figure 6: Potential range for water levels for July-September 2017 compared to the long-term average (1918-2016).
Resources
To keep up to date on the Great Lakes water levels, or find out more about historical water levels, check out these resources:
Released every quarter, the 2-page Great Lakes Climate Impacts and Outlook report provides a summary of the water levels. Subscribe here to receive it in your email inbox every March, June, September, and December.
In the President’s Fiscal Year 2018 federal budget submitted to Congress, program funding for the Regional Climate Centers (RCC) was reduced by 82%. With this reduced level of funding, the RCCs will not be able to continue to support operational services that we have been developing and providing for over 30 years. This would severely impair — and likely end — our ability to respond to customer phone requests, collect current weather and climate information, and provide an active website that includes value-added climate information and products.
Unless contract funding is restored by Congressional action, the RCCs will no longer be able to support operational services after our current funding ends on March 6, 2018. There are three different ways you can help the MRCC and the entire RCC Program:
Sign an online petition that says you support the effort to restore full funding to the RCC program. https://dataforms.lsu.edu/mrcc
Submit a testimonial of how you have used RCC services , or how using federal tax dollars to continue support for this program that provides climate information to everyone is of value. https://dataforms.lsu.edu/mrcc
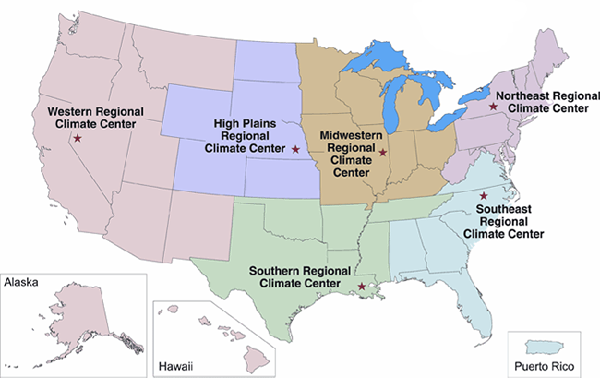
About the RCC Program:
The Regional Climate Centers produce and deliver climate data, information, and knowledge for decision-makers and other users at the local, state, regional, and national levels.
Located at major research institutions, RCCs are designed to respond quickly to emerging issues, such as droughts and floods. The RCCs annually respond to millions of requests for data and information from citizens, state and federal agencies, and weather-sensitive businesses (e.g., agriculture, transportation, risk management), especially through RCC online data systems. Information is tailored to specific regional needs.
The RCC Program is a federal-state cooperative effort that provides day-to-day climate services to a wide range of users, including government agencies, businesses and farmers. Recent funding was used to provide enhanced region- and sector-specific response and monitoring of extreme events such as severe coastal storms and droughts, the development of tools, special climate analyses and blended data sets allowing cross-border climate monitoring, and new product development.
The RCC program works collaboratively to ensure that broad national comprehensive data and information, products, and services are available to public and private sector users at the local, state, regional, and Federal levels.
The RCCs deliver science-based, high-value climate information to aid decision-makers dealing with the climate impacts on water supplies, wildfires, public health, agriculture, energy, infrastructure and disaster management planning.
The federal government spent nearly $100 billion in 2012 because of droughts, storms, floods, and forest fires. The RCCs provide valuable climate services to help decision-makers better prepare for these impacts and minimize losses due to these climate-related events.
Impact of funding cut at the MRCC
An 82% cut would reduce funding to an insufficient amount needed to support staff and infrastructure costs to keep an RCC operating.
A funding cut of this magnitude could cause the following:
Loss of 9 jobs at the MRCC.
Shutdown of MRCC’s website. Tools and resources that would longer be maintained and/or available include:
MRCC’s Application Tools Environment (cli-MATE) – the online data and customizable tools portal that has over 7500 registered users and over 100,000 data products run per year.
The Midwest Climate Watch, which provides operational monitoring maps of data across the Midwest with weekly and monthly climate summaries. In addition to thematic pages on agriculture, drought, and the Great Lakes.
The Vegetation Impact Program (VIP), which fosters collaboration between NWS forecast offices, state climate offices, and vegetation stakeholders and provides operational monitoring of atmospheric conditions pertinent to vegetation health and risk.
The Regional Mesonet Program (RMP) partnership, which includes daily operational maps of soil temperature and potential evapotranspiration based upon data from multiple states’ mesonet programs.
Winter monitoring resources, including the Accumulated Winter Season Severity Index (AWSSI) and the Snowfall Totals Climatology.
Closing the MRCC Climate Service Office that has been manned full-time for several decades to answer phone call, emails, and fax requests for specific climate information.
Loss of operational monitoring resources and customizable climate data tools for state climatologists. Most state climate offices utilize and rely on the online tools and services provided by RCCs to better communicate climate conditions, extremes, and variability to the public.
Loss of numerous other tools and services–including graphs and maps of climate data, data summaries at a variety of timescales, and tools to evaluate thresholds and extremes – that reduce the workload of all climate data users, a loss which would require users to do their own time- and money-consuming calculations and analysis of the raw climate data.
Loss of personnel resources to collaborate with other government programs (NOAA Sea Grant, NOAA National Integrated Drought Information System), National Weather Service, NOAA Regional Integrated Science and Assessments) that depend upon MRCC data, tools, and climate science expertise to provide support that helps advance climate preparedness and resilience across the Midwest.
Shutdown of the Climate Data Access Portal (cli-DAP) that ingests and makes available daily and sub-daily data for stakeholder access and value-added climate monitoring and assessment products.
Loss of all public, state and federal agency personnel’s access to more than 100 years of historical daily and hourly weather and climate data housed at MRCC.
Loss of access to quality controlled 19th Century daily weather data from more than 350 stations across the United States , critical for researchers to study the impact on climate on agricultural and economic development of the US.
Halt the collaboration between Midwestern mesonet programs that provide specialized maps of soil temperature and potential evapotranspiration critical to the agricultural sector.
Loss of access to the BI-National Precipitation Tool, a merged product of the Canadian and US Multi-sensor Precipitation Analyses, which provides the most accurate combined precipitation analysis available. In addition and very importantly, improved precipitation estimates for the Great Lakes, publically available to all users in both countries.
Would we want to mention the Tornado Tracks Tool? It is such a popular tool – maybe: “Loss of the Tornado Tracks Tool, which provides an interactive online interface to view historical tornado information for the entire United States from the Storm Prediction Center.
Shut down of West Nile virus summer time prediction models used by Illinois Public Health Departments and Mosquito Abatement districts.
Loss of all Midwest-based Drought Early Warning Systems products and data services advising the National Integrated Drought Information System.
Loss of Midwest monthly and seasonal weather and climate data summaries to the NOAA National Centers for Environmental Information, which houses over 25 petabytes of comprehensive atmospheric, coastal, oceanic, and geophysical data
For more information on this article or the MRCC, please contact Dr. Beth Hall via email at bethhall@illinois.edu
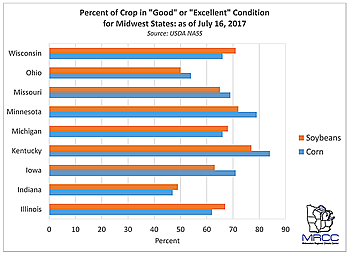
An up-and-down growing season across the Midwest has caused corn and soybean crops to struggle across portions of the Midwest. As of the July 16 USDA NASS Crop Condition Report, less than 50 percent of corn and soybeans were rated as good or excellent in Indiana. Crops in Ohio were also struggling at less than 60 percent good or excellent. Only Wisconsin, Minnesota and Kentucky corn, and Minnesota, Kentucky and Iowa soybeans had more than 70 percent in good or excellent condition. While adequate precipitation has fallen across most of the Corn Belt, except Iowa and Minnesota, and temperatures have only been slightly above normal since April 1, the region has experienced many extremes which stressed crops. This included dry and hot stretches in early June and numerous heavy rain events and severe weather which caused ponding, crop damage and planting delays. The combination of these extremes was likely a contributor to poorer crop conditions. See the Midwest Climate Watch pages for more …
cli-MATE Mapping Features: Custom maps of data for almost any time period across states, regions or the entire lower 48 of the United States are available through the mapping tools on the MRCC’s cli-MATE! All three of the MRCC’s mapping tool types are available under “Maps of Data” in the main cli-MATE menu. Gridded station data maps of temperature, precipitation and snowfall can be made using the “MRCC Gridded Data” option. Data for any specific period of time or a long-term average of data can be created on the fly. “Interpolated Station Data” maps are also available, and have both a finer resolution and more map options. Choose which networks are included in the map, and whether interstates, cities and/or counties are shown on the map. Calculations of actual values, departure from mean and percent of mean are available for variables on both the gridded and interpolated maps. Finally, the “Bi-National Precipitation” maps are a new option on cli-MATE courtesy of a partnership with Environment and Climate Change Canada which combine the National Weather Service’s Multi-sensor Precipitation Estimator (MPE) and Canadian Precipitation Analysis (CaPA) datasets. These tools are a great way find information for any period of days, from the previous week, to the past two years!
The U.S. Department of Agriculture (USDA) provides Cattle Heat Stress Forecast maps for the contiguous United States. The heat stress forecast maps are made using the seven-day forecasts of temperature, humidity, wind speed and cloud cover from the National Weather Service (NWS). The prediction of animal stress is based on an equation that combines weather forecast data to estimate cattle heat stress response, and produces a map showing stress categories by color. USDA offers daily maps for the current day and forecasted out six additional days, and provides maps for six regions of the contiguous United States.
Columbia, MO (August 3) – Vegetable Growers Field Day
Beth Hall will meet with Missouri producers to discuss climate services needs to help decision making and planning for vegetable production.
Champaign, IL (Sept 12-14) – MRCC / NWS Climate Services Workshop
The MRCC will be co-hosting a workshop with the NOAA Great Lakes Regional Collaboration Team to discuss climate services needs and tools with eight National Weather Service Forecast Office’s Climate Focal Points and key climate services partners.
Champaign, IL (September 18-20) – Building Resilience to Climate Change
Molly Woloszyn will be a panelist speaking about her climate adaptation work at this conference, which is hosted by the Institute for Sustainability, Energy, and Environment (iSEE) at the University of Illinois at Urbana-Champaign.
Bloomington, IL (October 2-4) – Illinois GIS Association Annual Conference
Zoe Zaloudek will be attending the Illinois GIS Association (ILGISA) annual conference.
Portland, OR (October 2-6) – Sea Grant Academy As an extension climate specialist for the MRCC and Illinois-Indiana Sea Grant, Molly Woloszyn will attend the second week of the 6th National Sea Grant Academy. The Academy is a professional development opportunity for Sea Grant staff around the country and one of the goals is to improve the knowledge and skills needed for professionals working in outreach.
Email us your local climate impacts! We are constantly keeping a log of how climate is impacting
our region, and our information would not be complete with YOUR help!
Have something to share as a feature article in an upcoming The Climate Observer issue, or
interested in being contacted for an article interview? Please let us know!


 An up-and-down growing season across the Midwest has caused corn and soybean crops to struggle across portions of the Midwest. As of the July 16 USDA NASS Crop Condition Report, less than 50 percent of corn and soybeans were rated as good or excellent in Indiana. Crops in Ohio were also struggling at less than 60 percent good or excellent. Only Wisconsin, Minnesota and Kentucky corn, and Minnesota, Kentucky and Iowa soybeans had more than 70 percent in good or excellent condition. While adequate precipitation has fallen across most of the Corn Belt, except Iowa and Minnesota, and temperatures have only been slightly above normal since April 1, the region has experienced many extremes which stressed crops. This included dry and hot stretches in early June and numerous heavy rain events and severe weather which caused ponding, crop damage and planting delays. The combination of these extremes was likely a contributor to poorer crop conditions.
  Departure") cli-MATE Mapping Features: Custom maps of data for almost any time period across states, regions or the entire lower 48 of the United States are available through the mapping tools on the MRCC’s
cli-MATE Mapping Features: Custom maps of data for almost any time period across states, regions or the entire lower 48 of the United States are available through the mapping tools on the MRCC’s  The U.S. Department of Agriculture (USDA) provides
  Columbia, MO (August 3) – Vegetable Growers Field Day