On the Road: MD - NOAA Great Lakes
Regional Team Meeting AK - Climate Prediction
Applications Science
Workshop MN - Natl Adaptation Forum MA - NE Climate Science
Center's Regl Science Mtg IL - 2017 Technical
Assistance Symposium CO - WERA 1012 Annual Mtg OH - Great Lakes Sea
Grant Network Meeting NC - AMS Applied Climate
Conference NC - AASC Annual Meeting
Climate Risk Monitoring Due to Unusually Warm February
USDA Midwest Climate Hub and the MRCC
Figure 1: Statewide average temperature ranks for February 2017 from National Centers for Environmental Information (NCEI).
What Happened
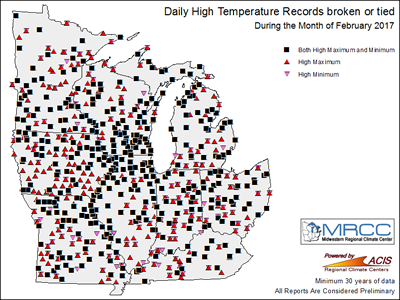
February 2017 was one of the warmest on record for the Midwest. All nine states in the MRCC region ranked among the six warmest Februarys on record. Five states, Illinois (41.0°F), Indiana (41.4°F), Kentucky (46.2°F), Missouri (45.1°F) and Ohio (40.6°F), set their warmest February on record (Figure 1). Cities that broke monthly records included Indianapolis (IN), Des Moines (IA), St. Louis (MO), Cleveland (OH) and Milwaukee (WI). Temperatures were only 3-6°F above normal during the first half of the month. However, most of the Midwest was 10°F above normal or more during the second half. Nearly 2,000 daily maximum and nearly 1,000 daily high minimum temperature records were broken from February 17-23 across the Midwest (Figure 2). Many of the daily records also set records for the warmest February reading regardless of date, in some cases multiple times.
Figure 2: Daily high temperature records that were broken or tied in February 2017.
Potential Risks to Early Season Warmth
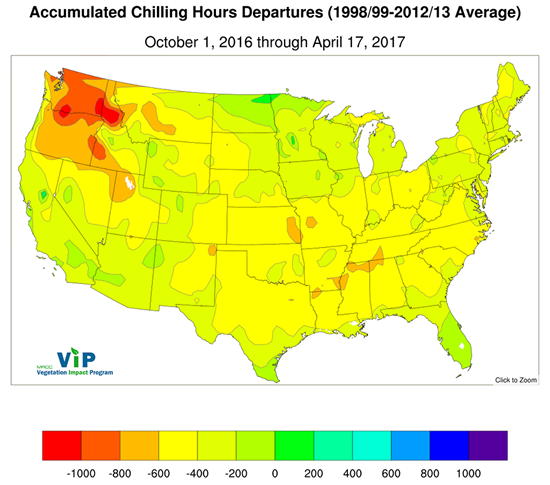
The persistent early spring warmth set up another set of problems; early dormancy break in some vegetation like perennials and trees well before average last freeze dates. Various perennial crops respond to the spring conditions in different ways by reacting to changes in temperature, changes in day length or some other combinations of triggers. Another way in which climate conditions impact perennial crops is the duration to which they were exposed to crop-specific cool, dormant-season temperatures, or accumulated chilling hours. Chilling hours is a general concept whereby a crop needs to be below a certain temperature criteria for a certain length of time before it can properly grow and reproduce in the spring. Figure 3, below, puts the accumulated chilling hours from this current dormant season into historical perspective, showing that most of the Midwest is slightly behind the climatological average. The ideal outcome is that the plant reaches its chilling hour requirement early in the spring when temperatures are appropriate for it to grow without risk of freezing temperature. However, potential problems can occur if this timing is off. For instance, if a plant does not reach enough chilling hours, it may not bloom appropriately in the spring. Another problem is that the plant may reach chilling hour requirements but responds to early warmth and blooms before the last freeze.
Figure 3: Accumulated chilling hour departures for the winter season through April 17, 2017
(from the MRCC's Vegetation Impact Program).
Another issue related to the early warm temperatures is potential nitrogen loss in warm soils. Warm soils (especially those above 50°F) enhance the conversion of nitrogen to forms that are more readily lost rather than maintained in soils for plant activity. The warmer the soils, the more potential there is for nitrogen loss to occur. Not only does lost nitrogen waste a basic nutrient for plants at a loss to a producer, the nitrogen lost from soils can lead to water quality issues downstream.
The Midwest area has seen two recent years where spring freezes did severe damage. The damaging spring freeze in 2007 followed very warm temperatures in the last 10 days of March and the first few days of April. This was immediately followed by unseasonably cold temperatures (well-below freezing) in early April, causing over four billion dollars in damage from the Midwest to the southeastern United States. In 2012, the situation was similar to this year with extended warm early-season conditions and an early dormancy break ocurring well before the last freeze. A freeze in April this year heavily damaged grapes and cherries in southeastern Michigan.
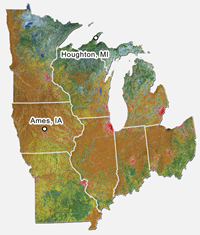
Figure 4: Map depicting the region
covered by the USDA Midwest
Climate Hub.
Regional Response to Event
In response to the early spring warmth this year, the USDA Midwest Climate Hub (Figure 4) joined with the MRCC, Extension staff and State Climatologists in Midwest states to address potential early season vegetation issues. The result was recurring phone conversations among the group to identify areas where perennial plants were at risk, share potential management solutions and discuss outlooks and potential freeze periods, which Extension staff and State Climatologists could pass on to local stakeholders.
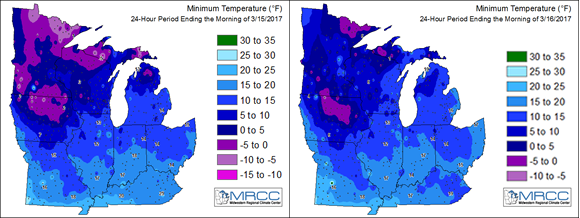
Cold temperatures in mid-March did result in temperatures below 20°F reaching a majority of the Midwest (Figure 5). Climatologically, such lows were not extreme for this time of year. However, with the early dormancy break, there were plants across the region at risk. The various inter-agency conversations provided information to the National Weather Service to issue freeze advisories to alert producers of the freeze potential.
Figure 5: Minimum temperatures across the Midwest for the 24-hour periods ending the morning of
March 15 (left) and March 16 (right).
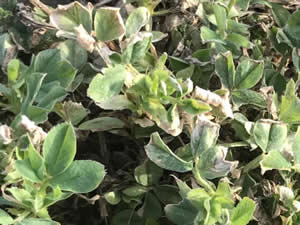
The overall assessment from various freeze impact reports was that damage did occur to various fruit trees from Ohio to Missouri. Alfalfa was also damaged in several locations (Figure 6). Losses of some blossoms on a couple varieties of fruit trees were noted, but fortunately, it does not appear as though there is a large economic loss. The consensus was that the losses were not nearly as bad as could have been, given the cold temperatures. There were actually some positive outcomes. Most fruit trees produce more blooms than the tree can handle if they all became fruit. Typically, these blooms must be removed. Several reports noted the freeze took care of the bloom removal this year.
The Frost/Freeze Guidance tools are some of the most useful tools for tracking vegetation hazards in VIP. Maps showing dates of the last (first) freeze of the spring (fall) season as well as earliest, latest and median last (first) freeze dates, based upon historical records, are available. In addition, growing degree-day maps showing accumulations since the last freeze are provided, as well as guidance from the National Weather Service (NWS) and local experts on whether the vegetation is currently susceptible to damage if freezing temperatures were to occur. Local input from growers and Extension specialists help the NWS make decisions on whether or not to issue freeze advisories or warnings. Members of the frost/freeze guidance project can also submit freeze impact reports if vegetation was damaged during a freeze in their area. The MRCC is always looking for more support from the local level! If you or someone you know would like to contribute to guidance or freeze impact reports, please subscribe to VIP.
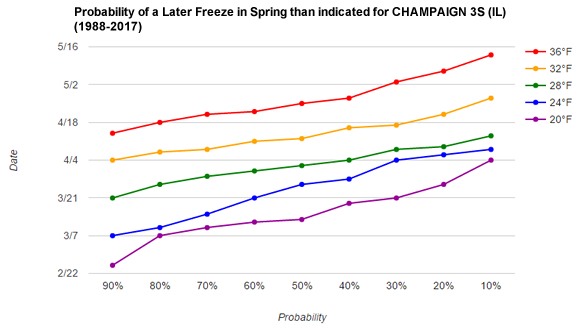
MRCC tools available through cli-MATE that may be of interest to growers include the degree-day calculator and the freeze probabilities. Using the Degree Days tool (found under Daily-Observed ➜ Daily ➜ Degree Days), the user can specify the base temperature, accumulation start date, and time period to calculate customized growing degree days for their area. The Freeze Probabilities tool (found under Charts and Graphs ➜ Freeze Probability Graphs) produces a chart showing the probability of a freeze earlier or later than a certain date in the spring or fall (Figure 7).
Figure 7: The freeze probability graph for Champaign 35 (IL) for the 30-year period of 1988-2017.
April 27, 2017 — Over the next couple of weeks unseasonably cold temperatures, very wet conditions and potentially heavy snow are likely to have a number of impacts across the north central United States. The regional climate service partnership between National Oceanic and Atmospheric Administration (NOAA) and U.S. Dept of Agriculture (USDA) have put together this briefing (no longer available) to discuss the situation. The briefing package describes the event that is currently unfolding and looks forward about two weeks. The impacts, while potentially many, are very much based on agriculture and other associated sectors like horticulture. Due to the early spring warmth, most of this region has experienced growing conditions 1 to 2 weeks early. That makes them especially vulnerable to freezing temperatures.
The combined efforts of the MRCC, Midwest Climate Hub and partners illustrate an excellent example of cooperative interagency climate services that address ag-climate issues to serve stakeholders throughout the Midwest. If you have interest in joining the conversation among these partners or receiving the Midwest Climate Hub newsletter, please reach out to the Midwest Climate Hub. If you have any feedback on additional tools that would be useful to address ag-climate issues, please reach out to the MRCC.
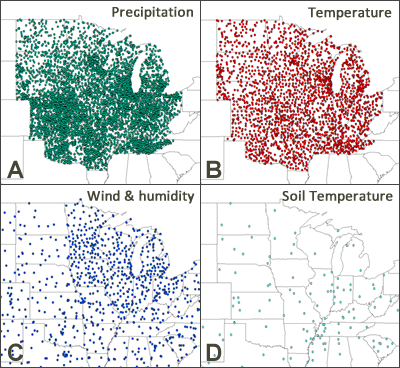
Figure 1: Station network density of Midwestern U.S. (A) Precipitation observations, (B) temperature observations, (C) wind and relative humidity observations, and (D) soil temperature observations. These stations do not include mesonet stations or other private or priprietary data networks.
In the climate services community, there can never be enough observational data to tell the story about what has been and is currently happening around our region with respect to weather and ground conditions. There are a variety of station observation networks across the United States that collect information on temperature and precipitation, providing relatively good spatial coverage across the region (Figures 1A and 1B). However, other parameters such as wind, humidity, and soil temperature are not being measured by federal data-collection networks at the same high, spatial density (Figures 1C and 1D). For sectors such as agriculture and renewable energy, these additional parameters are important for decision-making and planning.
With the accessibility of information today via the internet and mobile device apps, end users often want to know what is happening where they live – whether that be their own back yard, their neighborhood, or where they work. Unless there is a weather observing station located exactly where the end user wants that information, a lot of interpolations and assumptions must occur to provide a “best guess”.
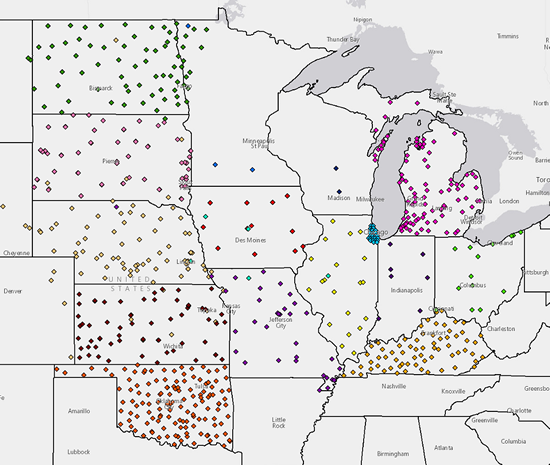
Many states across the United States have recognized the need for not only additional observation stations, but the collection of information beyond the common variables of temperature and precipitation. These data observation networks are often called “mesonets” – or networks that do not cover the entire country, but are a collection of observation stations within a smaller area (e.g., state, county) (Figure 2).
Figure 2: Mesonets in the central United States.
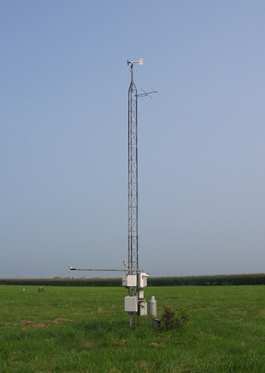
The expert staff needed to build and maintain these mesonets is often affiliated with a state climate office, university, and/or state government agency. The quality of these data is considered high and the stations (including their instruments!) are maintained on a regular basis for calibrations and inspection of site conditions. The funding can vary, and while there may be huge successes in initially building a mesonet, sustained funding for many years to continue support of the personnel, instrumentation, and data collection can often be a challenge.
Figure 3: An Illinois Climate Network station.
The Midwestern Regional Climate Center (MRCC) co-hosted the 4th mesonet workshop in Champaign, IL on March 21-23, 2017. Starting in 2013, the goals of these workshops have been to:
Continue to build a community among mesonet managers, operators, and affiliates
Collaborate on standards and practices across mesonets in order to provide relatively comparable and high-quality data
Identify ways in which individual mesonets can collaborate regionally to raise awareness of the resources and utility of mesonet data
This 2017 workshop was divided into two phases. The first phase involved only the mesonet managers, operators and affiliates. During this phase, the focus was on identifying reasonable standards and practices that all mesonets could consider, the types of metadata (e.g., information about the stations such as location, sampling rate of data collection, variables being collected) to share across mesonets, ideas for how to sustain these mesonets financially, and how to pool the data across multiple mesonets to present regional, value-added products for stakeholders to use (Figure 4).
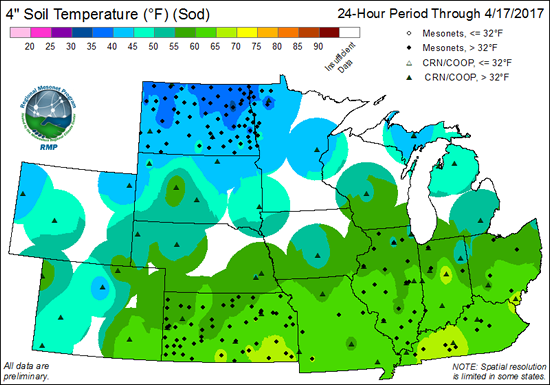
Figure 4: The Regional Mesonet Program takes data from participating mesonets and creates maps of variables like soil temperature and potential evapotranspiration that are not commonly observed at a high spatial resolution.
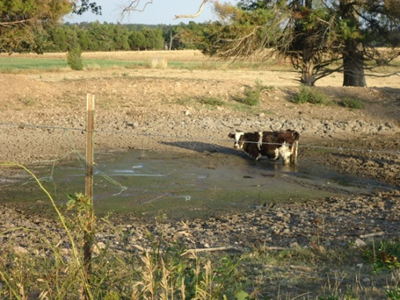
Figure 5: 2012 drought. Photo courtesty of E. Cole via P. Guinan.
The second phase of this workshop invited key partners who are or would be users of mesonet data to brainstorm data and value-added products that would improve decision-making and planning for areas such as the early warning of potential drought and impacts, weather and climate extremes related to public health, and climatological tools that could benefit the agricultural community.
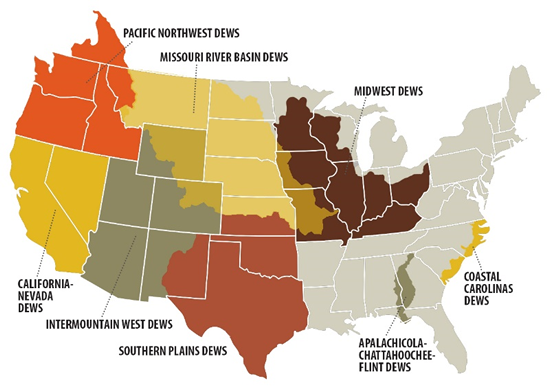
This workshop was co-hosted by the National Integrated Drought Information System (NIDIS) (Figure 6) – a NOAA program with an interagency mandate to coordinate and integrate drought research and activities in support of creating a national drought early warning information system.
Figure 6: NIDIS Drought Early Warning Systems Regions.
The American Association of State Climatologists has also recognized the efforts that have started in the Midwest and the number of mesonets affiliated with state climatology offices across the country. As interest grows, the Midwest’s Regional Mesonet Program looks forward to future collaborative workshops within its region and helping to expand the involvement and efforts across the country.
Coming Soon: Web Services Interface for Sub-Daily Data
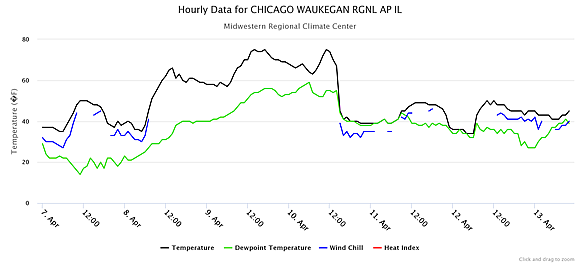
The MRCC with the Western Regional Climate Center have developed a database to store climate data including those at sub-daily time scales. Currently the Automated Surface Observing System (ASOS)/Automated Weather Observation System (AWOS) sub-daily data are available through the MRCC’s cli-MATE web application (http://mrcc.isws.illinois.edu/CLIMATE/). Tools available in cli-MATE include a data lister that also has the option for a time series graph, a wind rose plotter, and daily averages of the data.
In May 2017, we are anticipating adding a web services interface, Cli-DAP, to allow users to access large amounts of data for their own product development. The first phase will allow the ability to access station metadata and basic data listing functions. In future phases, we will be developing reductions for data such as daily averages, counts above thresholds and access to calculated variables like heat index and wind chill. In addition, we will be adding other networks, like the National Centers for Environmental Information’s Climate Reference Network (CRN) and the Remote Automatic Weather Stations (RAWS) network.
For more information on this article, please contact Leslie Stoecker at lensor@illinois.edu.
Now nearly a third of the way through 2017, we have seen numerous stretches of warmer-than-normal temperatures and just a few colder than normal. The warmth was evident in January (ranked 9th of 123 years) and especially February (ranked 2nd). March saw a cold spell in the middle of the month, but early and late warmth offset the cold to rank as the 34th warmest March on record. The cold snap in mid-March did some damage to vegetation. It also held some plants back from further phenological development, lessening its susceptibility for the remainder of the spring. April is off to a warm start, with mostly warmer-than-normal conditions. With the snow season largely behind us for most of the region, seasonal snow totals were below normal for nearly all of the Midwest with a just a few areas slightly above normal in the northern areas. Precipitation totals were a mix of above and below normal across the region. See the Midwest Climate Watch pages for more …
Vegetation Impact Program (VIP) Frost/Freeze Products
When did the last 32°F occur in my area? How many growing degree days have accumulated since the last 28°F freeze? These questions and many more can be answered using the MRCC’s VIP Frost/Freeze Products. The products not only include current season freeze maps, but also first and last freeze climatology maps for 28°F and 32°F. The VIP freeze maps can also be viewed using an interactive GIS format, which allows customization of data and an option to export your customized image. Another VIP frost/freeze product includes an interactive GIS map that shows the greatest number of consecutive hours at or below 32°F for the last 24 hours, 7 days, or 30 days.
Calculated soil moisture is provided through NOAA’s Climate Prediction Center for the contiguous United States on the daily, monthly, and seasonal scale. The total soil moisture, soil moisture anomaly and percentiles, and the monthly and seasonal change are provided. Not only can the user explore recent conditions, but also conditions over the last 12 months and the climatology for soil moisture and soil wetness. This product also offers evaporation, precipitation, runoff, and temperature maps for the contiguous United States. Global soil moisture is also calculated and offered on the monthly scale for the last 12 months. The objective of this webpage is to provide support for the National Integrated Drought Information System (NIDIS).
Beth Hall will be attending this meeting where the focus is “Incorporating Climate Science in the Management of Natural and Cultural Resources in the Midwest and Northeast”.
Chicago, IL (May 16) – 2017 Technical Assistance Symposium
Molly Woloszyn will be a panelist at the 2017 Technical Assistance Symposium, hosted by the Chicago Metropolitan Agency for Planning (CMAP). She will be speaking about her climate adaptation work in the Chicagoland area.
Estes Park, CO (May 17-19) – WERA 1012 Annual Meeting
Steve Hilberg will be attending this meeting, which focuses on managing and utilizing precipitation observations from volunteer networks. Steve is a member of this Western Education/Extension and Research Activity (WERA) technical committee
Cleveland, OH (June 5-8) – Great Lakes Sea Grant Network Meeting
Molly Woloszyn will attend this biennial meeting of NOAA Sea Grant programs in the Great Lakes. She has a joint appointment between the MRCC and Illinois-Indiana Sea Grant.
Beth Hall, Mike Timlin, and Bryan Peake will be attending this conference where applied climatologists share the latest research, activities, and resources related to climate science having a direct impact on other sectors and disciplines.
Asheville, NC (June 28-30) – American Association of State Climatologists Annual Meeting
Beth Hall, Mike Timlin, and Bryan Peake will be attending this meeting that convenes state climate offices, regional climate centers, and NOAA regional climate services.
Email us your local climate impacts! We are constantly keeping a log of how climate is impacting
our region, and our information would not be complete with YOUR help!
Have something to share as a feature article in an upcoming The Climate Observer issue, or
interested in being contacted for an article interview? Please let us know!


: Departure from Mean")
 Departure") Vegetation Impact Program (VIP) Frost/Freeze Products
Vegetation Impact Program (VIP) Frost/Freeze Products Calculated Soil Moisture
 Silver Spring, MD (May 1-3) – NOAA Great Lakes Regional Collaboration Team Meeting