On the Road: IL - NIU Geography Grad
Student Seminar IA - U2U Annual Meeting IL - Wild Things Conf. IL - Great Lakes
Awareness Day Fair MD - Sea Grant Academy IL - IAFSM Annual Meeting IL - NOAA/APA Climate
Roundtable IL - Midwest Mesonet
Conference
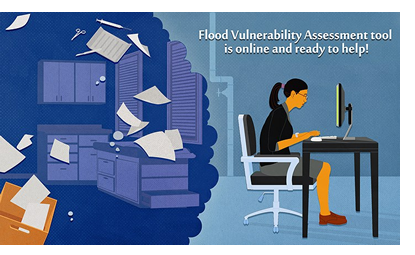
Flood Vulnerability Assessment Tool is Online and Ready to Help
Abigail Bobrow, Illinois-Indiana Sea Grant
After three years in the making, the Flood Vulnerability Assessment for Critical Facilities is now available online to assist critical facilities—like hospitals, fire and police departments, and utility providers—evaluate their preparedness for when the next big rain storm hits.
At the heart of the tool is a series of questions that will help communities in the Midwest determine a facility’s risk based on factors like its proximity to a flood plain, past flooding issues, stormwater drainage structures, and the location of backup generators, servers, and other critical systems.
Facilities are also able to use the tool to evaluate current emergency communication plans for heavy rainfall and determine whether improvements are necessary. After completing the assessment, users receive a report with specific recommendations for steps they can take to reduce the facility’s vulnerability to riverine and/or urban flooding and useful resources and recommendations to make those steps forward a bit easier.
While recalling a 9-inch rainfall that flooded the plant pump house in 2008, the facility manager of a leading wastewater treatment facility in Cook County said, “That assessment report probably would have been helpful prior to the storm—it’s very thorough.” The manager completed the assessment as part of the original project.
Flooding at Chicago's O'Hare International Airport in 2008.
The tool was built in response to questions raised after Hurricane Sandy shut down several facilities on the East Coast in 2012.
“When we started talking with Chicago partners not long after Hurricane Sandy, they were concerned about the state of critical facilities in and around Chicago—how prepared are they for potential flooding,” said Molly Woloszyn, Illinois-Indiana Sea Grant (IISG) and MRCC climate specialist who led the assessment.
“This was really the main motivation behind the project: to provide a tool that critical facility managers could use to assess their own risk for flooding and recommendations for steps they could take to reduce their risk. The facilities receive this information in a comprehensive report after they complete the online assessment.”
The assessment is part of a larger project that investigated precipitation trends in Cook County since 1989 and incorporated projections for future rainfall. The study found that large storms—specifically 5–8-inch rain events—happened more frequently at Chicago O’Hare Airport between 2002 and 2013 than in the previous 36 years.
The MRCC stayed active in 2016 with lots of new users, followers, engagements, tools and research activities! We celebrated our 34th birthday in early September and look forward to many more years providing climate data, tools, and information for users across many states, sectors, and interests. For cli-MATE, our online climate data and tools environment, over 1,400 new subscribers discovered the suite of climate data resources! Subscribers from across the country (and even a few international users!) ran cli-MATE products to download historical data, search for climate information, create maps, and even explored how climate has changed over time. In 2016, 2,345 users ran over 400,000 products in cli-MATE! (Figure 1).
The table below summarizes the variety of new tools that were launched by the MRCC in 2016 in both cli-MATE and on other MRCC web pages.
Find events that were the highest or lowest for consecutive days defined by the user. Example: When were the top 10 warmest 3-day periods between 2008-2016 for Columbia, MO?
This Date in History
Daily Observed Data >
Daily >
This Date in History
Find the temperature and precipitation conditions on a particular day, or for certain holidays. Example: What were the temperature and precipitation conditions on Black Friday from 2001-2016?
Threshold Search
Daily Observed Data >
Daily >
Threshold Search
This tool finds instances when particular thresholds of temperature or precipitation were exceeded. Example: What was the greatest amount of snowfall that occurred when temperatures never dropped below 32°F?
Multi-Station Daily Averages
Daily Observed Data >
Multi-Station (Summary, Temperature or Precipitation)
Get climate summary information for multiple stations within climate divisions. Example: For the east-central climate division of Illinois, how much snow was received at each site for December 2016?
Sub-daily data list
Hourly Observed Data >
Hourly Data Lister
Get all variables that are observed and archived from hourly (sub-daily) observation stations. These stations often collect temperature, precipitation, winds, clouds, pressure, humidity, and visibility. Derived data such as wind chill temperatures and heat index are also available. Example: What were the wind chill values on January 15, 2013, between noon and 5:00 p.m.?
Climate Summary from sub-daily data
Hourly Observed Data >
Daily-Averaged Hourly Data
Derive the daily averaged data from the suite of variables offered from hourly stations. Example: What was the average wind speed on January 21, 2017?
Wind Roses
Hourly Observed Data >
Wind Rose
Get tabular and graphical output of the wind directions and speed for customizable dates and time periods under user-specified conditions. Example: What direction are the afternoon winds typically coming from in July when temperatures are over 90°F?
Many more stations were added for users to monitor how the current winter season compares to past climatology. Example: This winter has seemed extremely mild. Is it the mildest it has ever been?
Two more predictive models have been added for Illinois. Example: What time of year does the highest infection rate typically occur in northeast Illinois?
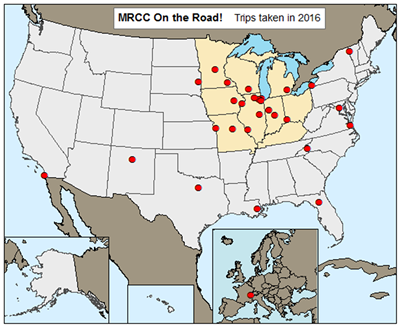
Figure 2: Locations where MRCC personnel visited during 2016.
The MRCC also got the word out in a variety of ways to share the resources we offer and to hear from users about what they need and why. Through interviews, the MRCC was referenced in over 30 articles (e.g., newspapers, online articles). Social media continues to grow with over 3,000 followers on Facebook and Twitter! The MRCC posts an average of three original posts per week, so be sure to “like” or “follow” us if you’re a fan! In person, MRCC personnel went on over 39 engagements where 12 of those were outside of the Midwest region, and one was to Europe (Figure 2).
Our MRCC Program has also been engaged in several projects that have brought climate to communities and investigated how climate information can be used to mitigate hazards. Molly Woloszyn, MRCC Extension Climate Specialist, helped develop the “Weather to Climate: Our Changing World” exhibit at the Peggy Notebaert Nature Museum in Chicago. The exhibit was open from April 2-October 23, 2016 and had over 70,000 visitors! The MRCC contributed to the development of an online Flood Vulnerability Assessment Tool for Critical Facilities (highlighted in the first article) in partnership with Illinois-Indiana Sea Grant (IISG), with support from the National Sea Grant Office. MRCC Climatologists also received funding from the IISG Program to examine climate, weather, and other environmental factors that are conducive to flash flooding events in northeast Illinois and southeast Wisconsin (greater Chicago and Milwaukee areas). Finally, the Illinois Emergency Management Agency provided funding support for MRCC climatologists to investigate possible linkages between climate and soil parameters and indoor radon concentrations.
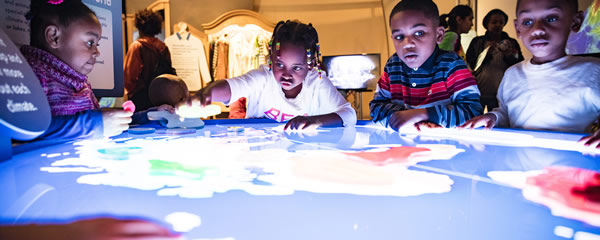
Kids exploring the climate puzzle, which was part of the "Weather to Climate: Our Changing World" exhibit at the Peggy Notebaert Nature Museum (photo courtesy of Peggy Notebaert).
We are looking forward to 2017 and know it will bring exciting new tools and updates to old ones, continued interactions with stakeholders across the region and fellow climatologists, and continued funding opportunities to explore how historical climate data can help us better understand risks and opportunities for future planning! Keep in touch with us on Facebook and Twitter (@MidwestClimate), and have a great year!
For more information on this article or the MRCC, please contact Beth Hall via email at bethhall@illinois.edu
Temperatures were very warm in 2016 in the Midwest (Figure 1). The region ranked as the 4th warmest year (+2.6°F above normal) since 1895 and statewide 2016 temperature ranks ranged from 3rd to 6th warmest (+2.2°F to +3.0°F). Region-wide, the month of March and the fall season were particularly warm with all four months ranking among the warmest 10% (i.e., top 12 of 122 years) in history for the Midwest. Regional average temperatures were at, or slightly below normal, in just three months while temperatures were well above normal (2.0°F to 6.8°F above normal) in seven months (Table 1).
Table 1: Midwest regional temperature by month
Month
2016 Temperature (°F)
1981-2010 Normal (°F)
2016 Departure (°F)
January
22.9
22.1
0.8
February
29.8
26.4
3.3
March
43.0
36.8
6.2
April
49.0
49.0
0.0
May
59.3
59.4
-0.1
June
70.7
68.6
2.1
July
73.4
72.6
0.8
August
73.1
70.9
2.2
September
67.0
62.9
4.1
October
55.7
51.0
4.6
November
45.4
38.5
6.8
December
25.8
26.0
-0.2
In March, all nine Midwest states were among the warmest 10% and the months of August to November all had between five and eight states among the warmest 10%. The fall season tied 1931 for the warmest in history for the Midwest (+5.2°F above normal) and also ranked as either the warmest or second warmest for each of the nine states in the region (Figure 2).
Precipitation in 2016 was more variable across the region than temperatures. The region-wide average for the Midwest was 39.05 inches of precipitation, 2.10 inches above the 1981-2010 normal or about 106% of normal. Michigan, Iowa, Minnesota, and Wisconsin were all at least three inches above their statewide normal while Illinois, Indiana, and Kentucky were just slightly above normal and Ohio and Missouri were well below normal (Table 2). These annual values ranked 2016 in both Minnesota and Wisconsin as the second wettest years, and Michigan as the 10th wettest since 1895 (Figure 3).
Table 2: Statewide 2016 precipitation
State
2016 Precipitation (in.)
1981-2010 Normal (in.)
2016 Departure (in.)
Percent of
Normal
Illinois
39.99
39.96
0.03
100
Indiana
43.59
42.38
1.21
103
Iowa
38.18
34.76
3.42
110
Kentucky
49.43
47.90
1.53
103
Michigan
35.97
32.94
3.03
109
Minnesota
33.70
27.92
5.78
121
Missouri
39.95
43.24
-3.29
92
Ohio
37.41
39.45
-2.04
95
Wisconsin
39.83
32.70
7.13
122
Midwest
39.05
36.94
2.10
106
Looking at precipitation for each month showed 2016 was split equally (4 months each) into much above normal (127% to 157% of normal), slightly below normal (93% to 100% of normal), and much below normal (59% to 85% of normal). The wet months were March, July, August, and September and the driest months were January, June, October, and November (Table 3).
Table 3: Midwest precipitation by month
Month
Precipitation
(in.)
1981-2010 Normal (in.)
Departure
(in.)
Percent of
Normal
January
1.05
1.77
-0.73
59
February
1.72
1.72
-0.01
100
March
3.28
2.52
0.77
130
April
3.10
3.33
-0.23
93
May
3.94
4.21
-0.27
94
June
3.61
4.25
-0.64
85
July
5.79
4.06
1.73
143
August
5.73
3.66
2.07
157
September
4.38
3.44
0.93
127
October
2.44
3.01
-0.57
81
November
1.86
2.78
-0.91
67
December
2.16
2.21
-0.04
98
Annual precipitation records were set at more than a dozen stations in Iowa, Minnesota, and Wisconsin in 2016. La Crosse, Wisconsin had 44.76” in 2016, topping the old record of 44.74” from 1881 (records extend back to 1872). Charles City, Iowa topped its record from 1999 of 51.35” (records extend back to 1884) by the end of September and finished 2016 at 58.59”. Decorah and Cresco in Iowa also set new annual records by the end of September in 2016. Southeastern Minnesota also had several stations set new annual precipitation records. The annual total at Waseca, Minnesota was 56.24”, which topped its old record of 50.46” in 1991 (records extend back to 1914). The Waseca 2016 annual total is the highest total for any station in Minnesota’s history, topping the old record by 2.72”.
The first 14 weeks of 2016 had no Midwest drought designated by the US Drought Monitor (Figure 4), making this the longest drought-free stretch for the region according to the US Drought Monitor, which dates back to 2000. There was some moderate drought in Missouri in April and May before the Midwest again went drought free until late June, when drought crept back into the region. By late summer, the drought was primarily affecting northern Ohio and parts of southern Michigan. Crop conditions were affected in these states, while the rest of the Midwest was experiencing good to excellent conditions for both corn and soybeans. The drought hung on in northern Ohio through September. October saw moderate drought introduced to southeastern Kentucky, which spread to nearly cover the state, and some areas in bordering Midwest states, by the beginning of November. The drought worsened in November to severe and then extreme levels in Kentucky before easing in December (Figure 5). Prior to this, the Midwest had been free of extreme drought for just over three years. Eastern Kentucky had more than 30 large forest fires in November with more than 100,000 acres burned, two deaths, and hundreds of hospitalizations. As the year came to a close, drought was limited to parts of southern Missouri.
There were no tornado-related deaths in the Midwest in 2016. This was just the third year (1970, 1989, and 2016) with no Midwest tornado deaths in the Storm Prediction Center records that extend back to 1950. Despite the lack of a tornado death in the region, weather-related fatalities were still recorded due to thunderstorm winds, flooding, fires, and traffic accidents.
The first fall freeze in 2016 (Figure 6) was two to four weeks later than normal in most locations due to the abnormally warm conditions in the fall. Minneapolis-St. Paul, Minnesota recorded its latest first freeze on November 18th, and its longest frost-free season at 219 days in 2016. After the first freeze, mid-December temperatures in the region plunged to the coldest December readings (Figure 7) since at least 2013 at most locations.
Heavy rainfall events in the region included several in northeastern Iowa, southeastern Minnesota, and western Wisconsin. This region had many stations record new annual precipitation totals, much of it due to heavy rains from July to September, with totals well over 24” for the 3-month period (Figure 8). These 3-month totals were close to the normal annual precipitation and more than twice the normal for this period (Figure 9). July rains in western Kentucky of 10” to 15” were common with a monthly total of 18.67” at Madisonville, Kentucky (Figure 10). Flooding was associated with many of the heavy rainfall events.
For more information on this article or the MRCC, please contact Mike Timlin via email at mtimlin@illinois.edu
Wondering what direction the wind was from during the last cold snap or what wind speed and direction occurs most during hours in January when the temperature is below 32°F? These questions can now be answered with the new Wind Rose tool on cli-MATE. This product allows the user to select any time frame during the station’s period of record to analyze the wind speed and direction including filtering specific dates or times of the day. Multiple output formats are available to select including the units of the wind speed and how many compass points the wind rose should display. Register for cli-MATE for free and find the product at Hourly-Observed Data>Wind Rose.
How has the climate changed over the past 50 or more years? In what ways and by how much? In order to answer these questions and more, the U.S. Climate Extremes Index (CEI) was developed as a framework for quantifying observed changes in climate within the contiguous United States. It is intended to be used by not only climatologists and other scientists, but also for decision-makers to aid in policy decisions and to inform the general public. NOAA’s National Centers for Environmental Information offers the CEI for the contiguous U.S. or by region, and in either a graphing or mapping tool. The data offered includes monthly maximum and minimum temperature, daily precipitation, monthly Palmer Drought Severity Index, and land-falling tropical storm and hurricane wind velocity.
DeKalb, IL (January 27) – Northern Illinois University Geography Graduate Student Seminar Beth Hall will be presenting an invited seminar on aspects of the MRCC including products and projects.
Davenport, IA (February 7-9) – U2U Annual Meeting Beth Hall will attend the final meeting of the multi-year, multi-university USDA-funded Useful To Usable (U2U) annual meeting.
Chicago, IL (February 18) – Wild Things Conference Molly Woloszyn will be presenting at the 7th biennial Wild Things Conference, which brings together volunteers, advocates, citizen scientists, researchers, and nature enthusiasts from across the Chicago region. Molly will be presenting on past, present, and future climate change in the Chicago region.
Chicago, IL (February 23) – Great Lakes Awareness Day Fair Molly Woloszyn will be an exhibitor at the 2017 Great Lakes Awareness Day Fair at the Peggy Notebaert Nature Museum. Molly will be there to discuss with attendees how climate and climate change can impact the Great Lakes.
Annapolis, MD (March 5-9) – Sea Grant Academy As an extension climate specialist for the MRCC and Illinois-Indiana Sea Grant, Molly Woloszyn will attend the 6th National Sea Grant Academy. The Academy is a professional development opportunity for Sea Grant staff around the country and one of the goals is to improve the knowledge and skills needed for professionals working in outreach.
Springfield, IL (March 8-9) – Illinois Association of Floodplain and Stormwater Management (IAFSM) Annual Meeting
Zoe Zaloudek will be attending the IAFSM annual meeting.
Chicago, IL (March 21) – NOAA/APA Climate Roundtable
Molly Woloszyn will participate in a Climate Roundtable, hosted by National Oceanic and Atmospheric Administration (NOAA) and the American Planning Association (APA). The Climate Roundtable meeting will focus on understanding how to better use climate information in city and municipal planning from the perspective of regional and local entities and nonprofits.
Champaign, IL (March 21-23) – Midwest Mesonet Conference The MRCC will be hosting a meeting to convene key mesonets from around the country to focus on coordinating efforts and future strategic plans that will benefit the Midwest region.
Email us your local climate impacts! We are constantly keeping a log of how climate is impacting
our region, and our information would not be complete with YOUR help!
Have something to share as a feature article in an upcoming The Climate Observer issue, or
interested in being contacted for an article interview? Please let us know!


 After three years in the making, the
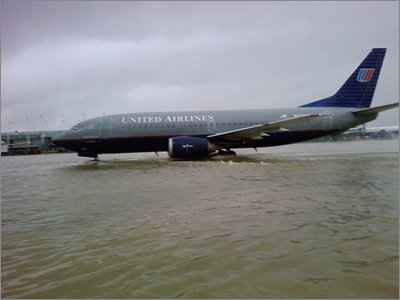


 The first fall freeze in 2016 (Figure 6) was two to four weeks later than normal in most locations due to the abnormally warm conditions in the fall. Minneapolis-St. Paul, Minnesota recorded its latest first freeze on November 18th, and its longest frost-free season at 219 days in 2016. After the first freeze, mid-December temperatures in the region plunged to the coldest December readings (Figure 7) since at least 2013 at most locations.


 Wondering what direction the wind was from during the last cold snap or what wind speed and direction occurs most during hours in January when the temperature is below 32°F? These questions can now be answered with the new Wind Rose tool on
  How has the climate changed over the past 50 or more years? In what ways and by how much? In order to answer these questions and more, the
  DeKalb, IL (January 27) – Northern Illinois University Geography Graduate Student Seminar