On the Road: NC - RCC FY17 Meeting VA - NWA Annual Meeting CA - Radiation Control Mtg MI - Great Lakes Adaptation Forum
West Nile Virus Research and Resources at the MRCC
Nancy Westcott, Research Climatologist, MRCC
The summer mosquito season is upon us! While the Gulf Coast states are concerned with the Zika virus this year, Illinois has experienced from 5 to 185 severe cases of West Nile virus every year since its introduction into the region in 2002. The Zika virus is carried by the Aedes aegypti mosquito, a ‘day-time’ feeder common in tropical and subtropical regions, while the West Nile virus is carried by the Culex pipien mosquito, a ‘night-time’ feeder found primarily in the eastern U.S. Both mosquito species feed at dusk and dawn and prefer to breed in stagnant water such as flower vases, unattended barrels, swimming pools, buckets, discarded tires, clogged gutters, and street catch basins.
Since 2005, West Nile virus (WNV) research has been carried out at the University of Illinois by the Midwestern Regional Climate Center (MRCC) at the Illinois State Water Survey, the Medical Entomology Lab at the Illinois Natural History Survey, and at the Geographical Information Systems and Spatial Epidemiology Lab (GISSA) in the School of Veterinary Sciences. This has resulted in a number of predictive models for WNV that are available on the MRCC website. All of the models are based on weather parameters.
Warm winters, such as the one this past year due to El Niño conditions, allow more mosquitoes to survive over the winter. In Illinois, the most severe summer seasons for WNV have been preceded by warm winters: 2002, 2005, and 2012. The warm temperatures in the 2015-16 winter put the mosquito abatement community on high alert for WNV for summer 2016.
While winter temperatures are important, summer conditions are critical in determining the severity of the WNV season. The growth cycle of mosquitos and viruses are particularly sensitive to temperature, and precipitation is required to develop breeding sites, but can be detrimental if rainfall rates are large enough to wash away breeding locations. Hot summers with below-average precipitation are most ideal for WNV.
In order to help decision makers identify weather conditions favorable to WNV and to help predict when mosquitos are becoming a threat to Illinois residents, a number of WNV models were developed for Illinois.
The Illinois Graphical WNV Threat Model plots summer weather conditions for the nine Illinois Climate Divisions. Click on the individual Climate Divisions to go to the current year plot of temperature and precipitation deviation from normal, and comparison plots for high and low case years below. So far, the 2016 summer season in Illinois has had average temperatures, frequent precipitation events and above-average precipitation. This appears to have delayed the onset of the WNV season in comparison to the earlier high WNV case years.
The Illinois Graphical WNV Threat Model for IL Climate Division 5 (as of August 9, 2016).
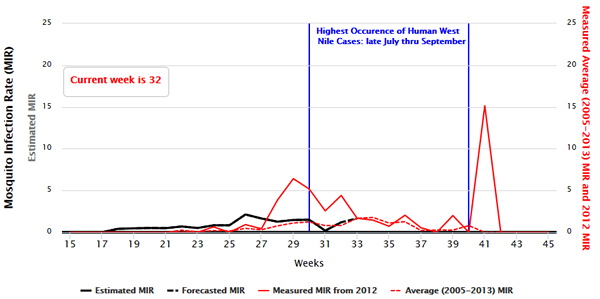
A Mosquito Infection Rate (MIR) Model developed by Dr. Marilyn O’Hara and her GISSA team for Cook (Ruiz et al., 2010) and DuPage (Shand et al., 2016) counties, was adapted to the nine Climate Divisions of Illinois by PhD student Surendra Karki in the GISSA at the University of Illinois School of Veterinary Medicine. By clicking on a given Climate Division, you can find the MIR time series plot for the current year, and below that, the plots of MIR and the number of human cases for years 2004-2013. The timing of the increase in MIR has been found to be related to the rise in number of human cases of WNV, and usually precedes the rise in human cases by about two weeks. So far, it has been an average season. Based on the time of the rise in MIR, one can expect that this year will not be a severe summer for WNV, but could be a moderate summer. Whether it is a moderate or a light year will depend on the weather for the next 4-6 weeks.
The Illinois WNV Mosquito Infection Rate (MIR) Model for IL Climate Division 8 (as of August 9, 2016).
Two county models also are presented on the websites. The DuPage County model was automated in collaboration with GISSA and the Wheaton Mosquito Abatement District, the Forest Preserve District of DuPage County, and the DuPage County Health Department. This again shows the onset of the WNV season. The Champaign-Urbana crossover model has been in operation since 2005, indicating the week when one can expect the Culex pipien to become the dominant mosquito in the local area (Westcott et al 2011; Kunkel et al, 2005). Human cases of WNV are then once again expected to occur two weeks later. All the models are used in conjunction with local mosquito sampling to provide information to help decide when to begin mosquito abatement and to alert the public to the dangers of WNV.
The MIR models for the nine IL Climate Divisions and for DuPage County have all incorporated National Weather Service (NWS) forecasted temperature (7-day) and precipitation (3-day) data that allows the model to be extended for about 1-week into the future. The Champaign-Urbana Crossover model incorporates NWS temperature forecasts.
Human behavior can reduce the number of cases of WNV, such as wearing protective clothing (long sleeves and long pants), using mosquito repellant, and emptying sources of stagnant water in one’s yard and community. The WNV resource page has links to public health agencies and the Center for Disease Control (CDC), where more tips to decrease the likelihood of being infected with WNV can be found. A recent video developed at the University of Illinois provides some additional ideas to help prevent mosquito breeding and development. Finally, one can monitor conditions by linking to Healthmap, which displays WNV news articles collected by Boston General Children’s Hospital. The MRCC WNV website specifically displays those for WNV in the Midwest, but they collect articles from across the country for a variety of diseases.
Katie Frerker, Ecologist, U.S. Forest Service (Superior National Forest)
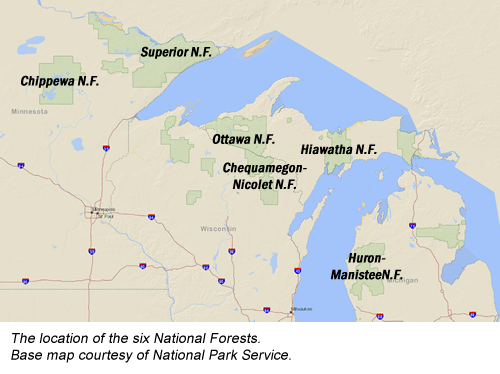
Due to recent changes in national policy, the USDA Forest Service is now required to monitor “measurable changes related to climate change” on the land it manages. In the northern Great Lakes Region, managers of six National Forests (Chippewa (MN), Chequamegon-Nicolet (WI), Hiawatha (MI), Huron-Manistee (MI), Ottawa (MI) and Superior (MN)) came together to discuss how climate change will most significantly impact the area and how it can be monitored. All Forest managers agreed that changes in winter severity and the potential for milder winters were key issues related to climate change that are threatening the resources and economies in the Great Lakes Region. Because of this, the Forest managers proposed incorporating the following questions into their monitoring programs:
How are timing and duration of winter weather conditions changing across Great Lakes National Forests on an annual basis?
How is this affecting the Forests’ resources?
Superior National Forest
However, exactly how to measure and monitor winter severity in the Great Lakes was not apparent until the Forest managers were put in touch with Steve Hilberg and the Midwestern Regional Climate Center (MRCC). Steve introduced the Forest managers to The Accumulated Winter Season Severity Index (AWSSI) which measures temperature, snowfall and snow depth throughout the winter season and gives each year a severity rating. With Steve’s help, a baseline AWSSI values from 50 years ago will be calculated and compared to future AWSSI values for the six Forests.
While the Forests managers will monitor the changes in AWSSI values compared to the baseline, they will also analyze how the changes in winter severity are related to resource use on the individual Forests. For example, the forest managers at Superior National Forest will compare changing AWSSI values with two different indicators:
The number of timber operability days lost each year. In order for many timber operations to be implemented in the northern Great Lakes, the ground must be frozen to avoid soil compaction. As winters become milder and the ground is frozen for fewer days each year, it is anticipated that the ability to harvest timber in the area will be reduced.
The number of self-issued Boundary Waters Canoe Area Wilderness (BWCAW) permits each year. At the end of the summer season, visitors to the BWCAW no longer need to reserve a permit through the Superior NF offices, but can self-issue permits at wilderness entry points. This helps the Superior to track winter recreation use in the area including ice fishing, cross-country skiing and snowshoeing. If lakes don’t freeze and snow depths are reduced, there will likely be a decline in winter recreation (and BWCAW self-issue permits) on the Superior NF.
Comparing the AWSSI value with these two indicators will help the Superior forest managers track how both timber harvest and recreation use are changing with warmer winters.
In May 2016, the Superior and Ottawa National Forests officially began to monitor climate change using the AWSSI. While these two Forests are the first in the region to monitor winter severity in this manner, there is potential to detect broader trends across the area as more Forests in the northern Great Lakes use the AWSSI in the future.
For more information on this article, please contact Katie Frerker via email at kfrerker@fs.fed.us.
At the end of August 2016, Nancy Westcott will retire from the University of Illinois after working at the Illinois State Water Survey since June 1979. She has worked with the MRCC since the early 1990s. During her time at the MRCC, she coordinated the Climate Data Modernization Program (CDMP), which was a 10-year program through NOAA that worked to preserve and place online a wide range of observations about the climate from the last three centuries. Some of Nancy's other work includes West Nile Virus research and coordinating the Cook County and Imperial Valley precipitation networks.
The MRCC would like to congratulate Nancy on her accomplished career and wish her well in retirement. We will miss you Nancy!
The summer of 2016 has been a mix of wet and dry for much of the Midwest. June was drier than normal for most of the region and then July was wetter than normal for most of the region. Missouri went from a dry June (15th driest in 122 years) to a wet July (8th wettest). The contrast from June to July was not seen everywhere as a few areas were either wet or dry in both months. The wet areas in June, Wisconsin and some areas of the neighboring states, were again wet in July. Dry areas in both months included northwest Iowa and most of Ohio. The lack of summer rains in northern Ohio contributed to the introduction and expansion of drought in northern Ohio during July.
Temperatures were also up and down during the first two months of the summer in the Midwest. There were both warm spells and cool spells in both months. Very warm temperatures, along with high humidity, spread across the region in the latter half of July. Heat advisories and warnings were issued for several days with heat index values well above 100°F on consecutive days. Read more...
Modified Stress Degree Days (SDD) are a way of monitoring the stress of heat on vegetation. The most common use of SDD is with corn plants. Maximum temperatures above 86°F can be detrimental for corn plants, and SDD accumulate a degree day for every degree the maximum temperature is above 86°F. To monitor SDD, the MRCC has spatial maps of accumulated SDD and SDD departure for the U.S. on our Vegetation Impact Program webpage. Station based SDD accumulation can also be calculated for current and past years in the Degree Days tool on cli-MATE. The 86°F threshold used for corn can be changed using the tool for other crop types.
The National Centers for Environmental Information (NCEI) has released a U.S. Climate Atlas tool based on the nClimDiv monthly gridded data. These grids are used to compute the climate division and state data that extend back to 1895. The tool allows the user to show temperatures or precipitation, along with departures from the 1981-2010 climate normals, for any month. There is also an option to compare two different grids. The comparison can contrast a monthly or annual grid against the climatological values, or contrast monthly values in two different years, and many other comparisons. Comparisons can be shown side-by-side, with a slider, or as an animation.
Asheville, NC (Aug 8-12) - Regional Climate Services FY17 Implementation Planning Workshop Beth Hall will be joining other Regional Climate Center directors to discuss RCC contract requirements, strategic visions, and climate service partnerships.
Norfolk, VA (Sept 12-16) - National Weather Association Annual Meeting
Bryan Peake and Beth Hall will be presenting a poster on the MRCC's new hourly climate database and tools.
San Diego, CA (Sept 19-22) - Conference of Radiation Control Program Directors Beth Hall will be giving a presentation on findings from an Illinois Emergency Management Agency-funded project that examined relationships between surface weather and ground conditions to residential radon concentrations.
Ann Arbor, MI (Oct 5-7) - Great Lakes Adaptation Forum Beth Hall, Molly Woloszyn, and Olivia Kellner will be attending this meeting, which will bring together hundreds of practitioners and researchers from across the Great Lakes region. The MRCC is a co-sponsor.
Email us your local climate impacts! We are constantly keeping a log of how climate is impacting
our region, and our information would not be complete with YOUR help!
Have something to share as a feature article in an upcoming The Climate Observer issue, or
interested in being contacted for an article interview? Please let us know!

 Departure")


 The summer mosquito season is upon us! While the Gulf Coast states are concerned with the Zika virus this year, Illinois has experienced from 5 to 185 severe cases of West Nile virus every year since its introduction into the region in 2002. The Zika virus is carried by the Aedes aegypti mosquito, a ‘day-time’ feeder common in tropical and subtropical regions, while the West Nile virus is carried by the Culex pipien mosquito, a ‘night-time’ feeder found primarily in the eastern U.S. Both mosquito species feed at dusk and dawn and prefer to breed in stagnant water such as flower vases, unattended barrels, swimming pools, buckets, discarded tires, clogged gutters, and street catch basins.
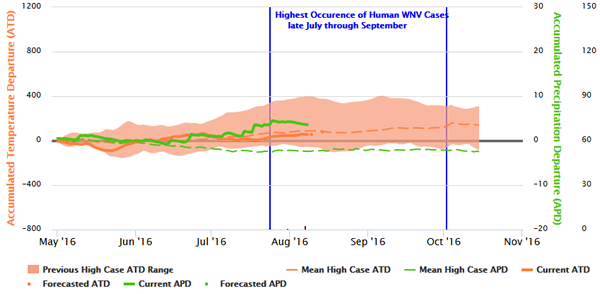
 Due to recent changes in national policy, the USDA Forest Service is now required to monitor “measurable changes related to climate change” on the land it manages. In the northern Great Lakes Region, managers of six National Forests (Chippewa (MN), Chequamegon-Nicolet (WI), Hiawatha (MI), Huron-Manistee (MI), Ottawa (MI) and Superior (MN)) came together to discuss how climate change will most significantly impact the area and how it can be monitored. All Forest managers agreed that changes in winter severity and the potential for milder winters were key issues related to climate change that are threatening the resources and economies in the Great Lakes Region. Because of this, the Forest managers proposed incorporating the following questions into their monitoring programs:
 At the end of August 2016, Nancy Westcott will retire from the University of Illinois after working at the
  The summer of 2016 has been a mix of wet and dry for much of the Midwest. June was drier than normal for most of the region and then July was wetter than normal for most of the region. Missouri went from a dry June (15th driest in 122 years) to a wet July (8th wettest). The contrast from June to July was not seen everywhere as a few areas were either wet or dry in both months. The wet areas in June, Wisconsin and some areas of the neighboring states, were again wet in July. Dry areas in both months included northwest Iowa and most of Ohio. The lack of summer rains in northern Ohio contributed to the introduction and expansion of drought in northern Ohio during July.
 Departure") Modified Stress Degree Days (SDD) are a way of monitoring the stress of heat on vegetation. The most common use of SDD is with corn plants. Maximum temperatures above 86°F can be detrimental for corn plants, and SDD accumulate a degree day for every degree the maximum temperature is above 86°F. To monitor SDD, the MRCC has
Modified Stress Degree Days (SDD) are a way of monitoring the stress of heat on vegetation. The most common use of SDD is with corn plants. Maximum temperatures above 86°F can be detrimental for corn plants, and SDD accumulate a degree day for every degree the maximum temperature is above 86°F. To monitor SDD, the MRCC has  The National Centers for Environmental Information (NCEI) has released a
  Asheville, NC (Aug 8-12) - Regional Climate Services FY17 Implementation Planning Workshop