How severe was last winter? Or, the winter before? The answer to these questions can be somewhat subjective and depend on location. A “normal” winter in Minneapolis would be a record severe winter in, say, Atlanta, GA. The average temperature or total snowfall for a location will paint part of the picture, but it is far from a complete description. The question “How severe was this winter?” does not have a simple answer. At the very least, the severity of a winter is related to the intensity and persistence of cold weather, the frequency and amount of snow, and the amount and persistence of snow on the ground. Winter severity is site-specific, relative to the climatology of the region and the experiences of its population.
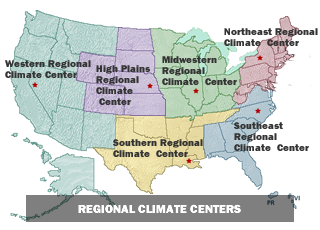
 Winter seasons have significant societal impacts across all sectors ranging from direct human health and mortality to commerce, transportation, and education. To help put winters in context, researchers Dr. Barbara Mayes Boustead at the National Weather Service in Omaha and Steven Hilberg of the Midwestern Regional Climate Center collaborated to develop the Accumulated Winter Season Severity Index (AWSSI), an objective index that uses commonly available data to quantify and describe the relative severity of the winter season. One motivation for developing such an index was to characterize and compare the winter of 1880-1881 to present-day winters. The winter of 1880-1881 was the brutal winter that was the subject of Laura Ingalls Wilder’s book “The Long Winter” and is the focus of Boustead’s Ph.D. dissertation. Winter seasons have significant societal impacts across all sectors ranging from direct human health and mortality to commerce, transportation, and education. To help put winters in context, researchers Dr. Barbara Mayes Boustead at the National Weather Service in Omaha and Steven Hilberg of the Midwestern Regional Climate Center collaborated to develop the Accumulated Winter Season Severity Index (AWSSI), an objective index that uses commonly available data to quantify and describe the relative severity of the winter season. One motivation for developing such an index was to characterize and compare the winter of 1880-1881 to present-day winters. The winter of 1880-1881 was the brutal winter that was the subject of Laura Ingalls Wilder’s book “The Long Winter” and is the focus of Boustead’s Ph.D. dissertation.
The “Long Winter” of Wilder’s book, set in the Dakota Territory (present-day east central South Dakota), featured a nearly continuous string of blizzards, along with brutal cold air outbreaks, spanning October 1880 through April 1881. Many readers and Wilder fans have wondered if that winter was realistic, if it was the “worst” winter in that area, and if there has been any winter like it since then. Using the AWSSI, combined with available weather data, Boustead was able to determine that the winter of 1880-1881 was among the worst in the region but perhaps not even the worst on record. Depending on the site, the extremity of the Long Winter was rivaled by winters in 1874-1875, 1911-1912, 1950-1951, 1961-1962, 1978-1979, and even as recent as 1996-1997.
The AWSSI uses daily data – maximum and minimum temperature, snowfall, and snow depth. The season start and end is determined by specific weather events, not by the calendar, so it captures winter weather from its first occurrence to its last during the season. At a minimum for any location winter runs from December through February, assuming that the other triggers do not occur.
- The winter season begins when the first of any one of the following instances occurs:
- First measurable snowfall (>= 0.1 inch)
- Maximum temperature at or below 32°F
- December 1
-
- The winter season ends at the last occurrence of any of the following:
- Last measurable snowfall (>= 0.1 inch)
- Last day with 1 inch of snow on the ground
- Last day with a maximum temperature of 32°F or lower
- March 1
The AWSSI does for winter what other such scales do for hurricanes, tornadoes, and droughts. During the winter season, daily scores are calculated based on scores assigned to temperature, snowfall, and snow depth thresholds. The daily scores are accumulated through the winter season, allowing a running total of winter severity in the midst of a season as well as a final, cumulative value characterizing the full season. Accumulations of the temperature and snow components of the index are computed separately and then added together for the total index. This allows comparison of the relative contribution of each to the total score. The AWSSI can be tracked as the season progresses, and it allows comparisons of winter severity to average and to previous years.
The AWSSI can be calculated for any location that has the requisite temperature and snow data, but to put the AWSSI at a specific location in context requires sufficient historical data. For each location with such data, the AWSSI is calculated for each winter since 1950. The scores are stratified into quintiles, and these were assigned to descriptive categories.

Category labels, descriptions, percentiles, andcolor coding the the AWSSI.
The index values can be compared to other years at the same location to gauge the severity of a given winter. In this example, the AWSSI accumulation is shown for Detroit for the winter of 2013-2014, 2014-2015, and for the current winter. The Detroit AWSSI of 1,274 for the winter of 2013-2014 was a new record (since 1950), eclipsing the old record of 1,048 set during the winter of 1977-1978. The AWSSI reached the Extreme category in early December and stayed there the entire winter. Contrast that to this year, where the AWSSI is in the Mild category, though not likely to end lower than the record Mild year of 2011-2012.

This chart displays the AWSSI for the current year (blue shaded), along with 2014-2015 (orange), the record AWSSI in 2013-2014 (purple), the lowest (red) in 2011-2012, and the average (black).
The AWSSI is also helpful in characterizing the progress of a winter (below). During the winter of 2014-2015, the Boston area was experiencing a milder than normal winter. Through mid-January, snowfall totaled only 15.5 inches at Blue Hill, MA, less than half of average through the date. At that point, the AWSSI was in the Moderate category. However, over the next six weeks, winter hit with a vengeance, with persistent bone-chilling cold and another 10 to 12 feet of snow across New England. Blue Hill’s AWSSI score went from 229 on January 25 to a record 1,417 on April 3. The average AWSSI for Blue Hill is 674. Blue Hill was chosen to represent the Boston area because daily snow depth is no longer measured at Boston’s Logan Airport.

This chart displays the AWSSI for Blue Hill, MA for 2014-2015 (blue line) compared to the lowest in 2011-2012 (red line) and most severe AWSSI in 2002-2003 (purple line).
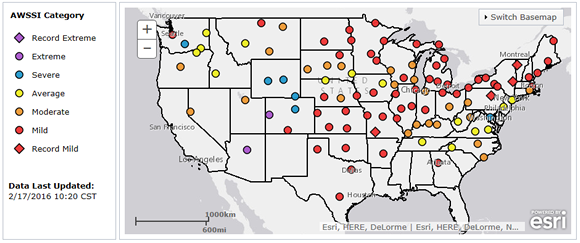
The index values can also be compared at differing locations to compare winter severity among the various cities. The map below shows the status of the AWSSI across the country as of February 17, 2016 and reflects the overall effect of El Niño and the positive phase of the North Atlantic Oscillation on the U.S. Most of the country east of the Rockies is experiencing a mild winter without much snow, while along and west of the Rockies, the winter status is more of a mix, ranging from Extreme to Moderate.
While the AWSSI factors in the major components of temperature and snow, it does not include two elements that can compound a winter’s severity. Wind can be a major factor in storms creating impossible travel conditions and dangerous wind chill values. However, wind is typically only measured at airports and can vary greatly during the day and between locations. There is no “daily” wind value that is measured and recorded at most climate locations. Freezing rain is another element that is not factored in. Ice storms can be extremely damaging, and the effects can persist for days or weeks. However, freezing rain is reported as liquid precipitation, and ice thickness is not part of the observation.
The MRCC AWSSI web page was redesigned this year to include an interactive map. The AWSSI map is updated several times each day. The AWSSI is calculated for about 100 locations across the country, and more locations will continue be added this winter and in future years. The map allows you to select a location and view the updated chart for that location. In addition, for nine of the sites (Blue Hill, MA; Chicago, IL; Denver, CO; Detroit, MI; Minneapolis, MN; New York City, NY; Omaha, NE, Urbana, IL; and Washington, DC), a manually-updated PDF file with the daily scoring and an additional chart can be viewed. Future plans include adding more functionality to the web page, including the ability to compare and plot other years with the current years, the ability to generate the AWSSI on the fly for other locations, and means to download the AWSSI data.
The AWSSI scoring thresholds were determined with impacts in mind. The AWSSI has any number of potential applications and uses, especially sectoral applications. AWSSI and/or its contributing components could be applied to transportation and road maintenance to correlate cost, supplies, or traffic accidents and delays, as well as to health factors such as hospital and emergency room visits or mental health incidents. The index could be correlated to wildlife populations and their markers of abundance, migration, or health. In a predictive sense, awareness among such sectors that AWSSI is approaching a critical threshold of severity may invoke protective or preventative measures to offset potential costs and/or impacts experienced during higher severity. The AWSSI also can be related to climate signals such as the El Niño/Southern Oscillation (ENSO), Arctic Oscillation (AO), North Atlantic Oscillation (NAO), and Pacific Decadal Oscillation (PDO).
Further Reading:
The Accumulated Winter Season Severity Index (AWSSI)
Barbara E. Mayes Boustead, Steven D. Hilberg, Martha D. Shulski, and Kenneth G. Hubbard. Journal of Applied Meteorology and Climatology, Vol. 54, No. 8, August 2015: 1693-1712.
Abstract | Full Text | PDF (2545 KB)
Boustead, Barbara, "The Hard Winter of 1880-1881: Climatological Context and Communication via a Laura Ingalls Wilder Narrative" (2014). Dissertations & Theses in Natural Resources. Paper 98. http://digitalcommons.unl.edu/natresdiss/98
For more information on this article or the AWSSI, please contact Steve Hilberg via email at hberg@illinois.edu
^Top
|


 At the
 The Nature Museum is dedicated to creating a positive relationship between people and nature through collaborations, education, research and exhibitions such as Weather to Climate. As Chicago’s urban gateway to nature and science we could not be more proud to bring this global conversation to our own community.
 The
The 
 Student interns have the opportunity to help support in the
  After a warm fall and early winter, winter weather has been more common across the Midwest since Christmas. The rains of December saturated soils for much of the region but conditions have dried out in January and early February. Snowfall totals were well below normal through Christmas but totals since then have picked up with several storms affecting parts of the Midwest, bringing snow and colder winter temperatures. It hasn’t been just winter weather in recent weeks, as there have been some warm weeks as well. The last week of January and the first week of February were well above normal for most of the region.
  Departure") Have you ever wondered how many days on average per year the temperature is 90°F or above for your city? Or how much precipitation fell in the wettest summer on record? Find out these statistics and more using the Midwestern Regional Climate Center’s updated
Have you ever wondered how many days on average per year the temperature is 90°F or above for your city? Or how much precipitation fell in the wettest summer on record? Find out these statistics and more using the Midwestern Regional Climate Center’s updated  The
The  Geneva, Switzerland (Feb. 15-27) – World Meteorological Organization