On the Road: IL - IL Mosquito & Vector Control Association IL - IL NWS Data Acquisition
Workshop IN - Indianapolis NWS
IN - Ball State University
Geography/GIS Program IN - Purdue University Crop
Production Clinic
CA - American Geophysical
Union Annual Meeting MO - Risk Management
Agencies LA - American Meteorological
Society Annual Meeting &
Applied Climatology Conf. MI - Great Lakes
Environmental Research
Laboratory
Climate Communication through Regional Climate Impacts and
Outlook Reports
Doug Kluck, Central Region Climate Services Director, NOAA National Centers for
Environmental Information & Molly Woloszyn, Extension Climate Specialist, MRCC and Illinois-Indiana Sea Grant
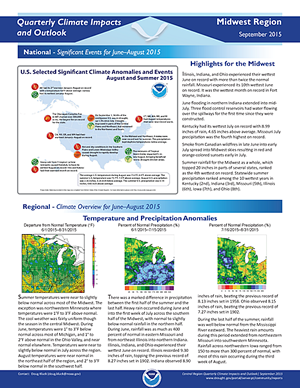
Figure 1: The front page of the Midwest Region
report
from September 2015
Important and often damaging climate and weather events are commonplace across the United States. Extreme heat or cold, drought or heavy rains often cause disruption to our economies and lives. State, Tribal and local governments, private interests, non-governmental organizations and other federal agencies constantly adjust to these changing patterns and extreme events. Thus, building awareness and understanding of the current impacts of weather and climate, as well as looking forward to potential extremes, is useful to prepare and mitigate the impacts of these events.
For the first time, climate summary reports that aim to provide this sort of information are regularly issued for regions across the United States. Through collaboration among the National Oceanic and Atmospheric Administration (NOAA), Regional Climate Centers (RCCs), the American Association of State Climatologists (AASC), and other climate partners, the Climate Impacts and Outlook Reports began experimentally in June 2012 and are now issued every quarter in late March, June, September, and December.
These short executive reports (one-page front and back) aim to tell the recent climate story of a particular region or watershed in the United States. In the north central U.S., for example, there are three briefs including the Midwest, Missouri River Basin, and Great Lakes. Each report interprets the last season's major climate events, how it compares climatologically, impacts from those events and ends with an outlook for the upcoming season.
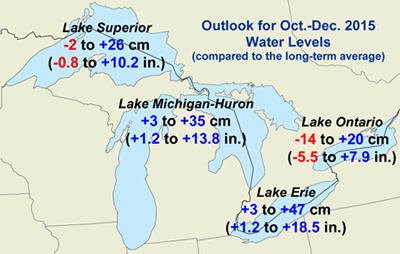
Figure 2: The Oct-Dec 2015 outlook for Great Lakes water levels is
an example of the bi-national data produced for the Great Lakes
reports with Environment Canada.
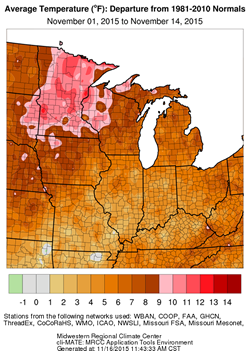
As mentioned above, the reports are produced by organizations within NOAA (e.g., National Centers for Environmental Information, Regional Climate Centers, National Weather Service, Sea Grant, National Integrated Drought Information System, Office for Coastal Management, Climate Prediction Center, Regional Integrated Sciences and Assessments), as well as a number of other federal agencies (e.g., U.S. Army Corps of Engineers) and other climate information providers. In some regions like the Great Lakes and Gulf of Maine, the effort is bi-national with Canadian government partners like Environment Canada and Agriculture and Agri-Food Canada.
The response to the briefs has been overwhelmingly positive. Other federal and state agencies use them to brief other parts of their organizations, and in one case they have been mandatory reading for a particular bi-national group. The authors of these reports (listed on each report) are always looking to hear how these reports are used or any feedback on the reports in general.
Tom Hultquist, Science & Operations Officer, NWS Twin Cities
Map showing the burnt area of the Peshtigo fire.
Image courtesy of www.exploringoffthebeatenpath.com
From Sunday, October 8 through Tuesday, October 10, 1871 wildfires claimed thousands of lives and destroyed millions of acres across the Upper Midwest. The most famous fire struck Chicago, and claimed about 300 lives while destroying over three square miles of the city, including more than 17,000 buildings. For many years, the cause of the fire was attributed to a cow housed in a barn on 137 DeKoven Street. The cow, owned by Mrs. O’Leary, purportedly knocked over a lantern that set off the blaze. A reporter later admitted to fabricating the story, but it continues to endure in popular culture. The actual cause of the fire was never determined, but weather conditions across the entire region during the summer and fall of 1871 produced conditions conducive to large, rapidly-spreading fires should one ignite. Large wildfires also struck several areas in Michigan, with Holland, Port Huron, and Manistee seeing the most significant damage and loss of life. Although the exact death toll from the Michigan fires is unknown, it likely claimed in excess of 500 lives. However, the most costly fire in terms of loss of life occurred in and around Peshtigo, Wisconsin, and remains to this day as the deadliest fire in American History.
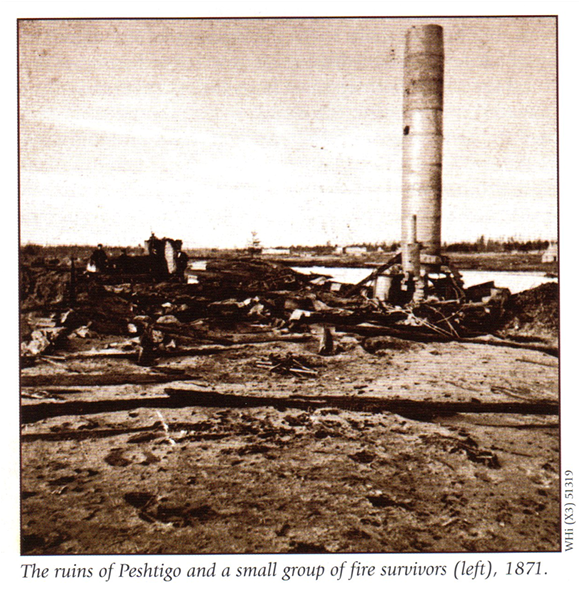
Figure 1: Peshtigo after the fire (Pernin 1999)
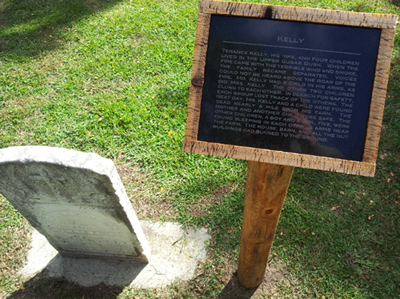
Fire reached Peshtigo during the evening of Sunday, October 8, 1871. By the time the fire ended, it had consumed 1.5 million acres, and an estimated 1,200-2,400 lives, including approximately 800 in Peshtigo. Only one building in the town survived the fire (Figure 1). What we know of the fire is primarily taken from the first-hand account of Reverend Peter Pernin. His account details a number of personal stories from those who were present in Peshtigo during the fire, and many of those personal stories are displayed alongside graves in the cemetery adjacent to the Peshtigo Fire Museum. One such story details the experience of the Kelly family (Figure 2):
Figure 2: Gravestone and story of the Kelly Family at the Peshtigo
Cemetery. Photo by Thomas Hultquist.
"Terance Kelly, his wife, and four children lived in the upper Sugar Bush. When the fire came with the terrible wind and smoke, the family became separated. Voices could not be heard above the roar of the fire. Mr. Kelly had a child in his arms, as did Mrs. Kelly. The other two children clung to each other. In search for safety, each group lost track of the others. The next day, Mr. Kelly and a child were found dead nearly a mile from his farm. The mother and another child were safe. The other children, a boy and a girl, five, were found sleeping in each others arms near the farm. The house, barn, and all the outbuildings had burned to the ground."
Click for larger image Figure 3 Figure 4 Figure 5
The fire in Peshtigo resulted from a number of factors, including prolonged drought, logging and clearing of land for agriculture, local industry, ignorance and indifference of the population, and ultimately a strong autumn storm system occurring in the presence of conditions supportive of a large, rapidly-spreading fire. In order to better understand the large-scale weather conditions leading up to the fire, data from the 20th Century Reanalysis (which covers the period from 1871-present) was analyzed. A large upper-level ridge was present across the region from July through September (Figures 3 and 4), which would have set the stage for warm and potentially dry weather. Reanalysis of 2 m temperatures from July through September indicates above-normal temperatures were present from the central Plains into the upper Midwest (Figure 5).
At the time, Fort Embarrass, approximately 60 miles southwest of Peshtigo, kept detailed weather records. Comments from their observers in several entries indicate smaller fires prior to October 8, as well as a record of the deadly fire itself (Figures 6, 7, 8). Dense smoke was observed for several days leading up to the fire, and temperatures in the 70s were reported on October 8 (Figure 9). Although observations were scarce at the time, a surface weather map on the day of the deadly fire was reconstructed from the available data, indicating a strong low pressure system over the central plains (Figures 10, 11), which would have produced strong southwesterly winds across the region. These winds, in combination with the warm temperatures and dry conditions, likely led to the rapid spread of pre-existing fires and any new fires that ignited.
Click for larger image: Figures 6, 7, 8
Click for larger image: Figures 9, 10, 11
The fires of October 8-10, 1871 helped serve as a wake-up call to many about the land use practices of the time. Timber from cleared land was discarded without regard to its potential to fuel wildfires. The subsequent 144 years has seen an evolution in how to mitigate wildfire potential with varying degrees of success, but awareness of the issue has dramatically increased. Weather support has become an integral part of fire operations, for both planned burns and wildfires. The National Weather Service has Incident Meteorologists trained in providing remote and onsite support to firefighters who battle wildfires across the United States, and have also supported operations internationally. Although wildfires will always occur and continue to claim lives and property, improvements in weather information, land management, and general awareness of the danger of wildfires helps ensure tragedies of the scale that occurred in early October 1871 will not be repeated.
Gess, Denise and William Lutz. Firestorm at Peshtigo: A Town, Its People, and the Deadliest Fire in American History. Henry Holt & Company (August 2002). 320 pp. ISBN 0805067809.
Pernin, the Rev. Peter, "The Great Peshtigo Fire: An Eyewitness Account." Madison, Wis.: State Historical Society of Wisconsin, 1971. Reprinted from the Wisconsin Magazine of History, 54:246-272 (Summer, 1971). [New 2nd Edition (1999)]
Pyne, Stephen J. Fire in America: A Cultural History of Wildland and Rural Fire. Seattle: University of Washington Press, 1997. [Pyne integrates the history of fire with ecology, agriculture, logging, and resource management. He includes a vivid description of the Peshtigo fire and the other fires of 1871.]
It has been a warm fall in the Midwest. September was above average across the region, ranking as the 2nd warmest on record (1895-2015) for the region as a whole, with the northern states of Minnesota, Wisconsin, and Michigan each setting a new statewide record for the month. October averaged slightly above normal with some colder weather offsetting a very warm second week of the month. This brought the September-October temperatures to a rank of 10th warmest, with six of nine states ranking among the 10 warmest for the same period.
November is off to a very warm start also, with the first week of the month recording temperatures more than 10°F above normal in the northern and eastern portions of the region. More details on the fall warmth are available in the weekly and monthly summaries on the MRCC Climate Watch pages. Read more...
Introducing the MRCC El Niño page! This page includes seven different topics surrounding the current El Niño and past El Niño events. Find out what causes El Niño, the impacts of El Niño, historical El Niño events and more. An all new GIS tool is also available to compare the 2015-16 El Niño event as it happens. The MRCC GIS El Niño Comparison Tool is updated monthly and compares months and seasons during the 2015-16 El Niño to the 30-year normal and other strong El Niño events. Comparisons for temperature and precipitation are available nationwide by climate division, with snowfall available for the nine-state MRCC region.
The Storm Prediction Center’s Severe Weather Probability webpage provides climatological data for the United States on the probability for severe weather (i.e., tornado, wind, hail) within 25 miles of a location for every week of the year. The information is offered in a user-friendly way, by either static graphics or looping map animations. The probabilities are based on a 30-year period of severe weather reports from 1982-2011 and are available for the probability for any severe weather, all tornado, significant tornado (EF-2 or above), all wind, significant wind (> 64 knots), all hail, and significant hail (> 2 inches).
Champaign, IL (November 20-21) - Illinois Mosquito & Vector Control Assn. Nancy Westcott will be attending the Illinois Mosquito and Vector Control Association annual meeting.
Lincoln, IL (early December) - Illinois National Weather Service Data Acquisition Workshop
The MRCC will be attending and presenting at the Illinois National Weather Service (NWS) Data Acquisition Workshop.
Indianapolis, IN (December 2) - Indianapolis NWS
Olivia Kellner will be meeting with the Indianapolis National Weather Service office to discuss climate science opportunities and resources with the MRCC.
Muncie, IN (December 3) - Ball State University Olivia Kellner will be meeting with Ball State Univerisity’s Geography and GIS programs to discuss climate science opportunities with the MRCC.
Alexandria, IN (December 4) - Purdue University
Olivia Kellner will be presenting at Purdue University’s Crop Production Clinic on climate topics and MRCC resources.
San Francisco, CA (December 14) - American Geophysical Union Annual Meeting
Beth Hall will be presenting a poster, "Identifying Decision-Support Tools To Bridge Climate and Agricultural Needs in the Midwest", at the American Geophysical Union’s annual meeting.
Kansas City, MO (December 16-17) - Risk Management Agencies
Mike Timlin will be attending a Risk Management Agency meet-and-greet with regional climate service providers.
New Orleans, LA (January 10-14) - American Meteorological Society Annual Meeting
Beth Hall, Mike Timlin, Nancy Westcott, Olivia Kellner, and Bryan Peake will be attending the American Meteorological Society’s (AMS) annual meeting, including the Applied Climatology Conference.
Ann Arbor, MI (January 12-14) - Great Lakes Environmental Research Laboratory
Molly Woloszyn will be meeting with other Great Lakes Sea Grant Network partners at the Great Lakes Environmental Research Laboratory (GLERL) for a mid-project meeting for the Coastal Hazard and Resilience Project (CHARP).
Email us your local climate impacts! We are constantly keeping a log of how climate is impacting
our region, and our information would not be complete with YOUR help!
Have something to share as a feature article in an upcoming The Climate Observer issue, or
interested in being contacted for an article interview? Please let us know!


 It has been a warm fall in the Midwest. September was above average across the region, ranking as the 2nd warmest on record (1895-2015) for the region as a whole, with the northern states of Minnesota, Wisconsin, and Michigan each setting a new statewide record for the month. October averaged slightly above normal with some colder weather offsetting a very warm second week of the month. This brought the September-October temperatures to a rank of 10th warmest, with six of nine states ranking among the 10 warmest for the same period.
  The Storm Prediction Center’s
  Champaign, IL (November 20-21) - Illinois Mosquito & Vector Control Assn.