On the Road: MO IA WI - MRCC Spring Regional Road Trip NJ - AASC Annual Meeting IL - Resiliant Chicago
Workshop SD - Natl. Assn. of County
Agricultural Agents
Active 2015 Spring Fire Season Across the Eastern Area
Stephen Marien, Eastern Area Fire Weather Program Manager, National Park Service
The Palsburg Fire in Minnesota, which burned more
than 4,500 acres in Roseau County, started April 15,
2015. Photo courtesy James Silverstone.
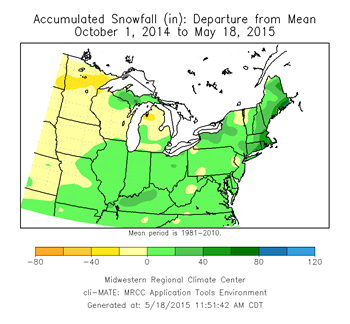
A busy spring fire season occurred over portions of the Great Lakes, Northeast and Mid-Atlantic states during the spring of 2015. The previous two spring fire seasons across the eastern U.S. were relatively quiet due to frequent precipitation events. The 2014-15 winter season produced below normal snowfall/snow depths across much of the Great Lakes southward into parts of the Mississippi Valley, and above normal snowfall/snow depths over the Northeast (snowfall departure map below). Well below normal temperatures affected much of the eastern U.S. through the winter of 2014-15.
Accumulated Snowfall, Departure from Mean beginning October 1, 2014. Map provided by cli-MATE (MRCC's online climate data system).
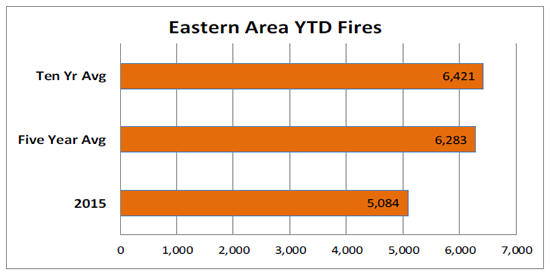
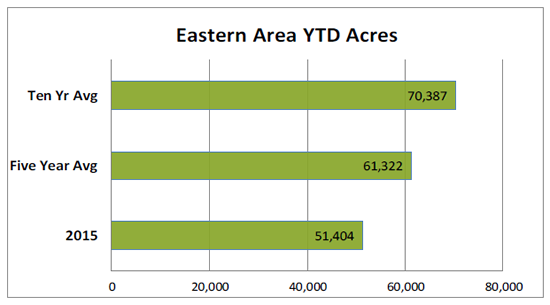
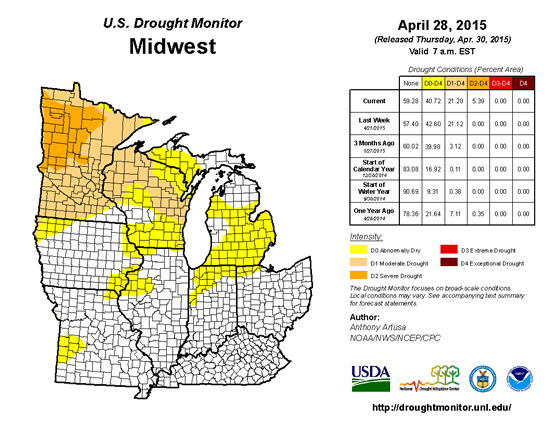
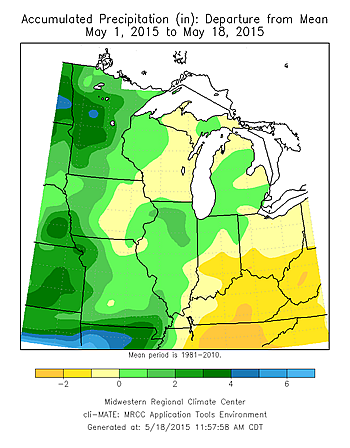
Drier than normal conditions persisted into April and May over the Great Lakes into parts of the Northeast and Mid-Atlantic States, leading to moderate to severe drought conditions (Drought Monitor figure below). Periods of warm temperatures and lower than normal relative humidity levels in the teens prevailed in April into early May. These conditions led to elevated fire activity, especially over Minnesota, the lower peninsula of Michigan, parts of the Northeast, and the eastern Mid-Atlantic States. Precipitation events increased quite a bit over the Upper Mississippi Valley through the first part of May moderating overall fire potential across drier portions of the western Great Lakes (May precipitation figure below, right). Overall, the 2015 spring fire season was closer to normal when compared to the quiet previous two seasons. Numbers of fires and reported acreage during the 2015 Eastern Area spring fire season were close to 5 and 10 year averages.
Fires in the Eastern Area, averages compared to 2015 year-to-date.
Acres burned in the Eastern Area, averages compared to 2015 year-to-date.
U.S. Drought Monitor conditions for the Midwest as of April 28, 2015.
Precipitation departure from mean (in.) for May 1-18, 2015.
The Eastern Geographic Area is comprised of 20 states in the northeast quarter of the country, north of the Ohio and along and east of the Mississippi River. The Eastern Area spring fire season generally begins in the southern tier of the region in mid-March into April and then progresses northward into the Great Lakes and New England from April into May. Once fuels green up from south to north, spring fire season usually ends unless moderate to severe drought develops or persists into the summer. Summer fires are less common across the Eastern Area unless fine fuels (e.g., grasses) dry to the point of ignition vulnerability due to prolonged unusually warm and dry periods.
Eastern Area fire ignitions are generally caused by humans, but occasionally lightning ignitions occur over the northern tier of the Eastern Area when dry conditions exist. For more information about the outlook for upcoming fire potential in the Midwest and Eastern regions, see these Monthly/Seasonal Outlook Maps.
For more information on this article, please contact Stephen Marien via email at stephen_marien@nps.gov
Federal Climate Programs:
How They Differ and Complement Each Other
Beth Hall, Molly Woloszyn, and Mike Timlin
If you are interested in climate monitoring tools, resources, science, and data, it may have seemed like the various climate programs across federal agencies are overlapping and possibly redundant. Or, perhaps you thought they were all the same program and are now confused with the notion that there is more than one climate program in the United States. The confusion is broadly felt. For example, its is not uncommon to confuse the Midwestern Regional Climate Center (MRCC), with other climate organizations such as NOAA’s Regional Integrated Sciences and Assessments (RISA) programs or even the Department of Interior’s Climate Science Centers. This article will provide a quick guide to what makes each program unique and how, together, they are meeting the climate needs of various stakeholders across the country.
Before itemizing the differences, however, there is a broad theme that is shared across all of these programs. Each is concerned about climate and its impacts on society and the environment. Investigating historical climate data to identify key relationships, monitoring current conditions for comparisons to our past, considering how our climate has and could change, and strategies to mitigate or adapt to the changes are overarching interests.
In addition, the federal climate programs do their best to work in concert to meet the climate needs of the nation, leveraging each other’s work to avoid duplicate efforts. For example, in March 2014, the MRCC hosted a workshop in Champaign, Illinois with representation from each of these programs. The workshop elevated awareness of climate activities, projects, and services currently operating in the Midwest, and provided the opportunity to coordinate efforts for future activities.
The following will hopefully clarify each program’s history and what makes each of them different.
Regional Climate Service Directors (RCSDs) Website: http://ncdc.noaa.gov/rcsd Established: 2010 Locations: 6 (see Figure 2), aligned with National Weather Service regions Key Focus: To support the development and delivery of a wide range of place-based climate science and information products and services to help people make informed decisions. RCSDs regularly communicate with stakeholders about climate information needs, and help distribute NOAA climate data information and resources.
Regional Climate Centers (RCCs) Website: http://www.ncdc.noaa.gov/customer-support/partnerships/regional-climate-centers (MRCC: http://mrcc.isws.illinois.edu) Established: Early-to-mid 1980s Locations: 6 (see Figure 3) Key focus: Engaged in the production and delivery of climate data, information, and knowledge for decision makers and other stakeholders. The RCC’s support NOAA's efforts to provide operational climate services, but with a focus on regionally specific issues.
American Association of State Climatologists (AASC) Website: http://stateclimate.org/ Established: 1976 Locations: 47 states and Puerto Rico (see Figure 4) Key focus: Providing historical climate data and climate monitoring tools and information for their state.
Regional Integrated Sciences and Assessments (RISA) Website: http://cpo.noaa.gov/Meet-the-Divisions/Climate-and-Societal-Interactions/RISA/About-RISA Established: 1995 Locations: 11 (see Figure 5) Key Focus: RISA supports research teams that help expand and build the nation’s capacity to prepare for and adapt to climate variability and change. RISA teams work to i) advance understanding of policy, planning and management context, ii) develop knowledge on impacts, vulnerabilities, and response options through interdisciplinary research and participatory processes, iii) develop innovative products and tools to enhance the use of science in decision making and iv) test diverse governance structures for managing scientific research.
Climate Science Centers (CSCs) Website:http://www.doi.gov/index.cfm Established: 2010 Locations: 8 (see Figure 6) Key Focus: To provide fundamental scientific information, tools, and techniques that land, water, wildlife, and cultural resource managers and other interested parties can apply to anticipate, monitor, and adapt to climate change impacts. Much of the information and tools provided by the CSC’s serve the landscape-level priority needs identified by the Landscape Conservation Cooperatives, as well as the cross-sector needs of other agencies and communities in the region, including physical and biological research, ecological forecasting, and multi-scale modeling.
Landscape Conservation Cooperatives (LCCs) Website: http://lccnetwork.org/ Established: 2010 Locations: 22 (see Figure 7), delineated along ecological regions Key Focus: Develop and provide integrated science-based information about the implications of climate change and other stressors for the sustainability of natural and cultural resources. Roles of the LCC’s include developing tools and strategies to inform landscape-scale planning and management decisions, linking science to management, and providing a forum for national and international conservation planning. Common issues for the LCC’s include: biological carbon sequestration, climate impacts on agriculture and grazing, forest resilience, habitat fragmentation, invasive species, migratory fish and wildlife response to climate change, protection of Native American cultural resources, protection of trust species, sea-level rise and coastal erosion, water availability and water quality, wildland fire, and wildlife disease.
USDA Climate Hubs Website:http://www.usda.gov/oce/climate_change/regional_hubs.htm Established: 2014 Locations: 7 main hubs, 3 sub-hubs (see Figure 8) Key Focus: The Climate Hubs are designed to provide coordinated technical support to USDA conservation, agriculture, and natural resource programs to ensure continued delivery of USDA services in the face of climate change (challenges associated with drought, heat stress, excessive moisture, longer growing seasons, and changes in pest pressure). The hubs provide periodic regional assessments of risk and vulnerability in the production sector, and provide accessible regional data and interpret climate change forecasts for hazard and adaptation planning. In addition, the hubs operationalize science by providing outreach and extension to farmers, ranchers, and forest landowners on science-based risk management, mainly through partnerships with land grand universities, Extension, and the private sector.
For more information on this article, please contact Beth Hall via email at bethhall@illinois.edu.
Spring rainfall across the Midwest has ranged from well below normal in Minnesota to well above normal in Kentucky. During March and April, drought conditions expanded across most of Minnesota and northern Wisconsin due to sparse rains on top of the already dry soils. Drought expanded to cover about 90% of Minnesota and 50% of Wisconsin, with 30% of the drought in Minnesota classified as severe (D2). From February to April, Kentucky was wet, wiping out drought conditions which covered half the state in February. February precipitation in Kentucky was a mix of above and below normal, but snowfall was well above normal across the state due to very cold conditions. Both March and April were well above normal precipitation months in Kentucky with 150% to 200% of normal across large swaths of the state.
Early May has seen a reversal of the pattern with Kentucky being drier than normal over the first half of the month while Minnesota was doused with significant rains in the second week of the month. Those rains have stemmed the drought expansion and even slightly lowered drought designations in the western part of the state. Read more…
Climatology studies of weather phenomena can be quite informative regarding the variation and trends in weather features, and useful in determining the range of extreme conditions. What climatologies have been pursued in the central United States? What havoc has been wreaked by these various weather features – on human health, landscapes, infrastructure, crops, and transportation? Here is a handy reference of climatologies and impact studies for the central U.S. for weather phenomena like heavy rain, snow, wind, fog, ice storms, tornadoes, lightning, and others. The studies provide information on the spatial and temporal characteristics, as well as the impact potential of various weather phenomena. If any of your favorite climatologies are missing from this compilation, email nan@illinois.edu so they can be shared.
The Southern Regional Climate Center's Climate Extremes Portal displays daily temperature and precipitation records for airport stations throughout the United States. Four types of records are available for selection: all-time records for each month, all-time records across all months, current daily records, and new records set on a given day (limited to within the past six months). There are five types of variables available to display: low minimum temperature, high minimum temperature, low maximum temperature, high maximum temperature, and high precipitation. Once selections have been made, the records will appear on the map. You can pan and zoom the map, as well as display certain ranges. Placing your mouse over an icon will reveal the station name, date of occurrence, and period of record for the station; the precipitation product will also include the complete daily value. It is important to note that different stations have different periods of record. This must be taken into account when assessing records for adjacent stations and assessing the significance of a particular warm, cold, or high precipitation event.
Missouri, Iowa, and Wisconsin (June 8-12) - MRCC Spring Regional Road Trip
Beth Hall and Bryan Peake will be hitting the road in early June to meet with interested stakeholders and partners to talk about NOAA data, MRCC online tools, and other resources the MRCC offers (or could offer). If you’re in any of these states during this week and would like the MRCC to stop by, please contact Beth Hall (bethhall@illinois.edu).
Cape May, NJ (June 23-26) - American Association of State Climatologists (AASC) Annual Meeting
Mike Timlin, Beth Hall, and Nancy Westcott will be attending the annual AASC meeting that brings together the various state climatologists and the Regional Climate Centers (RCCs). The meeting is an opportunity for everyone to get up-to-date on the work of others, as well as to discuss plans for the coming year or two. The other RCCs and the state climatologists are among our closest partnerships and this is a great opportunity to network with many of them.
Chicago, IL (July 8) - Resilient Chicago Workshop
Molly Woloszyn is co-organizing a Resilient Chicago workshop, which is geared towards municipalities, and will cover the topic of urban flood management through a No Adverse Impact approach and green infrastructure. Workshop organizers include Illinois-Indiana Sea Grant, the Association of State Floodplain Managers, Illinois Department of Natural Resources, and the MRCC.
Sioux Falls, SD (July 12-16) - National Association of County Agricultural Agents Annual Meeting (NACAA)
Beth Hall is attending the NACAA annual meeting to present information about the MRCC’s Vegetation Impact Program and other MRCC resources that may be useful for county agricultural agents.
Email us your local climate impacts! We are constantly keeping a log of how climate is impacting
our region, and our information would not be complete with YOUR help!
Have something to share as a feature article in an upcoming The Climate Observer issue, or
interested in being contacted for an article interview? Please let us know!


 Accumulated Snowfall, Departure from Mean beginning October 1, 2014. Map provided by cli-MATE (MRCC's online climate data system).
 Precipitation departure from mean (in.) for May 1-18, 2015.


 Spring rainfall across the Midwest has ranged from well below normal in Minnesota to well above normal in Kentucky. During March and April, drought conditions expanded across most of Minnesota and northern Wisconsin due to sparse rains on top of the already dry soils. Drought expanded to cover about 90% of Minnesota and 50% of Wisconsin, with 30% of the drought in Minnesota classified as severe (D2). From February to April, Kentucky was wet, wiping out drought conditions which covered half the state in February. February precipitation in Kentucky was a mix of above and below normal, but snowfall was well above normal across the state due to very cold conditions. Both March and April were well above normal precipitation months in Kentucky with 150% to 200% of normal across large swaths of the state.
 Climatology studies of weather phenomena can be quite informative regarding the variation and trends in weather features, and useful in determining the range of extreme conditions. What climatologies have been pursued in the central United States? What havoc has been wreaked by these various weather features – on human health, landscapes, infrastructure, crops, and transportation? Here is a handy reference of
  The Southern Regional Climate Center's
  Missouri, Iowa, and Wisconsin (June 8-12) - MRCC Spring Regional Road Trip