On the Road: IL - Naturally Illinois Expo
IL - American Assn. of Geographers IL - American Society of Agricultural and Biological Engineers MN - AMS Fire and Forest Meteorology Conference MO - National Adaptation
Forum
High Resolution Drought Monitoring
Rebecca Cumbie, Extension Climatologist,
State Climate Office of North Carolina
Drought monitoring increasingly takes place on smaller and smaller scales, intensifying the demand for localized information. To meet this growing need, McRoberts and Nielsen-Gammon (2012) developed a computational procedure for calculating the Standardized Precipitation Index (SPI) that incorporates high-resolution, radar-based estimates of precipitation.
The SPI is a precipitation-based drought index that relates the amount of precipitation falling over a given interval of time to its historical probability. SPI has several key advantages for drought monitoring, namely its ability to be calculated on any timescale, provided sufficient data is available, giving it the ability to monitor simultaneously-occurring conditions at different time scales. Additionally, SPI values are normalized to the historical record at a specific location, meaning both wet and dry periods can be monitored and SPI values at different locations can be compared without modification.
The SPI calculation methodology developed by McRoberts and Nielsen-Gammon (2012) incorporates daily gridded precipitation estimates from the National Weather Service’s (NWS’s) Advanced Hydrologic Prediction Service (AHPS), monthly precipitation normals from the Parameter-elevation Regression on Independent Slopes Model (PRISM), and historical gauge data from the NWS Cooperative Observer Program (COOP) network. McRoberts and Nielsen-Gammon (2012) developed and evaluated this SPI calculation methodology over Texas. In partnership with Texas A&M University and Purdue University, NC State University was granted funding to expand this work to more regions, evaluate its performance, and develop a web-based interface for users to access and interact with the resulting SPI grids. Development was supported by USDA National Institute of Food and Agriculture (NIFA) and National Integrated Drought Information System (NIDIS), and ongoing support for future work is provided by NOAA Climate Program Office (CPO).
High Resolution Drought Tool Website
A website was developed for viewing and interacting with the SPI data. New SPI grids are generated daily and are typically available by 12pm EST. Having new grids each day allows climatologists, meteorologists, water managers, and others to monitor conditions as they evolve. The sub-county detail provided by the product yields valuable information about local conditions, and helps identify areas that may be experiencing degradation or improvements. To see this tool in action, go to: http://mrcc.isws.illinois.edu/cliwatch/drought/droughtTriggerTool.jsp.
When users first come to the webpage, they are presented with a map displaying the SPI, with information about the date, timescale, and legend at the bottom of the map. On the left is a menu where users can change the location, date, and timescale. Clicking ‘Submit Options’ will redraw the map with the new selections.
Beneath this menu is a layer switcher where users can choose between displaying four different gridded layers: SPI, SPI Blend, percent of normal precipitation, and accumulated precipitation. Additional boundary layers as well as the US Drought Monitor map and accumulated surface gauge precipitation from NWS COOP stations can be overlaid. This gives users the ability to cross-reference the gridded products with the current U.S. Drought Monitor (USDM) depictions and surface observations, allowing users to make a more informed determination about the current severity and extent of dryness. All these options can be “saved” by clicking the “Bookmarkable Link” link on the lower left of the page.
Users wishing to have more interaction with the SPI data can click the “Download GeoTIFF” link in the lower right corner of the map webpage to download a GeoTIFF, in geographic coordinates, of the map currently being viewed. This can easily be uploaded into ArcMap, Quantum GIS, or other GIS software.
In addition to viewing maps for their desired location, users can click on the map to place a marker and query for the SPI (or other gridded layer) value at that particular grid point. This will also produce a link that will take users to a page where the time series of SPI for the particular grid point can be viewed.
On the times series page (below), users can mouse-over the graph to see values and click-and-drag to zoom in. Links to the lower right of the graph can be used to download the time series data as a comma-separated list or image as a PNG. Like the map page, the time series page has various options that can selected and even bookmarked.
More advanced users can access the SPI grids, which are stored as NetCDF files, on a THREDDS server housed by the State Climate Office of North Carolina. Grids can be accessed via HTTPS or NetCDF subset service (for downloading), WMS and WCS for viewing in web- or GIS-based applications, or query grids using OPeNDAP for ASCII or binary data.
What’s Next?
The SPI grids discussed here are incorporated into the drought monitoring process by various states and regional centers. These maps are able to provide valuable localized detail often missed by similar products that rely solely on surface gauge observations. Work continues to generate more high-resolution drought indices using gridded estimates of precipitation and temperature. The Standardized Precipitation Evapotranspiration Index, Keetch-Byram Drought Index, and Palmer Drought Indices are all actively being developed. Once these have been evaluated, they will be added to the website.
In addition to adding more drought indices to the website, the high resolution SPI, and any future indices, will be compared to indicators of drought conditions, such as soil moisture, streamflow, and vegetative health. Tying SPI values to a specific impact will allow the index to be used as a “trigger” to give notice that conditions may be deteriorating.
Acknowledgements and more information Development of the high-resolution SPI grids over the contiguous US was supported by USDA NIFA and NIDIS, and ongoing support for future work is provided by NOAA CPO. We would like to acknowledge the National Weather Service and the PRISM Climate Group for openly providing the datasets used in the calculations of the drought indices found within this tool.
Beth Hall, Director, Midwestern Regional Climate Center
The Midwestern Regional Climate Center (MRCC) has offered paid summer internships to college students for over a decade. Most often, these students have majored in an atmospheric science discipline. Recently, however, the MRCC has recognized the benefits of hiring students seeking interdisciplinary foci (e.g., computer science, social science) who often include an interest in atmospheric science – in particular, climatology. These internships have provided students with an opportunity to work directly with historical atmospheric data and realize the diverse applications and needs of acquiring, maintaining, and analyzing these data. From serving the public’s need for climate information, to participating in applied climate research, to contributing to the development of tools and resources for accessing and interpreting climate data, summer interns gain an appreciation for the field of climate sciences.
The Urbana, Illinois cooperative weather station (118740) at the Illinois State Water Survey. Photo courtesy Jim Angel, Illinois State Climatologist.
The MRCC is located within the Climatology and Atmospheric Sciences Section (CASS) at the Illinois State Water Survey (ISWS). In 2008, the ISWS became a Division of the Prairie Research Institute of the University of Illinois at Urbana-Champaign. With a fully equipped, fully functional weather observing site in its backyard, the MRCC and ISWS not only get to experience the reward of contributing to a long history of climate data for a location, but also realize the complexity and challenges that data collection carries in terms of quality control.
The MRCC is one of 6 Regional Climate Centers across the United States that has been supported through federal funds since the early 1980s. Its mission has four components:
Provide high-quality climate data, derived information, and data summaries for the Midwest region
Monitor and assess regional climate conditions and their impacts
Prepare specialized historical climate data sets
Coordinate and conduct applied research on climate-related issues and problems
Student interns have the opportunity to help support in the MRCC Climate Service Office and/or provide support on an applied climate or climate monitoring project. Past projects have covered topics from examining climate teleconnection relationships to widespread drought, using climate data to study and compare heat waves in Chicago, identifying extreme precipitation events that have impacted major metropolitan areas, to improving the metadata records of national climate datasets. Several MRCC interns have even had the opportunity to present his or her applied climate internship project at professional conferences. Three current MRCC climatologists were former MRCC summer interns and other past interns have gone on to pursue and succeed in careers within the climatology and atmospheric sciences.
Figure from a former MRCC intern's applied climate project on comparing the severity of heat waves in Chicago. This project was presented by the intern at the 2013 American Meteorological Society meeting.
This summer, the MRCC is seeking two summer interns. Both interns will have the opportunity to contribute to applied climate research or monitoring projects. One of the positions will also help support the MRCC Service Office, while the other position will be challenged with product development through the use of programming, design, and/or implementation skills. Position announcements for the 2015 MRCC Summer Internship opportunities can be found at the links below. Please email Beth Hall (bethhall@illinois.edu) for more information.
The Midwest was hit with very cold temperatures in February; the coldest since 1979. The month ranked among the coldest Februarys for the region, and tied for 7th coldest (1895-2015 records). Statewide rankings ranged from 2nd coldest in Ohio and 3rd coldest in Michigan to 18th coldest in Minnesota. The latter part of February was particularly cold. The cold conditions in February contributed to colder than normal winter temperatures for most of the Midwest.
Most of the Midwest was drier than normal in February. Areas wetter than normal were limited to Kentucky, Iowa, and the northern fringes of the Midwest, while deficits of 0.5 inches or more were common in the rest of the region. Despite the low precipitation totals, snowfall totals were above normal for much of the region in February. The southern two-thirds of the Midwest had above normal snowfall; more than a foot above in some parts. The northern third of the Midwest was mixed, with some above- and some below-normal snowfall totals. Read more...
MRCC’s Vegetation Impact Program Freeze Maps The last spring freeze starts the growing season each year and is monitored by NWS personnel, farmers, and gardeners. The MRCC’s Vegetation Impact Program offers freeze maps, which track the most recent freeze events (32°F and 28° thresholds) across the United States, with the maps updating each day. The freeze maps offer useful maps for tracking the last spring freeze, including maps for the date of the most recent freeze, days since the most recent freeze, and number of freezing days over the last two weeks (click on the maps to zoom in!). There are also 32°F and 28°F climatology maps (1981-2010) available on the same page. For a more interactive version and specific data, check this out on the GIS map interface!
U.S. Climate Reference Network Data Visualization Tools
The Cooperative Institute for Climate and Satellites-North Carolina (CICS-NC) recently developed a suite of tools for quickly and easily displaying United States Climate Reference Network (USCRN) data from across the contiguous United States. The USCRN is a network of very high-quality climate monitoring stations maintained by the National Oceanic and Atmospheric Administration (NOAA) and managed through NOAA’s National Climatic Data Center. The new USCRN Data Visualization Tools provide graphics for the current USCRN observations for temperature, ground temperature using an infrared sensor, incoming solar radiation, relative humidity, soil temperature and moisture (5, 10, and 20cm), as well as a derived product for frost depth.
Champaign, IL (April 17-18) – Naturally Illinois Expo
The entire staff of the MRCC will be participating in the 2015 Naturally Illinois Expo, presented by the Prairie Research Institute (University of Illinois). Families, teachers, and students of all ages attend to enjoy exhibits, demonstrations, and hands-on activities that showcase the work of the Institute and State Scientific Surveys. The MRCC will be providing live rainfall runoff demonstrations, as well as additional handouts for other in-classroom or at-home weather activities!
Chicago, IL (April 21-25) - American Association of Geographers
Dr. Nancy Westcott will be presenting a poster on historical climate data at the American Association of Geographers annual meeting.
Chicago, IL (May 3-5) - American Society of Agricultural and Biological Engineers
Olivia Kellner will be attending the American Society of Agricultural and Biological Engineers first Climate Change Symposium on Adaptation and Mitigation. It will emphasize the importance of global climate change impacts on agriculture while covering a range of topics related to climate change impacts on land and water resources.
Minneapolis, MN (May 4-8) - AMS Fire and Forest Meteorology Conference
Dr. Beth Hall will be presenting on an operational hourly fire danger monitoring tool at the American Meteorological Society's Firest and Forest Meteorology Conferece.
St. Louis, MO (May 12-14) - National Adaptation Forum
Dr. Beth Hall will be participating in a session called “Coordinating Across Federal Agencies in the Great Lakes and Midwest Regions” during the National Adaptation Forum. Molly Woloszyn will also be attending and presenting a poster on recent climate adaptation work in the Chicago region. On the 11th, Molly will also be meeting with fellow Sea Grant educators across the country for the Sea Grant Climate Network meeting.
Email us your local climate impacts! We are constantly keeping a log of how climate is impacting
our region, and our information would not be complete with YOUR help!
Have something to share as a feature article in an upcoming The Climate Observer issue, or
interested in being contacted for an article interview? Please let us know!


 Drought monitoring increasingly takes place on smaller and smaller scales, intensifying the demand for localized information. To meet this growing need, McRoberts and Nielsen-Gammon (2012) developed a computational procedure for calculating the Standardized Precipitation Index (SPI) that incorporates high-resolution, radar-based estimates of precipitation.


 The
The 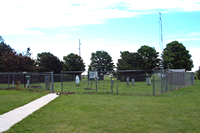
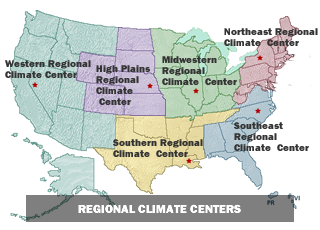 The MRCC is one of 6 Regional Climate Centers across the United States that has been supported through federal funds since the early 1980s. Its mission has four components:
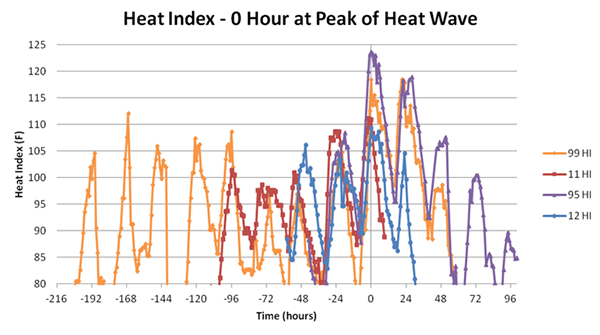
 The Midwest was hit with very cold temperatures in February; the coldest since 1979. The month ranked among the coldest Februarys for the region, and tied for 7th coldest (1895-2015 records). Statewide rankings ranged from 2nd coldest in Ohio and 3rd coldest in Michigan to 18th coldest in Minnesota. The latter part of February was particularly cold. The cold conditions in February contributed to colder than normal winter temperatures for most of the Midwest.
 MRCC’s Vegetation Impact Program Freeze Maps
 U.S. Climate Reference Network Data Visualization Tools
  Champaign, IL (April 17-18) – Naturally Illinois Expo