On the Road: MO - Climate Diagnostics
and Prediction Workshop IL - Illinois GIS Association
Annual Meeting IL - Cook County Dept.
of Homeland Security and
Emergency Management Geneva - World
Meteorological Organization
meeting in Switzerland IL - World of Science Series IL - Illinois Mosquito and
Vector Control Meeting
The Many Faces of Climate Change: Resilient Chicago Highlights
On September 30th, the Midwestern Regional Climate Center (MRCC), along with Illinois-Indiana Sea Grant (IISG), the Chicago Metropolitan Agency for Planning (CMAP), and the Illinois State Climatologist Office hosted the Resilient Chicago: Climate Planning for the Future workshop in downtown Chicago, IL at CMAP. The one-day workshop included presentations and discussion on adapting to temperature, extreme precipitation (flood and drought), and ecosystem changes in northeastern Illinois. The workshop also included an overview of historical climate trends and future projections based on the 2014 National Climate Assessment. In addition, workshop attendees learned how to incorporate climate adaptation planning into their current community plans, as well as how to address the challenges of adaptation planning. View the agenda to the workshop here, or to learn more about the workshop and to find post-workshop resources (coming soon!), visit the Resilient Chicago website.
IISG’s science writer, Anjanette Riley, attended the Resilient Chicago workshop and had this to say about the event:
"Presentation after presentation, what struck me most is just how much climate change already is and will continue to impact our daily lives—and how interconnected those impacts are. Actually, a quick glance at the agenda was all it took to realize this workshop was going to be about much more than just predictions of yearly rainfall or average temperatures. The speakers were climatologists, public health experts, community planners, and policy specialists. And the participants were just as diverse—educators, urban planners, local officials, and private consultants.
Of course, we did talk about climate concepts and trends. IISG’s Molly Woloszyn kicked things off by making sure we were all on the same page about the difference between weather and climate—short-term changes vs. long-term averages. And throughout the day, Illinois State Climatologist Jim Angel told us that temperatures have risen by roughly 1.5°F over the last century and that we can expect drier summers and more precipitation in winter, spring, and fall.
Annual temperature difference from average (red line) for Chicago O’Hare Airport (trend line in black)
Much of the day, though, was dedicated to what these changes mean for the people and wildlife that call the Chicago area home. Some impacts are pretty straightforward—you have likely seen them already. Warmer temperatures mean greater strain on an aging energy infrastructure and higher rates of heatstroke. Wetter springs means more stormwater runoff and basement flooding. And summertime droughts could lower crop yields and increase food prices.
Many were hard to see at first glance. As nice as they sound to many of us, warmer winters could have serious repercussions for public health, infrastructure, and Great Lake ecosystems. For example, with less frequent deep freezes, some disease-carrying insects could persist throughout the year. Fluctuations between freezing and thawing will also create more potholes and cracks in building exteriors. And—most unexpected to me—warmer water temperatures could make Lake Michigan and surrounding waterways more welcoming to a whole new suite of invasive species that could never have lived there before.
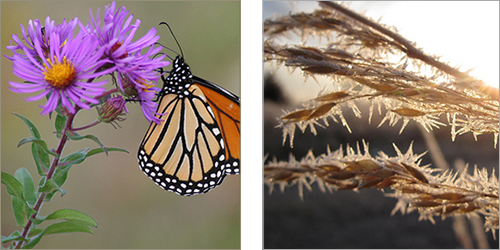
Fortunately, presenters came armed with solutions as well. Most were adaptation strategies—steps to prepare for climate change impacts. Speakers from Chicago Wilderness, the Alliance for the Great Lakes, and Hey and Associates, for example, showed how planting native trees and plants, building rain gardens, and restoring natural areas could simultaneously filter pollutants from stormwater, lower air temperatures, and reconnect habitats divided by urbanization. Samuel Dorevitch, a professor at the University of Illinois at Chicago, and Dan Gabel from ComEd talked about the importance of early warning systems and emergency response plans. And the Center for Neighborhood Technology’s Harriet Festing introduced their Rain Ready program, which helps homeowners and communities understand flooding causes and prepare for future storms."
Native plants for the region: New England aster (left) and Indian Grass (right)
(photo credit: Chicago Wilderness/Greg Thompson and B. Jones, USFWS)
Initial feedback from workshop attendees has been very positive. Many workshop attendees said one of their favorite parts about the workshop was the keynote speaker, Joyce Coffee, who is the managing director of the Notre Dame Global Adaptation Index (ND-GAIN). Other feedback included offering the workshop annually to get the most up-to-date information or more focused workshops (e.g. on extreme precipitation adaptation only).
All presentations from the workshop and other resources will soon be available on the Resilient Chicago website.
For more information on this article, please contact Molly Woloszyn via email at mollyw@illinois.edu.
Dr. Barbara Mayes Boustead, National Weather Service
After months of toying with a potential developing El Niño, the Pacific Ocean is still holding its cards close to its chest. The NOAA/NWS Climate Prediction Center continues to call for about a 60-70% chance of El Niño developing this winter – or about 2-to-1 odds (Figure 1). If it does develop, it is most likely to be in the weak category, with a smaller chance to be moderate and only a very small chance to become a strong event.
Figure 1:
Consensus chances for El Niño, neutral, and La Niña conditions from Sep-Oct-Nov (SON) 2014
through May-Jun-Jul (MJJ) 2015, as of early October. Image courtesy of the International Research Institute for Climate and Society (IRI) and may be found at http://iri.columbia.edu/our-expertise/climate/forecasts/enso/.
After all of this card-counting, why are climatologists still playing the game? In other words, what is it about El Niño that makes us want to pay attention to whether it will develop and how intense it potentially could become?
The answer: Because El Niño stacks the deck, so to speak, with winter weather across the United States. In moderate to strong El Niño events, the deck is stacked more reliably. The effects on winter weather are usually more predictable and more distinct. During weak El Niño events, the deck is stacked just slightly and not as reliably, making its effects harder to discern. Whether weak or strong, it’s important to remember that a loaded deck does not guarantee an outcome – it makes certain hands more likely and others less likely.
El Niño isn’t the only factor that affects winter weather in the central United States – there are a number of other influences that include other climate patterns, trends, and the randomness of weather itself. The reason that El Niño brings climatologists to the table is its predictability. Even with the uncertainty of El Niño development this year, it is one of the few climate signals that is predictable enough for climatologists to use when making winter weather outlooks and other seasonal outlooks. Climatologists have been watching for months to see if El Nino will stack the deck for the coming winter, and they’re still waiting to see if El Nino is “all-in”.
With all of that said, what kind of hand is favored when El Niño stacks the deck? What does an El Niño typically bring to the Midwest in the winter (Figure 2)?
Looking at the bigger picture across the United States, El Niño tends to drive the jet stream across the southern states, loading the deck there toward cooler and wetter conditions. Meanwhile, the northern branch of the jet stream tends to stay up in Canada, leaving the northern tier of the U.S. with odds tilted toward warmer conditions, with potentially drier conditions in the Ohio River Valley. In between, across the nation’s midsection, is a belt with a transition zone from warm tendencies north to cool tendencies south.
Much of the Midwest lies in that belt, the transition area with decks stacked toward warmth up north and toward cool and wet weather in the south. Sometimes, one of those decks “leaks” into the Midwest, but overall, El Niño has fewer predictable effects in that midsection than anywhere north or south of it.
Figure 3:
At Left is departure of average Dec-Jan-Feb temperatures during El Niño winters from
the average through the years 1950-2010, with orange colors indicating that past El Niños have
averaged warmer than
the average through the period, while green colors indicate that past
El Niños have averaged cooler.
Right: percent of average Dec-Jan-Feb precipitation during El Niño winters from the average
through the
years 1950-2010, with orange to red colors indicating that past El Niños have
averaged drier than the
average through the period, while blue colors indicate that past El Niños
have averaged wetter.
The collection of all El Niño events from 1950 to 2010 (the last El Niño), including all intensities from strong to weak, shows a deck stacked toward warmer conditions from the upper Midwest to around the mid-Mississippi and mid-Missouri River Valleys, with the odds tilting toward cooler conditions along and south of the Ohio River Valley. The deck also is stacked toward drier than average conditions across much of the Midwest in the winter months (Figure 3).
The effects of El Niño and other climate patterns on winter weather conditions is still an active area of research. In the meantime, there are several things that an El Niño cannot tell:
First freeze date in the fall (either early or late)
Last freeze date in the spring (either early or late)
Potential for ice storms or blizzards
Track or intensity of any single weather system
The Pacific Ocean will show its hand over the next month or two, revealing whether it was bluffing or an El Niño really is in the cards. As that and other climate signals become more clear, the climatologists at the NOAA/NWS Climate Prediction Center will gain confidence in determining if – and how – they think the deck is stacked for the coming winter. CPC’s official winter outlook, released in mid-October, is just a start, and climatologists will continue to monitor the signs and signals through the coming months.
As the growing season wrapped up in the Midwest, crops were reported to be in very good to excellent condition for a large percentage of the corn and soybean crops. Pastures were also doing well especially for this time of year. The abundant rainfall and cool temperatures this growing season meant largely favorable conditions for crops with little heat stress or drought. As of October 14th, the entire nine-state Midwest region was free of drought with only a few small pockets of abnormally dry according to the US Drought Monitor. Cool weather did delay maturity of crops, especially in the north where planting occurred later, so not all the news was favorable for farmers. Read more about crop conditions in the September 2014 monthly report.
The cool and wet conditions, and extensive ice cover last winter, also led to rising water levels on the Great Lakes. By the end of September, water levels in all five lakes were above average. Above average lake levels for all five lakes last occurred 15 years ago. The higher lake levels were unexpected after very low levels were recorded in the previous two years, especially on Lake Michigan/Lake Huron which were well below normal since the warm and dry 2012 spring and summer.
The Regional Mesonet Climate Monitoring Project (RMCMP) is a collaboration of multiple states and mesonet groups. It offers the opportunity to see the regional value of mesonet data when various networks are brought together.
The MRCC is proud to host operational product maps from various mesonet groups around its region, which are updated daily. Mesonets are a collection of observation stations that gather information about the environment such as atmospheric, soil, and moisture conditions (see the Summary Table of Midwest Mesonets on the Data Networks page). Mesonets are often developed to serve a particular audience such as a state’s agricultural community, but the data collected can often be valuable to other groups outside of their target audience.
The newClimate Patterns Viewer (CPV) from the Useful to Usable (U2U) project provides a way to connect global climate conditions with local climate impacts. The CPV provides a historical look at how the El Niño Southern Oscillation (ENSO) and Arctic Oscillation (AO) can influence local climate conditions and corn yield across the Corn Belt. You can use simple maps and charts to show when and where specific phases of ENSO or AO have influenced average monthly temperatures and precipitation, deviations of temperature and precipitation from 1981-2010 climate normals, and deviations of yield (in percent) from the de-trended 1981-2010 average yields.
St. Louis, Missouri (October 20-23) — Climate Diagnostics and Prediction Workshop
Mike Timlin will be attending the workshop and presenting information about new developments in the VIP Frost/Freeze Project during the afternoon session on the 20th.
Lisle, Illinois (October 28-29) — Illinois GIS Association Annual Conference Zoe Zaloudek will be attending the annual ILGISA conference at the end of October. She will give a presentation on script tools that have been created to assist in depth grid and floodplain delineation.
Chicago, Illinois (October 29) — Cook County Department of Homeland Security and Emergency Management Beth Hall and Molly Woloszyn will meet with Cook County DHSEM representatives to discuss next steps in partnering on the Reducing Flooding Vulnerability of Chicago Critical Facilities project.
Geneva, Switzerland (November 3-6) — Wold Meteorological Organization Meeting Nancy Westcott will chair a meeting of the WMO Commission for Climatology Expert Team on Data Rescue (ET-DARE).
Champaign, Illinois (November 7) — World of Science Series, Parkland College Molly Woloszyn will present at the World of Science Series, held at the Staerkel Planetarium at Parkland College, about the winter of 2013/14 and the upcoming season.
Springfield, Illinois (November 21) — Illinois Mosquito and Vector Control Meeting Nancy Westcott will speak on “Climatic Variation in West Nile Virus Incidence” at the meeting.
Email us your local climate impacts! We are constantly keeping a log of how climate is impacting
our region, and our information would not be complete with YOUR help!
Have something to share as a feature article in an upcoming The Climate Observer issue, or
interested in being contacted for an article interview? Please let us know!

 Departure")


 On September 30th, the Midwestern Regional Climate Center (MRCC), along with Illinois-Indiana Sea Grant (IISG), the Chicago Metropolitan Agency for Planning (CMAP), and the Illinois State Climatologist Office hosted the Resilient Chicago: Climate Planning for the Future workshop in downtown Chicago, IL at CMAP. The one-day workshop included presentations and discussion on adapting to temperature, extreme precipitation (flood and drought), and ecosystem changes in northeastern Illinois. The workshop also included an overview of historical climate trends and future projections based on the 2014 National Climate Assessment. In addition, workshop attendees learned how to incorporate climate adaptation planning into their current community plans, as well as how to address the challenges of adaptation planning. View the agenda to the workshop
 ")


 As the growing season wrapped up in the Midwest, crops were reported to be in very good to excellent condition for a large percentage of the corn and soybean crops. Pastures were also doing well especially for this time of year. The abundant rainfall and cool temperatures this growing season meant largely favorable conditions for crops with little heat stress or drought. As of October 14th, the entire nine-state Midwest region was free of drought with only a few small pockets of abnormally dry according to the US Drought Monitor. Cool weather did delay maturity of crops, especially in the north where planting occurred later, so not all the news was favorable for farmers. Read more about crop conditions in the
 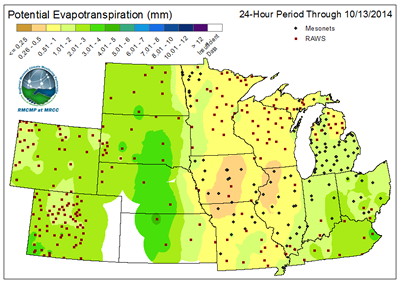 The
The  The new
  St. Louis, Missouri (October 20-23) — Climate Diagnostics and Prediction Workshop