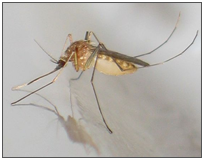
 Since the 2002 introduction of West Nile Virus (WNV) into Illinois, over 1,300 of the severe West Nile Neuroinvasive disease cases have occurred in Illinois, and Peterson (2013) estimated that over 200,000 WNV infections have occurred in persons 16 years of age or older. WNV activity in Illinois was greatest in 2002, 2005, 2006 and 2012, with moderate activity in 2007 and 2013. Generally, above average temperatures and below average precipitation in the summer months favors WNV, and cool and/or wet summer conditions are not as favorable for WNV. Several climate-based county models have been developed to help predict the onset of WNV in Illinois, one for Cook and DuPage counties (Ruiz et al. 2010) and one for Champaign County (Westcott et al. 2011). Results from the verification of these model predictions suggest that climate is indeed an important factor related to the timing and severity of WNV outbreaks. Since the 2002 introduction of West Nile Virus (WNV) into Illinois, over 1,300 of the severe West Nile Neuroinvasive disease cases have occurred in Illinois, and Peterson (2013) estimated that over 200,000 WNV infections have occurred in persons 16 years of age or older. WNV activity in Illinois was greatest in 2002, 2005, 2006 and 2012, with moderate activity in 2007 and 2013. Generally, above average temperatures and below average precipitation in the summer months favors WNV, and cool and/or wet summer conditions are not as favorable for WNV. Several climate-based county models have been developed to help predict the onset of WNV in Illinois, one for Cook and DuPage counties (Ruiz et al. 2010) and one for Champaign County (Westcott et al. 2011). Results from the verification of these model predictions suggest that climate is indeed an important factor related to the timing and severity of WNV outbreaks.
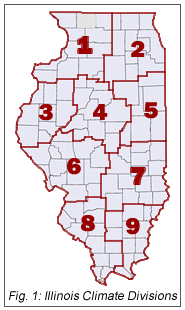 These two existing WNV models have been calibrated to their local areas, however, and WNV activity can vary throughout the state for a given year. For example in 2007 and 2013 when southern Illinois experienced their highest number of cases, there was only moderate activity in northeast Illinois. One possible cause of the difference in WNV activity is the variation in temperature and precipitation regimes across the state during any given summer. In order to help determine the impact of climate on WNV outbreaks across the state, the Midwestern Regional Climate Center (MRCC) has launched a new project that focuses on using tool development and research to create a real-time climate-based WNV Threat Tool for each of the nine Illinois Climate Divisions (Figure 1, right). These two existing WNV models have been calibrated to their local areas, however, and WNV activity can vary throughout the state for a given year. For example in 2007 and 2013 when southern Illinois experienced their highest number of cases, there was only moderate activity in northeast Illinois. One possible cause of the difference in WNV activity is the variation in temperature and precipitation regimes across the state during any given summer. In order to help determine the impact of climate on WNV outbreaks across the state, the Midwestern Regional Climate Center (MRCC) has launched a new project that focuses on using tool development and research to create a real-time climate-based WNV Threat Tool for each of the nine Illinois Climate Divisions (Figure 1, right).
A preliminary graphical tool was launched in June 2014, available from the Illinois State Water Survey’s MRCC research web site. Click on an individual Climate Division to see the graphics for that region. Currently, a user must compare the current weather parameters with historical parameters to determine whether this might be a high or low WNV case year. It is expected that when temperatures are above normal in June, July, and August, and when there are long periods with little precipitation during the same period, there will be an increased WNV threat.
This tool is expected to change in design and in content over the next year, and is not meant to replace the two county-based models. A long range goal is to develop an empirically-based WNV Threat Index for use in future years. Both the graphical model and the future WNV Threat Index (will) use daily values of a) accumulated temperature departure from normal (ATD) and b) accumulated precipitation departure from normal (ADP), plus 10-day forecasted (dotted) ATD and 3-day forecasted APD (Figure 2).
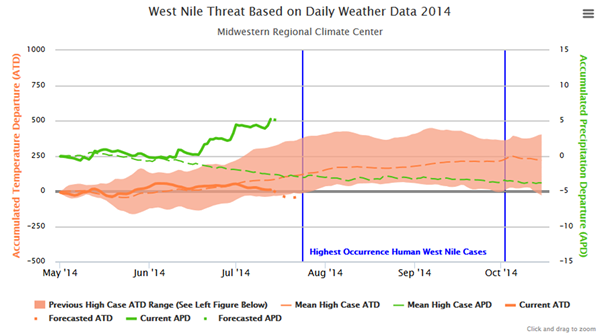
Figure 2. For Climate Division 2 (northeast Illinois): current (bold solid, as of 07/14/2014)
and mean (dashed) ATD and ATP values
When ATD is above the zero line (hot temperatures), particularly in July and August, and APD is below the zero line or steadily decreasing (dry or drying conditions) in July and August, a higher incidence of WNV is expected (Figure 3).

Figure 3. For Climate Division 2 (northeast Illinois): ATD and APD values for years with a high number of WNV cases. An increased risk of human WNV cases is associated with ATD values above the zero line (hot) and APD values below the zero line (dry) and/or steadily decreasing (drying), particularly in July and August.
Cold summers tend to have a late onset of WNV. Wet summers often result in a lower incidence of WNV (Figure 4). The Statistical Modeling Branch of the Meteorological Development Laboratory of the National Weather Service Office of Science and Technology provided the climate division forecast data.

Figure 4. For Climate Division 2 (northeast Illinois): ATD and APD values for years with a low number of WNV cases. Lower risk of human WNV cases is associated with APD values above the zero line and/or increasing (wet conditions), particularly in July and August.
Currently, the WNV Threat Index tool does not provide any information on the timing of the peak in human WNV cases. However, in the near future, an important change to the tool will be the inclusion of real-time WNV-positive mosquito case data. The mosquito sample data will be provided by the Illinois Department of Public Health and can be a good predictor of the peak in human samples.
Differences in environmental conditions (mosquito habitat), differences in human and bird behavior, the impact of mosquito abatement, and differences in the target human population may also impact the frequency of WNV cases. While not a guarantee, it is hoped that this experimental tool will help indicate the current years’ severity of WNV threat throughout Illinois. The models will be fine-tuned this summer and next. To help make the tool more user-friendly, send in questions and comments to nan@illinois.edu.
The Illinois WNV-carrying mosquitos (culex pipiens) typically come out at night. To keep safe, wear long-sleeves outside during nighttime hours and use insect repellant. In addition, culex pipiens breed in stagnant water. Dump the water from containers in your yard and keep your gutters clean! To check statewide activity for WNV go to the Illinois Public Health website and the Center for Disease Control and Prevention website.
Article References:
Peterson, L.R., P.J. Carson, B.J. Biggerstaff, B. Custer, S.M. Borchardt, and M.P. Busch, 2013: Estimated cumulative incidence of West Nile virus infection in US adults, 1999-2010. Epidemiology and Infection, 141, 591-595.
Ruiz, M.O., L.F. Chaves, G.L. Hamer, T. Sun, W.M. Brown, E.D. Walker, L. Haramis, T.L. Goldberg, and U.D. Kitron, 2010: Local impact of temperature and precipitation on the West Nile virus infection in Culex species mosquitoes in northeast Illinois, USA. Parasites and Vectors, 3, 1-16.
Westcott, N.E., S.D. Hilberg, R.L. Lampman, B. W. Alto, A. Bedel, E.J. Muturi, H. Glahn, M. Baker, K.E. Kunkel, and R.J. Novak, 2011: Predicting the Seasonal Shift in Mosquito Populations Preceding the Onset of the West Nile Virus in Central Illinois, Bulletin of the American Meteorological Society, 92,1173-1180.
For more information on this article or the West Nile Virus research project, please contact Nancy Westcott via email at nan@illinois.edu
^Top
|


 Since the 2002 introduction of West Nile Virus (WNV) into Illinois, over 1,300 of the severe West Nile Neuroinvasive disease cases have occurred in Illinois, and Peterson (2013) estimated that over 200,000 WNV infections have occurred in persons 16 years of age or older. WNV activity in Illinois was greatest in 2002, 2005, 2006 and 2012, with moderate activity in 2007 and 2013. Generally, above average temperatures and below average precipitation in the summer months favors WNV, and cool and/or wet summer conditions are not as favorable for WNV. Several climate-based county models have been developed to help predict the onset of WNV in Illinois, one for
  These two existing WNV models have been calibrated to their local areas, however, and WNV activity can vary throughout the state for a given year. For example in 2007 and 2013 when southern Illinois experienced their highest number of cases, there was only moderate activity in northeast Illinois. One possible cause of the difference in WNV activity is the variation in temperature and precipitation regimes across the state during any given summer. In order to help determine the impact of climate on WNV outbreaks across the state, the Midwestern Regional Climate Center (MRCC) has launched a new project that focuses on using tool development and research to create a real-time climate-based WNV Threat Tool for each of the nine Illinois Climate Divisions (Figure 1, right).


 The Midwestern Regional Climate Center is pleased to be in a position to hire two climatologists that will help the center continue to provide climate data, information, outreach and research findings to the region’s stakeholders.
 Allan Curtis led the MRCC’s Service Office from October 2012 through July 2014. He recently accepted a new position as Meteorologist Intern at the National Weather Service (NWS) Forecasting Office in Des Moines, IA. While at the MRCC, in addition to leading the Service Office, he contributed to the development of several informational and resource pages on the MRCC website, co-coordinated science fairs, participated in several MRCC regional road trips that allowed him to meet with many of our stakeholders, and was an expert on all of the nuances associated with the many observational atmospheric data sets that the MRCC provides to the public. His climatological contributions and overall positive energy and enthusiasm will be missed. We know he will fit right in at his new job and we look forward to continuing to work with him as one of our NWS partners well into the future!
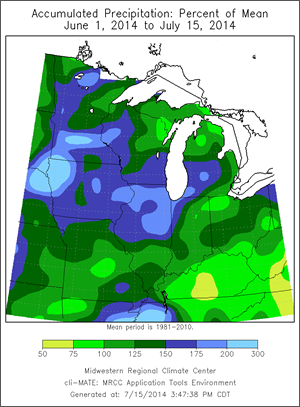 As of mid-July, summer 2014 has been wetter than normal across much of the Midwest (see graphic). In terms of temperature, so far summer 2014 temperatures average near normal. However, individual months show slightly above normal temperatures in June and slightly below normal temperatures so far in July.
 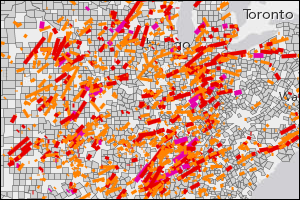 Have you ever wondered what tornadoes have gone through your area in the past? The new, one-of-a-kind
 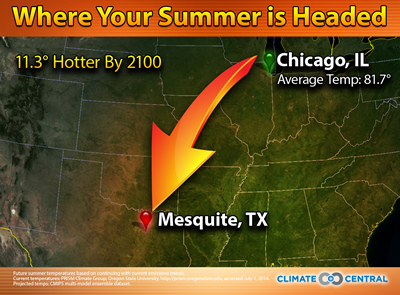 Founded in 2008 by leading scientists and communications experts at Princeton, Yale and Stanford,