On the Road: CO - AMS Applied
Climatology Conference WA - AASC Annual Meeting MI - Great Lakes NOAA
Regional Collaboration Team AL - National Assoc. of
County Ag Agents
Impact of the Polar Vortex on Grapes in Ohio
Imed Dami, Associate Professor and State Viticulturist, Dept. of Horticulture and Crop
Science, The Ohio State University
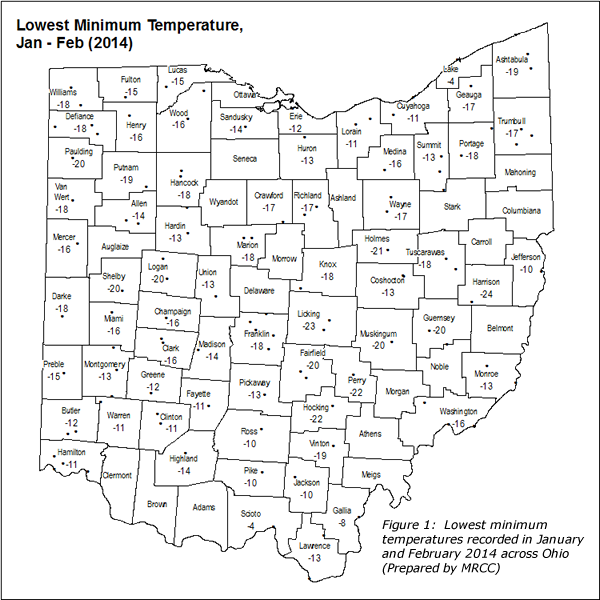
Earlier this year many of us experienced the “polar vortex” wrath, one of the coldest Arctic outbreaks in two decades that plunged into the United States bringing bitterly cold temperatures to the Midwest, South, and East including Ohio. For us humans, the wind chill was even worse and life threatening, leading to closures of public institutions and businesses across the country in early January. So, how did this arctic blast impact grapes? Many vineyards in Ohio were affected, and vines sustained extensive bud and trunk damage depending on the location and the variety grown. Dr. Dami, State Viticulturist, and his team at the Ohio State University (OSU) conducted a survey to estimate the extent of crop loss. Growers reported 800 acres of grapes that experienced an average minimum temperature of -14°F (see map, Fig. 1) and caused nearly $4 million of economic loss. Total losses to Ohio grape producers are expected to be much larger, considering that there are some 1,900 acres growing this crop in the state.
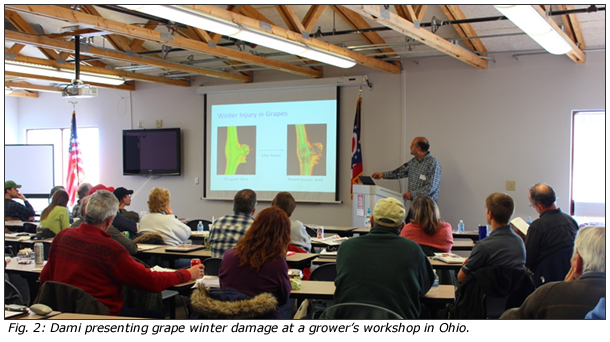
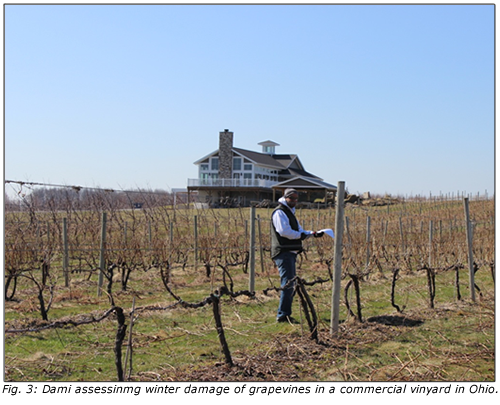
The magnitude of economic losses varied with the grape type with the European-type (Vitis vinifera, the most cold tender) averaging the most loss at 97%, followed by inter-specific hybrids (medium cold hardiness) averaging 60%, and the American type (most cold hardy) suffered the least crop loss at 30%. While these losses are substantial, the potential damage to grapevine trunks and vine death is more worrisome, as it would impact growers over a longer period of time. With bud damage, crop loss can be partial or total but for one season only. With trunk damage, it takes one year to retrain new trunks and another year to resume full production. However, if the whole vine dies, growers have to start from scratch, and it will take four years from replanting to have a full crop again. The extent of trunk damage and possible vine death cannot be assessed until later in the spring and summer. To help producers deal with the aftermath of this year’s catastrophic weather, Dami and his Team conducted a series of hands-on workshops to show nearly 300 growers how to assess bud damage and the best practices for recovery (Figure 2).
Despite that the minimum temperatures experienced in 2014 were not the coldest recorded in Ohio, crop damage was extensive and Dami attributes this disastrous outcome to a combination of factors. First, the coldest temperatures experienced in the state were frequent as a result of the polar vortex that descended into the United States. Second, extremely low temperatures that can kill buds and trunks usually only last a few minutes, while this year such temperatures lingered for hours. The most important factor, however, was that vine cold hardiness became compromised this winter due to warm weather in December tricking vines that spring is around the corner. Mild temperatures prompted grapes to lose hardiness, or “de-acclimate”. Additionally, the coldest days of the season were preceded by relatively warm temperatures and basically took the vines by surprise. For example, at the OSU research vineyard in Wooster, -11°F was recorded during the polar vortex event. The same temperature caused 50% bud damage to vinifera varieties in 2009, but this year it lasted much longer, and the day before, the temperature was 45°F, leading to nearly 100 percent bud damage. The mild temperatures also melted the snow, which eliminated the extra insulating protection it provides to the trunks. Finally and adding insult to injury, growers who have wind machines, that help protect grapevines from extreme cold, could not use them this year because of the windy conditions that prevailed during the polar vortex.
In conclusion, grape crop loss to cold is not uncommon in Ohio. Grape growers understand the risks of farming this crop — especially those producers who grow vinifera varieties — which have become more popular in the past 20 years as the wine industry has substantially expanded in the Buckeye state. Losing a vinifera crop once every 10 years is considered normal anywhere in the eastern U.S. The Ohio grape industry has been fortunate to avoid a catastrophic loss in the past 20 years and has been producing high-quality wines from these varieties. Therefore, the cold events in 2014 should be seen as an exception rather than the rule because the impact of this winter’s polar vortex was more extreme and very different from past cold weather events. So this year's loss should not be a deterrent for existing and prospective growers. In fact, large industries such as Washington, New York, Canada, and even France experienced catastrophic crop losses due to cold, but they all bounced back and are thriving to date. Ohio’s grape and wine industry is resilient and will do the same.
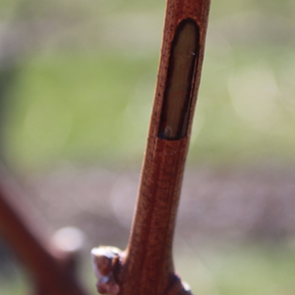
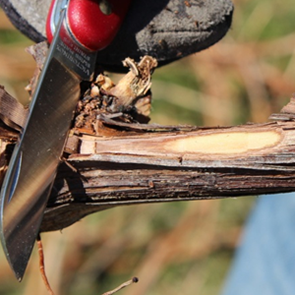
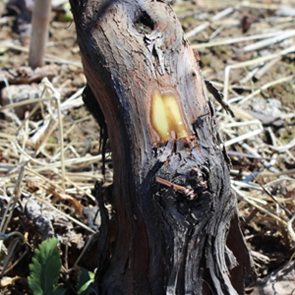
Figures 4A-D: Examples of freeze damage to different parts of a grapevine.
Figure 4A: Bud damage assessment. Dead (brown) primary bud and live (green) secondary bud.
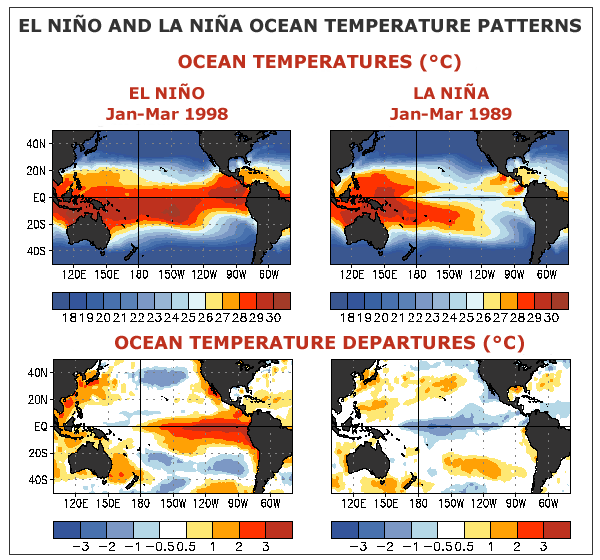
The term “El Niño” is starting to make the news this year. The NWS Climate Prediction Center has recently forecasted that there is a 65 percent chance of El Niño arriving by this summer. El Niño events occur when the sea surface water temperatures in the eastern Pacific Ocean along the equator are significantly above average. Besides warmer waters along the equator, there are substantial changes in the weather patterns over the Pacific Ocean basin. Those in turn cause changes the weather patterns over the United States, including the Midwest.
Image courtesy NOAA's Climate Prediction Center
El Niño is one of the three phases of ocean conditions in the eastern Pacific Ocean. The overall term for all three is the El Niño-Southern Oscillation, or ENSO for short. The three phases are El Niño (warm phase), La Niña (cold phase), and the neutral phase — sometimes called La Nada. Pieces of this process have been known for centuries because of its impact on the fishing industry in Peru. However, great progress has been made in the last century in defining, understanding, and more recently, forecasting these conditions. The two major El Niño in the modern record are the 1982-83 and 1997-98 events.
The impacts of El Niño on the weather are different for different parts of the world. In addition, the impacts can vary from one El Niño to the next, based on when the El Niño forms, how long it lasts, and its intensity. Finally, El Niño events typically begin in the late spring or early summer, and become fully developed in the fall and winter in the Northern Hemisphere. As a result, many of the more significant impacts happen in fall and winter as well.
In general, the global impacts of El Niño during summer can be severe. Portions of India, Southeast Asia, Australia, as well as central and northern South America can experience drought. The impacts on the United States are not as severe and less consistent from one El Niño to the next. It can bring heavy rains to the West Coast and the Southeast, especially in winter. In the Midwest, we are more likely to have slightly cooler summers, and milder winters with less snowfall. Past El Niño events have resulted in better corn and soybean yields in some parts of the Midwest due to the milder temperatures.
The NWS Climate Prediction Center will be monitoring conditions in the Pacific Ocean and provide updates on their growing season forecasts based on how the potential El Niño develops. Meanwhile, climatologists in the Midwest will be monitoring climate conditions in the region. Because each El Niño provides an opportunity for confirming previous impacts and identify new impacts, please report any weather-related impacts to your state climatologist or the Midwestern Regional Climate Center.
Also, just in time for the likely arrival of El Niño comes the new NOAA ENSO Blog. The blog is written by a team of three veteran El Niño scientists:
Anthony (Tony) Barnston, chief forecaster at the International Research Institute (IRI) for Climate and Society
Emily Becker, a researcher at the NOAA’s Climate Prediction Center (CPC)
Michelle L’Heureux, who has led the team in charge of routinely producing NOAA/NWS/CPC’s ENSO updates and outlooks since 2006
Following the cold and snowy winter, spring in the Midwest was also cold and snowy, especially in the northern half of the region. Measureable snow even fell in northern Illinois in mid-May. April precipitation totals were above normal for much of the region which reduced the drought area in the western Midwest as the month progressed. Planting was off to a slow start but recovered somewhat in late April and early May as planting progressed quickly when the conditions were favorable, particularly in the southern half of the Midwest.
April temperatures were below normal for the northern half of the region, as much as 5°F below normal in Minnesota, Wisconsin, and Upper Michigan. To the south, near normal or slightly above normal temperatures were recorded from Missouri to Ohio and Kentucky. The northern half of the region had above normal snow totals in April and the snow pack lasted later into the spring than normal. Ice cover on the Great Lakes (with records back to the 1970s) was near record levels in early March (92%) and set new records in mid-April (38%) as ice cover lasted well into the spring when the ice has typically melted.
Ice on the Great Lakes has both positive and negative impacts. Shipping was delayed as ice choked locks and harbors well into the spring. However, the ice cover, and subsequent low water temperatures, are partly responsible for the rebound in lake levels from the near record lows in recent years. The ice and cold water have greatly reduced evaporation from the lake surface, combined with runoff from the melting of heavy snow packs, has led to an increase in lake levels which is expected to continue in the coming months.
Floods are a part of the Earth’s natural hydrologic cycle. However, as many people know, they can be dangerous and harmful to those living in their path. The MRCC Living with Weather: Floods page discusses the various types of floods and their causes, as well as the hazards of flooding, flood preparation and safety, and historical Midwest floods. In addition, there are flood resources by sector (i.e. public, municipalities, agriculture, water and energy). The Living with Weather webpage series is designed as a resource for individuals and communities to help plan for and cope with extreme weather events. Other pages currently available in this series include heat waves, drought, winter storms, and ice storms, while pages on winds, tornadoes, and lightning are in development.
Ever wanted to know what recorded storm events have occurred in your area in the past? Curious how much the estimated damage was from the last tornado? The Storm Events Database maintained by the National Climatic Data Center (NCDC) allows users to search areas, including states, counties, and other geographic boundaries, by date(s) for various events. The events are not restricted to tornadoes, hail, and high winds, but also include events such as blizzards, fog, droughts, floods, wildfires, and more. After searching for an event, additional information may include fatalities, injuries, property damage, event description, path, and more. Events go back as far as 1950 for tornadoes, 1955 for thunderstorm winds and hail, and 1996 for 48 additional event types.
Westminster, CO (June 9-13) – AMS Applied Climatology Conference
Mike Timlin, Nancy Westcott, Beth Hall, and Kayla Novak will be attending the conference, sponsored by the American Meteorology Society, to present posters and a presentation on recent research activities within the MRCC.
Stevenson, WA (July 8-11) - American Association of State Climatologists Annual Meeting
Mike Timlin, Beth Hall, Nancy Westcott, and Allan Curtis will be attending the annual AASC meeting which brings together the various state climatologists and the RCCs. The meeting is an opportunity for everyone to get up to date on the work of others as well as to discuss plans for the coming year or two. The other RCCs and the state climatologists are among our closest partnerships and this is a great opportunity to network with many of them.
Muskegon, MI (July 9-10) - Great Lakes NOAA Regional Collaboration Team Annual Meeting
Molly Woloszyn will be representing the MRCC at this gathering where NOAA partners from around the Great Lakes region come together to discuss recent activities and plans for the next year of regional collaboration.
Mobile, AL (July 19-22) – National Association of County Agricultural Agents Annual Meeting
Molly Woloszyn is attending the NACAA annual meeting to present information about the MRCC’s Vegetation Impact Program, specifically the Frost/Freeze Guidance project. Molly will also host a booth to show the products and tools that are available through the MRCC and VIP to agricultural Extension agents from across the country.
Email us your local climate impacts! We are constantly keeping a log of how climate is impacting
our region, and our information would not be complete with YOUR help!
Have something to share as a feature article in an upcoming The Climate Observer issue, or
interested in being contacted for an article interview? Please let us know!


 however, was that vine cold hardiness became compromised this winter due to warm weather in December tricking vines that spring is around the corner. Mild temperatures prompted grapes to lose hardiness, or “de-acclimate”. Additionally, the coldest days of the season were preceded by relatively warm temperatures and basically took the vines by surprise. For example, at the OSU research vineyard in Wooster, -11°F was recorded during the polar vortex event. The same temperature caused 50% bud damage to vinifera varieties in 2009, but this year it lasted much longer, and the day before, the temperature was 45°F, leading to nearly 100 percent bud damage. The mild temperatures also melted the snow, which eliminated the extra insulating protection it provides to the trunks. Finally and adding insult to injury, growers who have wind machines, that help protect grapevines from extreme cold, could not use them this year because of the windy conditions that prevailed during the polar vortex.
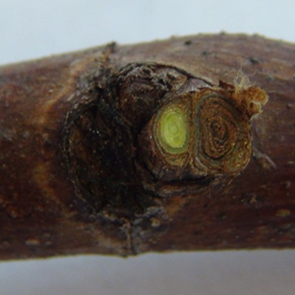
 Images courtesy NOAA's Climate Prediction Center. Current condition ENSO animations can be found at
  Following the cold and snowy winter, spring in the Midwest was also cold and snowy, especially in the northern half of the region. Measureable snow even fell in northern Illinois in mid-May. April precipitation totals were above normal for much of the region which reduced the drought area in the western Midwest as the month progressed. Planting was off to a slow start but recovered somewhat in late April and early May as planting progressed quickly when the conditions were favorable, particularly in the southern half of the Midwest.
  Floods are a part of the Earth’s natural hydrologic cycle. However, as many people know, they can be dangerous and harmful to those living in their path. The
  Ever wanted to know what recorded storm events have occurred in your area in the past? Curious how much the estimated damage was from the last tornado?