On the Road: GA - American Meteorological Society Annual Meeting IL - Urbana City Council, Wilderness Climate Clinic for Educators, Illinois Assoc. for Floodplain and Stormwater Management MO - MRCC Regional
Road Trip
Ice Cover on the Great Lakes
Co-authors: Anne Clites, NOAA-GLERL and Molly Woloszyn, MRCC
Ice formation on the Great Lakes is a clear signal of winter. Looking back in time, the lakes were formed over several thousands of years as mile-thick layers of glacial ice advanced and retreated, scouring and sculpting the basin. The shape and drainage patterns of the basin were in a constant state of flux resulting from the ebb and flow of glacial meltwater coupled with the rebound of the underlying land as the massive ice sheets retreated.
Ice provides us with an important connection to the past and also serves as a measure of the harshness of current-day winter weather. Understanding the major effect of ice on the Great Lakes is crucial because it impacts a range of societal benefits provided by the lakes, from hydropower generation to commercial shipping to the fishing industry.
The annual variability in ice coverage on the Great Lakes plays an important role in determining climate patterns, lake water levels, water movement patterns, water temperature structure, and spring plankton blooms. Monitoring, conducting research, and forecasting Great Lakes ice cover is an important component of the National Oceanic and Atmospheric Administration (NOAA)’s Great Lakes Environmental Research Laboratory (GLERL), located in Ann Arbor, Michigan.
Historical Ice Cover on the Great Lakes
The amount of ice cover on the Great Lakes varies from year to year, as well as how long it remains on the lakes each season. GLERL scientists are observing long-term changes in ice cover on the Great Lakes over the last few decades (Figure 1). The long-term average for maximum ice cover each winter on the Great Lakes is 51.4%, based on the recorded history from 1973 to present. Since records began in 1973, the highest seasonal extent of ice cover on the lakes was 94.7%, which occurred in 1979 while the lowest seasonal extent of ice cover on record is 9.5% in 2002. In 2013, the maximum ice cover was 38.4%, which is 13% below the long-term average.
Effect of Ice on the Great Lakes Region
Lake Water Levels and Navigation
In theory, heavy ice cover can reduce the amount of evaporation from the Great Lakes in the winter, thus contributing to higher water levels. This is good news for shippers, increasing their capacity to transport cargo. Higher lake levels are also a benefit to those who spend millions to dredge boat slips, channels, and harbors when lake levels are low. In addition, when water levels are low on the Great Lakes, sometimes shippers have to reduce the amount of cargo they carry. On the other hand, lingering heavy ice conditions in early spring can delay the shipping season and cause navigational problems. If warmer temperatures in the future do occur and ice cover on the Great Lakes continues to decrease, this may have some positive impacts on shipping, including a longer ice-free shipping season.
The Fishing Industry
In the shallow waters where whitefish spawn, ice cover protects their eggs from destructive wind and wave action. Ice cover with little or no snow cover allows light penetration at the surface to promote algae growth. At the base of the food web, algae support living organisms in the lakes, including valuable commercial and sport fish species. With $4 billion flowing into the commercial and sport fishing industry each year, ice cover can be a significant factor affecting the region’s economy.
The Coastal Zone
In bays and other nearshore areas, ice forms a stable platform for winter recreational activity such as ice fishing. This stable ice also protects wetlands and the shoreline from erosion. Though these are positive effects, they can also have negative consequences. Huge ice jams can form in rivers connecting the Great Lakes. These jams constrict the flow of water from one lake to another, causing flooding upstream and less water for hydropower plants downstream. When the jam finally breaks, the resulting surge of ice and water can damage the shoreline and property.
Just last week, ice from Lake Erie was forced into the Upper Niagara River as a result of a strong winter storm, sparking flooding concerns and warnings from the U.S. National Weather Service. A large portion of Lake Erie is frozen and more of the lake has become ice covered due to the record-setting low temperatures over the Great Lakes region recently. Icebreakers operated by Canadian and U.S. power authorities were dispatched into the Upper Niagara to break up the jam on January 7th to lessen risk to shoreline property and hydroelectric intakes on the American side of the river.
Ice Cover Forecast Capability
The capability to forecast and predict ice cover is important for recreational safety and rescue efforts as well as for navigation, weather forecasting, adapting to lake level fluctuations, and ecosystem studies. This forecast need is illustrated by an incident that occurred in Lake Erie on a warm sunny day in February 2009 when a large ice flow broke away from the shoreline. The floating ice block stranded 134 anglers about 1,000 yards offshore and resulted in the death of one man who fell into the water. While the ice on the western sections of the lake was nearly 2 feet thick, rising temperatures caused the ice to break up, and southerly wind gusts of 35 mph pushed the ice off shore.
GLERL has added an ice-forecasting component to its existing Great Lakes Coastal Forecasting System (GLCFS), which uses a computer model to predict ice formation and break-up. This model is used by the National Weather Service to forecast short-term (5-day) ice concentration, thickness, and velocity as well as improving winter wave forecast, as ice cover significantly affects how surface waves behave.
Current Ice Cover and Remaining Winter 2013-2014 Forecast
According to GLERL, current ice cover on the Great Lakes ranges from a low mean concentration of 3% on Lake Ontario to a high mean concentration of 65.3% on Lake Erie (as of January 15th). Lake Ontario’s mean ice thickness currently is the thinnest at 1.2 cm (0.47 in), whereas the mean ice thickness on Lake Erie is the thickest of the lakes at 21.9 cm (8.6 in). The current percent ice cover, ice thickness, and vessel icing potential on any of the Great Lakes (for the last 48 hours) is available from GLERL on the GLCFS Nowcast website. The GLCFS also provides short-term (5-day) ice forecast animations on the Forecast website as well (to access forecasts, click “See also Forecast Page” at the top of the webpage). For real-time ice concentration and water temperatures for all five Great Lakes on one map, visit the GLERL Coastwatch Great Lakes Surface Environmental Analysis (GLSEA) page.
For the remainder of winter 2013-2014, GLERL scientists predicts that maximum ice coverage for the Great Lakes will be 57-62% by February 2014, which is slightly above the long-term average maximum ice cover of 51.4%. To make this prediction, GLERL scientists used a statistical regression model, which incorporates the NAO (North Atlantic Oscillation) and ENSO (El Niño and Southern Oscillation) indices.
January 5-7 Winter Storm and Cold Temperatures in Historical
Perspective for Indiana
Chad Swain, Al Shipe and Mike Ryan - NWS Indianapolis
A powerful storm system brought heavy snow and near blizzard conditions to much of Indiana on January 5, with a mix of rain and snow across southern portions of the state. After the snow diminished during the evening, arctic air plunged into the area on strong winds. Temperatures plummeted and significant blowing and drifting of snow occurred. Temperatures remained below zero for over 24 hours at many locations, with wind chills around 40 below zero at times. Temperatures reached levels that had not been seen in 20 years. The snow and cold created dangerous travel conditions across much of Indiana and surrounding areas. Sections of interstates were closed down, and travel was restricted to emergency personnel only. Schools were closed for a week across parts of central Indiana, with many roads remaining snow covered and icy until temperatures warmed on the 8th and 9th.
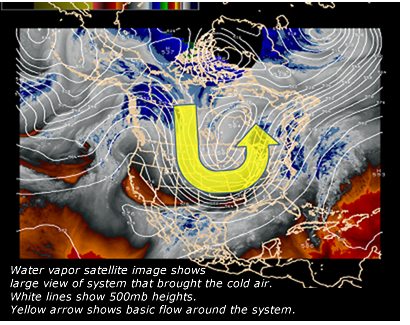
What caused this event?
The jet stream dove south into the southern United States, allowing cold air straight from the Arctic to flow south into the USA. (For information on the "polar vortex", please visit this climate.gov article.) This cold air interacted with plentiful moisture being drawn northward with an area of low pressure at the surface. The result was heavy snow for several hours across the northwest half of central Indiana. Across the southeast part of the area, warmer air moved north and allowed for a period of rain. This cut down on snow amounts. As strong high pressure moved in behind the low pressure, winds increased across the area. Gusts of 30 to 40 mph were common Sunday night, resulting in blowing and drifting of the snow that fell. Gusty winds continued into January 6, creating dangerous wind chills.
Snowfall
Snowfall of 8 to 14 inches was common across areas generally along and north of a Terre Haute to New Castle line. The axis of heaviest snow fell in a band from near Crawfordsville northeast through Lebanon, Kokomo and Tipton to areas west of Fort Wayne. Amounts dropped quickly to the south and east of this line due to warmer air allowing rain to fall for several hours. Areas that received heavy snow saw snow falling at a rate of an inch or more per hour during the height of the storm. At Indianapolis, snow fell at the rate of at least an inch per hour during the 10:00 AM to 3:00 PM time frame on January 5. Snowfall diminished by late afternoon but lighter snows continued into the evening. At Indianapolis, the 11.4 inches of snow that fell on January 5 was the second highest calendar day snowfall since records began, and that amount was a new record snowfall for the January 5 date. The Indianapolis record for most snowfall in a calendar day is 12.1 inches on March 19, 1906. At Indianapolis, only two other days in January have ever had greater than 10 inches of snow accumulate in 1 day: January 15, 1965 and January 26, 1978 (during the blizzard of '78).
Gusty winds ushering in the colder air brought blowing and drifting snow. Visibility was reduced in blowing snow across many areas through the day of January 6. This resulted in drifts of several feet at some locations. The snow and lowered visibility caused some roads to be shut down across parts of Indiana. Interstate 65 was shut down from north of Lafayette to Gary, a stretch of 88 miles. Some state and US highways were also closed. Many counties in Indiana declared travel warnings, meaning that only emergency vehicles were allowed on the roads. Marion County and the city of Indianapolis experienced their first travel warning since January 1978.
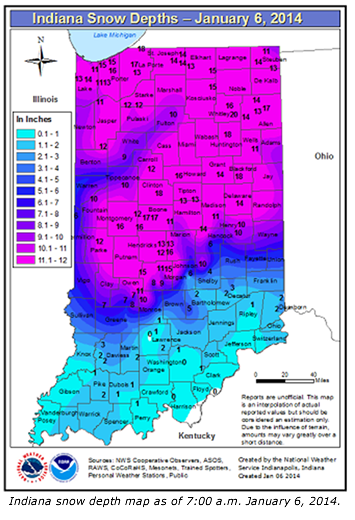
Snow Reports across Indiana
Much of the northern half of Indiana received 10 inches or greater snowfall from the January 5 storm. Below is a list of the 10 largest snowfall totals from a variety of observations (ASOS, COOP, CoCoRaHS).
SITE (COUNTY)
SNOWFALL (IN.)
VALPARAISO 3WSW (PORTER)
18.3
LA FONTAINE 1WNW (WABASH)
18.0
VALPARAISO 1SE (PORTER)
15.8
PORTER 1S (PORTER)
15.7
CROWN POINT 1N (LAKE)
15.6
TIPTON (TIPTON)
15.0
HUNTINGTON (HUNTINGTON)
14.6
HARTFORD CITY (BLACKFORD)
14.5
HARTFORD CITY 1SE (BLACKFORD)
14.5
VALPARAISO 2NW (PORTER)
14.4
Cold Temperatures
As arctic air flowed into the area, temperatures fell quickly during the evening of January 5 and into January 6. Many locations experienced a 35 to 40 degree drop in temperatures over a 12 hour period from late afternoon on the 5th to the early morning of the 6th. Readings bottomed out colder than 10 below zero across most of the area that saw significant snow. These temperatures were some of the coldest seen since January 1994. Temperatures remained below zero for well over 24 hours at many locales. With gusty winds continuing through January 6, wind chills fell into the 30 to 45 below zero range for prolonged periods of time. Fort Wayne set record lows for both January 6th and 7th, with temperatures falling to -14 and -15, respectively.
The following table summarizes some temperature facts for sites across central Indiana, based on hourly observations at the site. Temperature and wind information was missing at Lafayette for several hours during the event.
Observation Site
Hours Below Zero
Low temperature January 6
Low temperature January 7
Wind Chills
(based on sustained winds)
Indianapolis
34
-15
-14
-30 or colder from 4:00 AM Jan 6 to 10:00 AM Jan 7
Lafayette
~35
N/A
-14
N/A
Muncie
34
-13
-14
-30 or colder from 6:00 AM Jan 6 to 9:00 AM Jan 7
Terre Haute
34
-14
-15
-25 or colder from 3:00 AM Jan 6 to 10:00 AM Jan 7
Bloomington
31
-11
-9
-25 or colder from 7:00 AM Jan 6 to 12:00 AM Jan 7
While January 5-7 saw the coldest temperatures experienced in Indiana since 1994, it remained behind several of the most impressive subzero periods in recorded history. The following table highlights the most extensive cold outbreaks, highlighted by consecutive hours below zero degrees.
Snowstorm of January 5-6, 2014: How bad was it? Beth Hall, MRCC Director
As people across the Midwest were watching snow drifts build by the foot, temperatures drop below zero, and wind chill temperatures fall to dangerously low values, water cooler (or, more likely ice cooler) conversations were occurring that stretched our memories of when we’ve seen snow and cold as bad as the storm that just passed. Was this winter storm event a sign of times to come, or has our region been host to these extreme winter conditions in the past to indicate more that this is well within our climatological “normal” conditions?
Snow
Three Indiana stations were selected with long data records (> 100 years) to see how the January 5-6, 2014 snow event compared to previous snow events (Table 1). While the most recent snow event won the snow contest for Crowne Point, IN, it came in 4th and 5th place for Frankfort and Whitestown, IN. What is also interesting is that all the major snow events in Crowne Point occurred since 2000, however, there were some major events in the 1920s and 1970s for the other two cities. Could there be an oscillatory pattern evolving?
TABLE 1: SNOWFALL RANKINGS
Whitestown, IN
Crowne Point, IN
Frankfort, IN
12/20/1973
15"
1/5/2014
15.6"
12/19/1973
15.5"
1/13/1927
13.2"
1/23/2005
14"
1/13/1927
13.2"
1/26/1978
12"
2/15/2007
10"
2/13/2007
13"
2/13/2007
12"
1/22/2005
10"
1/5/2014
12"
1/5/2014
11"
3/6/2013
9"
1/2/1999
10.5"
What about snowfall days with greater than or equal to 6 inches? Are these becoming more or less common? Figure 1 shows the number of days per decade with snowfall events greater than or equal to 6 inches for Indianapolis, Indiana. Since the 1960s, there has been 5-7 days per decade with a major snowfall event over 6 inches. With the 1990s in the midst of this period, no obvious trend can be deduced that these numbers of days are increasing or decreasing. However, please note that there have already been 5 days in our current decade that is less than halfway over!
Figure 1: Number of days with snowfall greater than 6" at Indianapolis, Indiana.
Cold
In Indianapolis, on January 5, 2014, the high temperature was only 5°F. While that is certainly cold, how common is it? Looking at Figure 2 below, one can see that cold days similar to January 5, 2014, while relatively uncommon, are not necessarily happening more or less frequently than in the past. Certainly, there were colder decades and warmer decades, but there is no obvious trend. However, note that there were no days with a high temperature less than or equal to 5°F from 2000-2009, and our current decade isn’t even half over, so it’s too soon to tell if there is a decreasing trend in cold days like what was seen in early January of this year!
Figure 2: Number of days with maximum temperature less than or equal to 5°F at Indianapolis, Indiana
Consecutive days of cold temperatures
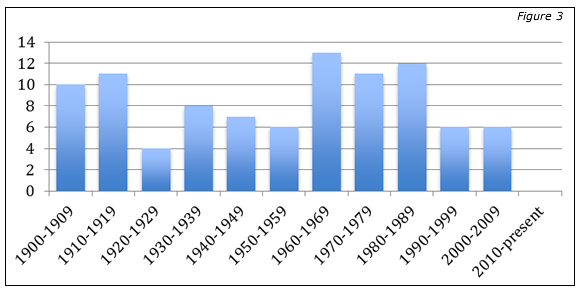
As mentioned in the article about the January 5-6, 2014 winter event in Indiana, there were almost 36 straight hours below 0°F! What about consecutive days when the high temperature never got above 20°F? Is there a trend in these cold periods that have lasted 3 days or more??
Figure 3 below shows an up-and-down trend in how often those cold periods occur. It appears that the early years of the 20th century saw quite a few cold periods, along with the 1960s through 1980s. However, since the 1990s, these cold periods are less common (but still occur!). Thankfully for Indianapolis, they haven’t experienced one of these cold periods in our current decade.
Figure 3:
Number of cold periods (i.e. 3 consecutive days) with maximum temperature less than or equal to 20°F in Indianapolis, Indiana
Conclusion?
It’s winter. Winter in the Midwest tends to be cold with a chance of snow. When major winter events such as the one that passed through January 5-6, 2014 occur, we love to sit around with a fire in the fireplace, blanket on our lap, hot chocolate in hand, and recollect past events and years. My parents used to always say, “things aren’t as they used to be!” Except for that time in the 1970s. Oh, and maybe that time in the 1980s. My grandparents had it bad, but that’s because they had to walk 10 miles to work/school/church uphill both ways!
Stay warm, my friends!
For more information on this article or the MRCC, please contact Beth Hall via email at bethhall@illinois.edu
Annual temperature values for 2013 were slightly cooler than normal for a majority of the Midwest region, with the exception of portions of the eastern Midwest. Individual months that stand out in terms of temperature were March, April, and December, which were all significantly below normal for much of the Midwest, especially Minnesota. Statewide values range from just above normal in Ohio (+0.1°F) to the coldest departure values for the year in Minnesota (-1.8°F), Iowa (-1.3°F) and Wisconsin (-1.3°F).
Annual precipitation values for 2013 topped normal for all nine Midwest states using preliminary statewide estimates. Statewide annual values ranged from 104% of normal (Iowa) to 122% of normal (Michigan). Throughout the year, there were several notable precipitation events. One such event occurred in southern Missouri in early August, where precipitation 600% of normal caused major flash flooding in this region. Other notable events include two major winter storm systems in December that brought record-breaking rainfall, freezing rain, and snowfall to the Midwest.
Daily snowfall and snow depth information is available on the MRCC’s Midwest Climate Watch page. But what if your interest is in the current season total, or a past snowfall event, or departure from normal? The MRCC cli-MATE system has the tool for you! Our cli-MATE mapping system allows you to map snowfall, departure from normal, or percent of normal for any user defined period. Once you are on the data selection screen for “Maps of Gridded Data-Specific Period”, you can select your preferred parameters. The maps are produced using the MRCC gridded data set, which is updated daily. Historical snowfall maps can also be compiled. Note that departure maps and percent of mean maps are always calculated using the current normals (1981-2000).
The Snowfall Analysis project is an objective analysis of National Weather Service (NWS) Cooperative Observer Program (COOP) and Community Collaborative Rain, Hail, and Snow Network (CoCoRaHS) snowfall reports. CoCoRaHS data is from non-NWS sources and may not have been fully quality controlled. Maps are available for the contiguous 48 states for the most recent 24-, 48-, and 72-hour periods ending at 7:00 a.m. local time of the current day.
Atlanta, GA (February 2-7) - American Meteorological Society (AMS) Annual Meeting
Mike Timlin will be presenting the latest news on the Vegetation Impact Program's (VIP) Frost/Freeze Guidance Project at the annual AMS meeting.
Urbana, IL (February 4) - Urbana City Council
Invited by the Urbana Climate Action Plan committee, Molly Woloszyn will present data and information about local climate trends and projections for Central Illinois to the Urbana, IL City Council.
Chicago, IL (February 6) - Chicago Wilderness Climate Clinic for Educators
Molly Woloszyn will be presenting about local climate change impacts for Northeastern Illinois at a Chicago Wilderness Climate Clinic for Educators on February 6, 2014 at the Peggy Notebaert Nature Museum in Chicago.
Beth Hall and Mike Timlin will be embarking on another MRCC Regional Road Trip to meet with folks who either use MRCC resources or would like to learn more about what we offer. If you’re in that area and would like us to stop by, please let Beth know!
Rosemont, IL (March 12-13) - Illinois Association for Floodplain and Stormwater Management Annual Conference
Zoe Zaloudek will be attending the annual IAFSM conference, being held at the InterContinental Chicago O'Hare Hotel in Rosemont.
Email us your local climate impacts! We are constantly keeping a log of how climate is impacting
our region, and our information would not be complete with YOUR help!
Have something to share as a feature article in an upcoming The Climate Observer issue, or
interested in being contacted for an article interview? Please let us know!

 Departure")


 Ice formation on the Great Lakes is a clear signal of winter. Looking back in time, the lakes were formed over several thousands of years as mile-thick layers of glacial ice advanced and retreated, scouring and sculpting the basin. The shape and drainage patterns of the basin were in a constant state of flux resulting from the ebb and flow of glacial meltwater coupled with the rebound of the underlying land as the massive ice sheets retreated.
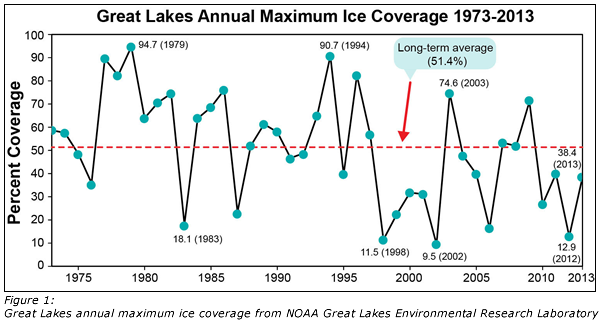
 the other hand, lingering heavy ice conditions in early spring can delay the shipping season and cause navigational problems. If warmer temperatures in the future do occur and ice cover on the Great Lakes continues to decrease, this may have some positive impacts on shipping, including a longer ice-free shipping season.
 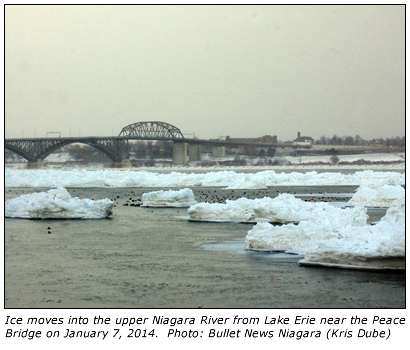 When the jam finally breaks, the resulting surge of ice and water can damage the shoreline and property.
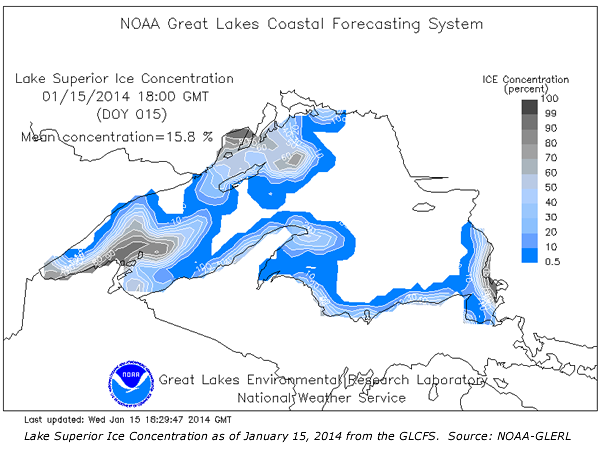

 The jet stream dove south into the southern United States, allowing cold air straight from the Arctic to flow south into the USA. (For information on the "polar vortex", please visit
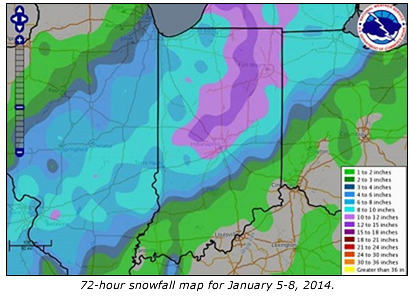
 Snowfall diminished by late afternoon but lighter snows continued into the evening. At Indianapolis, the 11.4 inches of snow that fell on January 5 was the second highest calendar day snowfall since records began, and that amount was a new record snowfall for the January 5 date. The Indianapolis record for most snowfall in a calendar day is 12.1 inches on March 19, 1906. At Indianapolis, only two other days in January have ever had greater than 10 inches of snow accumulate in 1 day: January 15, 1965 and January 26, 1978 (during the blizzard of '78).
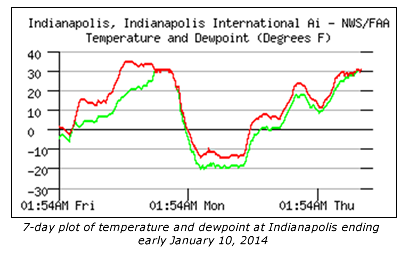 As arctic air flowed into the area, temperatures fell quickly during the evening of January 5 and into January 6. Many locations experienced a 35 to 40 degree drop in temperatures over a 12 hour period from late afternoon on the 5th to the early morning of the 6th. Readings bottomed out colder than 10 below zero across most of the area that saw significant snow. These temperatures were some of the coldest seen since January 1994. Temperatures remained below zero for well over 24 hours at many locales. With gusty winds continuing through January 6, wind chills fell into the 30 to 45 below zero range for prolonged periods of time. Fort Wayne set record lows for both January 6th and 7th, with temperatures falling to -14 and -15, respectively.
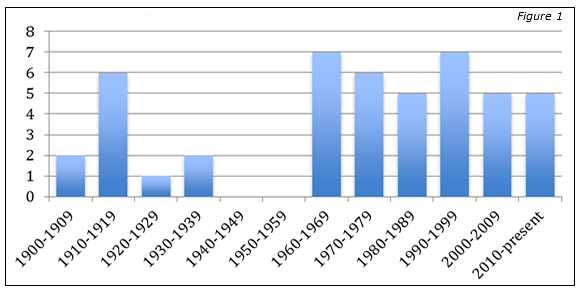

 Annual temperature values for 2013 were slightly cooler than normal for a majority of the Midwest region, with the exception of portions of the eastern Midwest. Individual months that stand out in terms of temperature were
  Daily snowfall and snow depth information is available on the MRCC’s Midwest Climate Watch page. But what if your interest is in the current season total, or a past snowfall event, or departure from normal? The
 Atlanta, GA (February 2-7) - American Meteorological Society (AMS) Annual Meeting