 100 years ago this March, one of the greatest natural disasters to strike the nation came in the form of a cataclysmic flood. The rain started on Easter Sunday, March 23rd, 1913 and continued for three days and nights. Before the rain was over, hundreds of thousands were relocated as towns along creeks and rivers were inundated with flood waters. Levees built to previous record stages were quickly overtopped, burying towns with debris-filled, rushing water that uplifted roads, tore down bridges, and destroyed thousands of homes and businesses. When the rains finally stopped, three state capitals (Indianapolis, Indiana; Columbus, Ohio; and Albany, New York) were under water. Property damage was estimated in the hundreds of millions of dollars — approximately 5-7 billion dollars today — and around a thousand lives had been lost. 100 years ago this March, one of the greatest natural disasters to strike the nation came in the form of a cataclysmic flood. The rain started on Easter Sunday, March 23rd, 1913 and continued for three days and nights. Before the rain was over, hundreds of thousands were relocated as towns along creeks and rivers were inundated with flood waters. Levees built to previous record stages were quickly overtopped, burying towns with debris-filled, rushing water that uplifted roads, tore down bridges, and destroyed thousands of homes and businesses. When the rains finally stopped, three state capitals (Indianapolis, Indiana; Columbus, Ohio; and Albany, New York) were under water. Property damage was estimated in the hundreds of millions of dollars — approximately 5-7 billion dollars today — and around a thousand lives had been lost.
"Let us not look back in anger or forward in fear, but around in awareness."
— James Thurber
At the time of the disaster, the Ohio Valley was home to a quarter of the nation’s population and was the largest producer of the country’s coal, natural gas, and steel. When the region was decimated by the floods, the ripple effect was felt across the country. This was the largest and most widespread disaster to strike the United States at that point, and is comparable with the more recent Hurricanes Katrina and Sandy.
1913 Flood Storm Summary
On the morning of Easter Sunday, March 23rd, the low responsible for the Great Flood was over Colorado. By Sunday afternoon, temperatures, humidity, and winds out of the southeast had increased notably across the Midwest. This warm and unstable airmass provided the fuel for severe and tornadic storms that day and night. Strong southerly winds, sustained over 35 mph with gusts in the 50s, had developed over central Kansas, resulting in a severe dust storm. The strong winds then moved into Missouri, this time associated with heavy rain and hail.
By evening on Sunday, stations observed sustained southerly winds of 40 to 50 mph with gusts to 60 mph, mainly over Nebraska, Iowa, and Illinois. From Chicago to Milwaukee there were reports of roofs blown off and city houses overturned. Significant tornadoes tore through several states, resulting in over 150 fatalities, most notably in Omaha, Nebraska and Terre Haute, Indiana.

Given the extensive telephone, telegraph, and power line damage from this event and the previous storms, there was little way to forewarn others of the powerful and destructive storm heading their way. In addition to severe storms and winds, the rain began to fall in sheets over Illinois and Indiana. The warm moist air coming out of the south provided unusually heavy rainfall for late March, with rainfall heaviest over northwest Ohio and central Indiana, where rain averaged over two inches for the day.
On the night of the 23rd, the storm system deepened. It rained most of the night, with intense rainfall leading to the onset of flash flooding starting in Indiana. The ground was unable to absorb the rapidly falling rain, resulting in washouts of roads and railway tracks.
As if perfectly designed for maximum rainfall, a quasi-stationary front, the type generally considered to be the most efficient heavy-rain producer, was stalled over the Ohio Basin on Monday, March 24th. Rainfall on this day measured highest in southern Indiana and western Ohio averaging 3 to 6 inches. Storm total rainfall between Easter Sunday through Monday was a swath of 3 to 8 inches over Ohio, Indiana, and southern Illinois, surpassing monthly rainfall totals in less than 48 hours. The rain however, was far from over.
On Monday night and the morning of Tuesday the 25th, the second storm system was moving into southern Indiana and Illinois, resulting in scattered reports of tornadoes and damaging winds. Over the Ohio Valley, the rain continued to fall on Tuesday the 25th, and more railroads and bridges were being damaged or destroyed across Ohio, Indiana, and Pennsylvania as powerful floodwaters swept the states. Communities were cut off from the outside world, becoming islands in many instances.

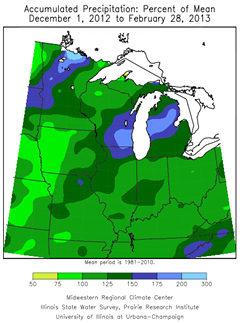
It wasn’t until midday on March 27th that a cold front, followed by an area of high pressure, was finally able to drive the trough of low pressure eastward into Pennsylvania and New York, slowly ending the heavy rain over the Ohio Valley. In Indiana, the rain was replaced with heavy snow, with amounts up to 8 inches over the hardest hit central and northern portions of the state. In Ohio, light snow followed the cold front that pushed through on Thursday, which was followed by cold high pressure centered over Kentucky the next day, and resulted in widespread frosts down into the Gulf States. Total precipitation across the region during this historic event is shown in the figure above. Visit the 100th Anniversary website for a more detailed storm summary.
Flood Preparedness
During the last century, state and federal agencies developed numerous flood warning, awareness, and protection services to protect life and property for those who live in flood zones. Some of the strategies include:
- Prevention measures (building, zoning, storm water management, floodplain regulations)
- Property protection measures (acquisition, elevation, relocation, flood insurance)
- Natural resource protection (wetland protection, erosion/sediment control)
- Emergency services (warning programs, disaster response)
- Structural projects (dams, levees, channel modifications)
- Public information (outreach, technical assistance, education)
- Flood Warnings and alerts

In this spirit, the newly developed Silver Jackets Teams, composed of local, state, and federal agencies, provide a unified approach to find common solutions to manage flood risk. What did the lessons of the 1913 flood teach us about safe and sustainable flood management? The Great Flood of 1913 attracted Congressional interest and investment in controlling or managing flood-prone areas that later resulted in the Flood Control Act of 1917. This was the first of several 20th century legislative actions that eventually resulted in the creation of the National Flood Insurance Program of 1968, the Federal Emergency Management Agency (FEMA) in 1979 and the Robert T. Stafford Disaster Act of 1988.
Although the flood management systems of today have performed remarkably well, we should still ask what we can learn and how to continually improve the overall system. In the goal of learning from past floods to improve future flood fights, the Silver Jackets seek further improvements through a comprehensive approach.
100th Anniversary Website
For the 100th Anniversary of the Great Flood, the Silver Jackets have teamed with the Midwestern Regional Climate Center (MRCC) to spread the word about this historic event and increase flood awareness. The website, “The Great Flood of 1913 – 100 Years Later” tells the stories of many communities impacted by this disaster, as well as the meteorological and hydrological conditions before and during. Resources for flood awareness, preparation, and mitigation are available for families, educators, agriculture and businesses.
For more information on this article or the Silver Jackets, please contact Sarah Jamison via email at sarah.jamison@noaa.gov.
^Top
|


 100 years ago this March, one of the greatest natural disasters to strike the nation came in the form of a cataclysmic flood. The rain started on Easter Sunday, March 23rd, 1913 and continued for three days and nights. Before the rain was over, hundreds of thousands were relocated as towns along creeks and rivers were inundated with flood waters. Levees built to previous record stages were quickly overtopped, burying towns with debris-filled, rushing water that uplifted roads, tore down bridges, and destroyed thousands of homes and businesses. When the rains finally stopped, three state capitals (Indianapolis, Indiana; Columbus, Ohio; and Albany, New York) were under water. Property damage was estimated in the hundreds of millions of dollars — approximately 5-7 billion dollars today — and around a thousand lives had been lost.


 For over a decade, the Midwestern Regional Climate Center (MRCC) has offered paid summer internships to undergraduate students, most often majoring in an atmospheric science discipline. These internships have provided students with an opportunity to work directly with historical atmospheric data and realize the diverse applications and needs of acquiring and maintaining this data. From serving the public’s need for climate information, to participating in applied climate research, to contributing to the development of tools and resources for accessing and interpreting climate data, summer interns gain an appreciation for the field of climate sciences.
  The MRCC is located within the Center for Atmospheric Sciences at the Illinois State Water Survey (ISWS). In 2008, the ISWS became a Division of the Prairie Research Institute of the University of Illinois at Urbana-Champaign. With a fully equipped, fully functional weather observing site in its backyard, the MRCC and ISWS not only get to experience the reward of contributing to a long history of climate data for a location, but also realize the complexity and challenges that data collection carries in terms of quality control.
  Student interns have the opportunity to spread their time between providing support in the

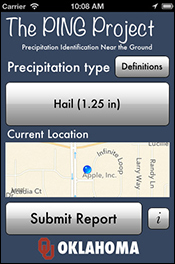
 mPING – Mobile Precipitation Identification Near the Ground
 Asheville, NC (Mar. 19-21) - NCDC Dataset discover Day Workshop #2: Frost/Freeze Data