On the Road: MI - NCA Midwest Regional Town Hall at Univ. of Michigan IA, IL - NWS Offices and other Partners IL - IAFSM Conference IL - Naturally Illinois Expo IL - Chicago NWS and EPA
19th Century Weather Data Archive
Dr. Nancy Westcott, Research Climatologist, MRCC
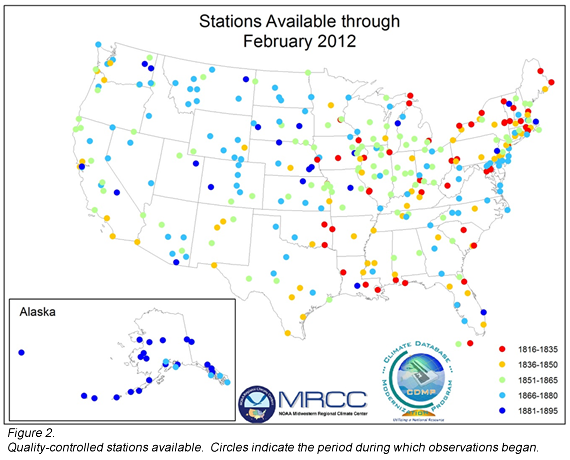
What was the weather like during the Civil War? … during Laura Ingalls Wilder’s Long Cold Winter? … or when your great grandparents were alive? How variable was the weather during the 1800s as compared to the 1900s? During the 19th century, starting a few years after the “year with no summer” (1816), organized efforts were made to observe and record weather across the continental United States. The first organized recorded observations began in 1820 by US Army Surgeons at forts across the US (Fig. 1). By the mid-1800s, these observations were noted by volunteers for the Smithsonian Institution, and later by members of the US Army Signal Corps. In the early 1890s, these station networks evolved into the Cooperative Observer Program. This network continues today with some 11,000 volunteer observers taking measurements across the country for the National Weather Service of NOAA, under the Department of Commerce. Currently, these daily observations consist of maximum and minimum temperatures, precipitation, snowfall, and snow depth. The available 19th century weather data are more varied in type, but less consistent between stations and across time.
Understanding long term trends in climate and the variation of these trends requires historical climate records. A 10-year effort (2000-2009) was led by the Climate Data Modernization Program of NOAA’s National Climatic Data Center (NCDC) to preserve, image, digitize and quality control historical climate records for the United States and other regions of the world. The US data effort was accomplished through the coordinated efforts of the Midwestern Regional Climate Center (MRCC), NCDC, and SourceCorp. Observation forms from more than 4,000 US stations from the 19th Century (~1820-1892) were imaged and inventoried at NCDC. Software was developed at the MRCC to capture and store the metadata, which include not only station and instrumentation information, but also explicit information regarding meteorological elements present on each monthly form. The metadata were extracted for 450 of the longest, most complete stations at NCDC. This information was used by daily data keyers based at SourceCorp in London, Kentucky to digitize the data for these stations. Daily data -- including a possible 39 variables -- were keyed for 450 stations. Quality assurance software was developed at the MRCC and applied to 353 of the 450 keyed stations prior to the end of the CDMP program.
The stations which have been quality controlled span the continental US and Alaska (Fig. 2), with the earliest data generally available in the eastern United States, and only a few years available for Alaska. The data, both imaged and keyed, are currently archived at the MRCC. An inventory of these images is available online. The quality controlled data are available upon request in either the 3200 format (all data) or in a simplified text format (temperature, precipitation and metadata). A description of the quality control procedures and information on specific keyed stations is available online. In addition, detailed station histories are available for 70 stations.
Observation practices and instrumentation were not consistent and changed though the 1800s. Therefore, it is not possible to simply add the digitized data to the more recent observations. Temperature is particularly problematic. Until a given station began using the maximum/minimum thermometer, temperature observations were made 3 times per day, often at 7 a.m., 2 p.m. and 7 p.m. Because these times do not always capture the maximum or minimum temperature, and because the thermometer was not always ideally located, analysis (homogenization) is required prior to the incorporation of these data into time series analyses. The transition to max/min thermometers began in the 1850s, but came into common use only in the late 1870s. Data from the max/min thermometers have been integrated into the Global Historic Climate Network (GHCN) dataset. The temperature data, however, are quite useful for case studies. Forts data were used in some of the case studies compiled in Historical Climate Variability and Impacts in North America, edited by Leslie-Ann Dupigmy-Giroux and Cary Mock, Springer Press, 2009. They have been used to verify the winter detailed in Wilder’s “Little House in the Big Woods" (Boustead, B.M. (2012), "The Long Winter: Studying the Climatology of Laura Ingalls Wilder’s Hard Winter of 1880-1881”, Weatherwise, 65(6), 18-24), and in a case study of the intense cold wave of 1836 (Fig. 3) where riders were literally frozen to their saddles.
Pressure and precipitation data are somewhat easier to use, although there are still issues with low precipitation amounts and missing data. All pressure data have been integrated into the 20th Century Reanalysis (20CR) dataset. Currently, the Global Circulation Reanalysis data have been completed from 1872-2008. By the end of 2013, the Global Circulation Reanalysis will extend back to 1845. Daily precipitation data are being used by the US Army Corps of Engineers for examination of extreme flood events, by NOAA NWS Hydrometeorological Design Studies Center (HDSC) to update precipitation frequency estimates, by MetSat, Inc. for precipitation frequency analysis, computation of extreme precipitation indices, and detailed precipitation analyses in Wyoming.
Additionally, researchers from universities, federal and state agencies, and private citizens have obtained data related to specific regions or specific time periods to investigate:
Pre-settlement vegetation and its relationship to climate
Several studies of the monsoon season in the southwest United States
Great Flood of California, 1861/62.
Forest fires and management with regard to weather conditions and prescribed burns
Cold waves in the northwest United States
Genealogical studies and background information for historical fiction
Weather effects on birth, early childhood, mortality and morbidity
Comparison of weather observations with Native American records of climate
Verification of a chronometric dating technique
If you have a use for these data, we would be happy to provide it for you, answer whatever questions you have, and possibly collaborate with you on common areas of research. Contact Nancy Westcott or Leslie Stoecker.
As much as a week before the storms of January 29-30 hit, it was apparent that something significant was in store for much of the eastern part of the country. Forecast models were showing a strong upper-level trough scheduled to dig into the western United States, accompanied by powerful winds. The Storm Prediction Center outlined an area of possible severe weather over Arkansas in their Day Seven outlook, which is exceedingly rare.
Indeed, by the 28th the upper-level trough did invade the Intermountain West. The trough would advance into the Plains on the 29th, and eventually to the Ohio Valley by the 30th.
The first thunderstorms developed ahead of the trough between Amarillo and Lubbock in the Texas Panhandle between three and four o’clock on the morning of the 29th. Those storms moved northeast into Oklahoma, and eventually stretched into a squall line from Missouri to Oklahoma by dawn. The line of storms moved eastward into the Ozarks and produced scattered wind damage and a handful of tornadoes over the course of the day.
Ahead of the trough, winds increased dramatically. On the night of the outbreak, an incredibly strong low level jet, about 5,000 feet above the surface, screamed from the Gulf to the Great Lakes at speeds equivalent to a category 2 hurricane. The NWS Doppler radar at Paducah, Kentucky measured astounding wind speeds of 115 mph at 4,000 feet elevation. As the area of thunderstorms proceeded from the Ozarks into the Mississippi Valley, they encountered the vigorous jet and began to intensify.
As is often the case with overnight wintertime squall lines, instability was almost nonexistent. CAPE (Convective Available Potential Energy) values were less than 200 J/kg and lifted indices were above zero. However, the robust wind fields brought very moist, buoyant air northward from the Gulf of Mexico to feed the storms. Precipitable water amounts were around 1.50 inches, which is about the highest ever measured here in January. This rich source of moisture, plus the dynamic forcing of the incoming system, led to the creation of the Ohio Valley squall line.
Because the winds were so strong and were from different speeds and directions at different heights, wind shear was astronomical. The Paducah radar measured 0-1km storm relative helicity (SRH) values around 600 m2/s2, and 0-3km SRH of 900 m2/s2 just ahead of the line. So, with the lack of instability and abundance of shear, the storms were able to produce tornadoes while having such low tops that there was very little lightning or thunder.
The line grew in strength and size as it plowed eastward, and by the pre-dawn hours stretched from Indiana to Louisiana. While the line itself moved eastward at about 30 mph, the individual storms within the line tore to the northeast at speeds up to 70 mph! These fast storm movements, combined with the great difficulty of picking out tiny circulations within the storms that may lead to tornadoes, made issuing warnings very challenging.
A Tornado Watch was issued for most of southern Indiana and central Kentucky at 10:35 p.m. EST, and NWS-Louisville (LMK) issued its first Severe Thunderstorm Warning at 12:49 a.m. EST as the squall line approached the County Warning Area. LMK ended up issuing 29 Severe Thunderstorm Warnings and 15 Tornado Warnings as the squall line crossed the area between 1 a.m. and 7 a.m. EST.
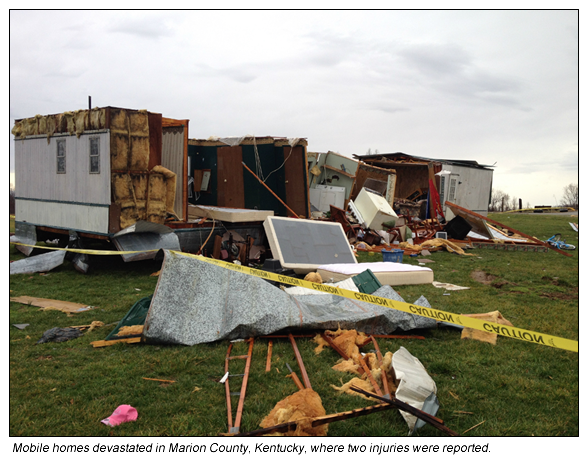
Paths of seven tornadoes were found by official NWS storm survey teams in the days following the storms. Three of them were EF-0, three were EF-1, and one was an EF-2 near Bowling Green. One of the EF-0 tornadoes caused two injuries when it destroyed a mobile home. It was the first EF-0 to cause an injury in central Kentucky since February 6, 2008 (and the first in Kentucky since August 4, 2009).
The Storm Prediction Center issued a Tornado Watch for east central Kentucky at 4:35 a.m. EST, and another Tornado Watch for the central Appalachians at 5:50 a.m. EST as the line continued to tear to the east. The northern half of the line finally began to fall apart by mid-morning on the 30th, but the southern portion charged from Mississippi to the Carolinas by midnight that night and continued to produce severe weather.
This storm event was well-forecasted several days out, allowing meteorologists to alert the population to the likelihood of a severe squall line on the night of the 29th-30th. The event also served as a good reminder that severe weather can happen at any time of day or night, at any time of the year. It is prudent to remain “weather aware” no matter the season!
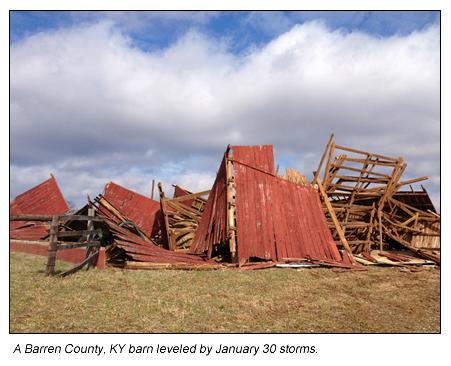
January came to a close with both spring-like severe weather and winter driving conditions that led to several multi-car crashes. The severe weather included tornadoes in four Midwest states on the 29th and 30th, and dozens of wind damage reports. The tornadoes ranged from EF0 to EF2 on the enhanced Fujita scale.
As a cold front moved through the Midwest, winter weather returned, causing slick roads and reduced visibility. On the 31st, fatal multi-car crashes involving dozens of vehicles occurred on interstate highways near both Indianapolis and Detroit. Lake Michigan and Lake Huron reached a new record low water level according to the Army Corps of Engineers. The January 2013 lake level was a fraction of an inch lower than the previous record set in March 1964. Read more...
What was the weather on the day you were born? MRCC has created a tool to find the daily weather report for your birthday. Enter your birthdate, choose the location, and you will see the daily weather reported for that date and location.
Daily weather includes maximum and minimum temperature, precipitation, and snowfall. The results are presented as a printable certificate. This tool has been very popular with students and the public attending the Naturally Illinois Expo each spring. Hundreds of certificates were printed each year as we tried our best to keep up with the long lines that formed. Try it for yourself!
Pest and Crop Growing Degree-Days calculators from the Water and Atmospheric Resources Monitoring Program (WARM).
The Daily Pest Degree Day calculator utilizes a process which compares daily maximum and minimum temperatures to a base temperature, specific for a particular pest, above which development will occur. Over 30 different common pests, which affect crops from corn and soybeans to fruit trees and home gardens, can be selected.
The Daily Crop Growing Degree calculator tracks and projects development of crops in Illinois from daily weather data, utilizing algorithms developed for tracking crops, with two different development thresholds. Growing Degree Days for corn and cold weather crops can both be calculated.
The Water and Atmospheric Resources Monitoring Program (WARM) coordinates data collection activities of several monitoring efforts conducted by the Illinois State Water Survey, measuring the water and atmospheric resources of Illinois. The program includes various statewide observation networks on Illinois climate, surface water, groundwater, in-stream sediment, and soil moisture conditions.
Beth Hall and Leslie Stoecker will be attending the Midwest Regional Town Hall of the National Climate Assessment at the University of Michigan.
Lincoln, IL and Davenport, IA (Feb. 26-27) - MRCC Road Trip
Beth Hall and Nancy Westcott will be traveling through central and northwestern Illinois, with a jump across the river to Davenport, meeting with several National Weather Service offices and other interested climate partners.
Normal, IL (Mar. 6-7) - Illinois Assn. for Floodplain and Stormwater Management Annual Conference
Zoe Zaloudek will be attending the IAFSM conference in Normal, Illinois. This conference will cover a variety of topics related to floodplain mapping such as floodplain management, GIS mapping, state regulations, Letters of Map Change, and the engineering that goes into floodplain studies.
Champaign, IL (Mar. 8-9) - Naturally Illinois Expo
The entire staff of the MRCC will be participating in the fifth annual Naturally Illinois Expo, presented by the Prairie Research Institute. Families, teachers, and students of all ages attend to enjoy exhibits, demonstrations and hands-on activities that showcase the work of the Institute and the State Scientific Surveys.
Chicago, IL (Mar. 11-13) - NWS and EPA
Beth Hall will be visiting with National Weather Service personnel from the Chicago (Romeoville) NWS office, and members of the Environmental Protection Agency.
Email us your local climate impacts! We are constantly keeping a log of how climate is impacting
our region, and our information would not be complete with YOUR help!
Have something to share as a feature article in an upcoming The Climate Observer issue, or
interested in being contacted for an article interview? Please let us know!


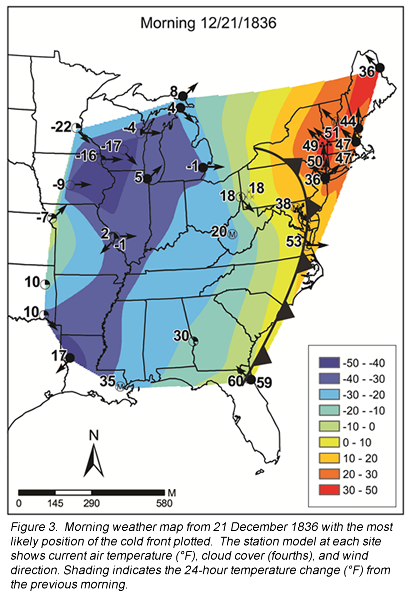 The transition to max/min thermometers began in the 1850s, but came into common use only in the late 1870s. Data from the max/min thermometers have been integrated into the Global Historic Climate Network (GHCN) dataset. The temperature data, however, are quite useful for case studies. Forts data were used in some of the case studies compiled in Historical Climate Variability and Impacts in North America, edited by Leslie-Ann Dupigmy-Giroux and Cary Mock, Springer Press, 2009. They have been used to verify the winter detailed in Wilder’s “Little House in the Big Woods" (Boustead, B.M. (2012), "The Long Winter: Studying the Climatology of Laura Ingalls Wilder’s Hard Winter of 1880-1881”, Weatherwise, 65(6), 18-24), and in a
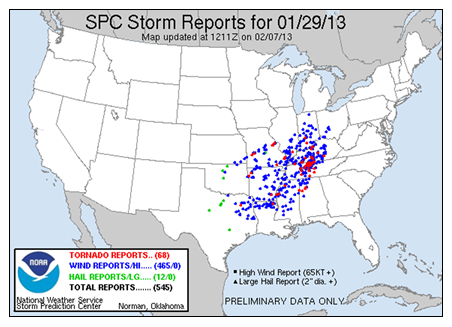
 from the Gulf of Mexico to feed the storms. Precipitable water amounts were around 1.50 inches, which is about the highest ever measured here in January. This rich source of moisture, plus the dynamic forcing of the incoming system, led to the creation of the Ohio Valley squall line.
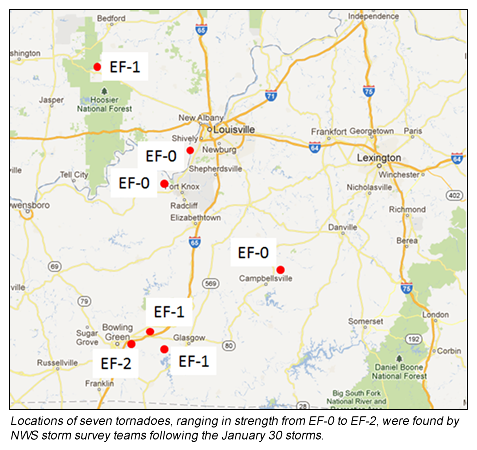
 January came to a close with both spring-like severe weather and winter driving conditions that led to several multi-car crashes. The severe weather included tornadoes in four Midwest states on the 29th and 30th, and dozens of wind damage reports. The tornadoes ranged from EF0 to EF2 on the enhanced Fujita scale.
  Ann Arbor, MI (Feb. 11-13) - NCA Town Hall