On the Road: MN - NCSC Planning Meeting at University of Minnesota MI - National Climate Assessment Midwest Regional Town Hall Meeting IL - Illinois Assn. of Floodplain and Stormwater Managers Conference
The Ice Storm of 2009
Pat Spoden, Science and Operations Officer, NWS Paducah KY
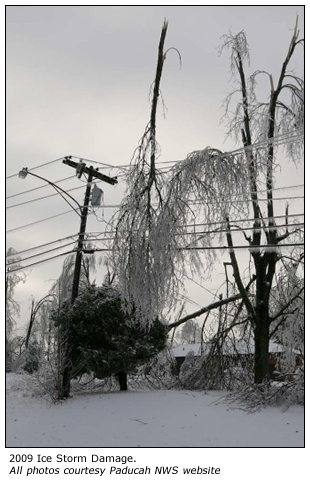
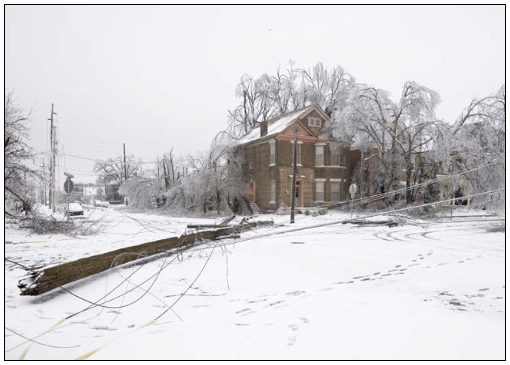
The 2009 Ice Storm was an historic one for the Lower Ohio River Valley. Even the governor of Kentucky called it “the biggest disaster in modern Kentucky history.” Many areas received 1-2 inches of ice which brought devastation to the area’s infrastructure and landscape. Almost every tree along the path of this storm sustained damage; some of the damage can still be seen today. People were without power for weeks and months. The piles of tree debris are gone, the power is back on, but the memory remains embedded within everyone who lived through the event.
From a forecasting standpoint, this event was well forecasted several days out. In fact, forecasters put the word out about a week before the ice started.
A blast of arctic air moved into the lower Midwest on Friday, January 23, 2009. The cold air mass was shallow and hugged the ground, so most surfaces had cooled to below freezing temperatures. Shortly after that time, a low-pressure system developed along the Gulf Coast and brought an unusual amount of moisture northward into the Lower Ohio River Valley. The moisture from the Gulf produced widespread light rain over the cold air mass which resulted in a gradual, but steady accumulation of ice. To the north, the cold air was deeper, so the rain changed to snow and sleet.
Forecasters worked diligently to get the word out that this was not going to be an ordinary ice storm. It was going to be much bigger. Special statements were sent out before the event, telling people to be prepared for power outages and dangerous driving conditions. Conference calls were made with area media outlets and Emergency Managers. The National Weather Service (NWS) in Paducah even held a press conference to alert anyone who would listen. Little did they know, at that time, how devastated the area would become.
The freezing rain began during the evening hours of Monday, January 26, and continued for the next 36 hours or so. To the north of the region, heavy snow and sleet caused damage to at least 2 dozen commercial structures by causing the roofs to collapse.
Although the freezing rain started Monday evening, the real devastation began on Tuesday as more and more power poles were snapped due to the weight of the ice and large tree limbs began falling down. By Tuesday evening, most of the area affected by the ice was without power. Residents reported “green lightning” which in reality was the electrical discharge due to destruction of power substations across the area as more and more ice accumulated.
Many people clearly recall the sound the trees made that night. As the weight of the ice increased, the trees would begin to creak and moan, unlike anything that most of us had heard. The trees could only hold so much weight, and after a while the tree limbs came crashing down with the sound of broken glass (ice). This sound continued on and off for several days. Eventually, the sound of breaking glass was replaced by the sound of chainsaws.
People literally cut themselves routes through the devastation to get to where they needed to be. Not only did the neighborhoods suffer, but downed power lines and trees blocked lanes of major interstates in the area.
Once people were able to move around, they found more problems. With no electricity, only one or two gas stations were open, so lines were long. No ATMs were working, and most stores, if they did open, only allowed a few customers at a time and used cash only. If you did not already have a generator, you had to wait until the next truckload arrived. Then, of course, you had to have fuel to run the generators, which meant more long lines.
Downed trees and power lines took out the telephone land lines, and many AT&T cell towers went down during the storm as well. This meant no communication for a majority of people. One does not know how connected we are as a society until you can no longer connect with anyone.
When your area is impacted by a severe weather event, cash is a good thing to have. It is recommended to have $300 in small bills so that you can go purchase necessity items even if there is no electricity. It is still important to have a credit or debit card on hand, though. When businesses began to recover and phone lines were restored, they preferred to use credit cards as they did not want too much cash in their buildings.
So, what can be learned from this hard lesson? Much! Be prepared! Have enough food and water to last 3-7 days. Make sure you have enough supplies for your pets too. What about heating your home? Do you have a generator to run the essentials? Do you have enough fuel for the generator? For more information on how you can prepare for a disaster (such as an ice storm, earthquake, etc.) please visit the Paducah NWS Weather Education page for weather safety and preparedness information
Jennie Atkins, Water and Atmospheric Resources Monitoring Program, Illinois State Water Survey
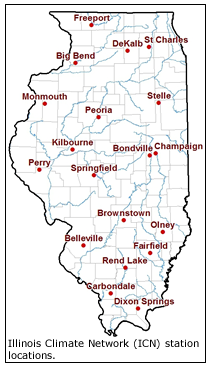
Since 1989, the Illinois Climate Network (ICN) has provided timely, reliable weather and soil data to the citizens of the state. The network is a part of the Illinois State Water Survey’s Water and Atmospheric Monitoring (WARM) program, which consists of long-term water and climate networks that provide data to the state’s decision makers, whether they are government officials developing management plans or the individual farmer deciding when to fertilize his fields.
ICN was originally designed as a weather network to support Illinois’ vast agricultural community. Today it has expanded to provide hourly and daily climate data to support the agricultural, energy, and research communities. The network consists of nineteen stations, mainly situated in rural or suburban areas, which measure numerous parameters, including air temperature, wind speed and direction, solar radiation, and soil temperature and moisture.
Hourly and daily data are posted on the WARM website. Monthly data summaries are also provided. In addition, pest and growing degree day calculators that allow users to project pests and crop development using ICN data are available on the site.
Data from ICN and other WARM networks are summarized monthly in the Illinois Water and Climate Summary. The summary provides details on weather and water conditions throughout the state as well as their impacts on water resources.
The data collected through the network have been used by various governmental agencies and academic researchers for analysis and modeling. ICN’s soil moisture data were included in statewide drought reports this past year. Engineers at the University of Illinois at Urbana-Champaign have used the data in the study of solar and wind energy resources within the state. Agricultural modelers from the University of Nebraska-Lincoln and Pennsylvania State University include ICN data in the predictions of corn yields and Fusarium head blight in wheat, respectively.
A warm December brought 2012 to a close, setting records for the warmest year. The nine-state Midwest region recorded the warmest year on record using NCDC data that goes back to 1895, including a new statewide record in Missouri and tied records in Illinois and Ohio. The other six states in the region recorded annual temperatures among the top three. Many locations broke annual temperature records, including at major cities in each of the states with records extending back prior to 1900.
2012 precipitation was below normal in the Midwest. Following a wet year in 2011 with three states setting records for their wettest year and two additional states among the top 10%, 2012 had four Midwest states among the driest 10% in their records going back to 1895. Drought was a major story in the Midwest in 2012 with large areas affected. Read more...
Multi-sensor precipitation is mapped for the Midwest and the Central US daily for 1-day, 7-day, and 30-day periods. The data blends precipitation totals from radar estimates, rain gauges, and satellite data. The data are created by the NWS River Forecast Centers, and hosted at the Advanced Hydrologic Prediction Service. MRCC downloads the data each day and creates maps of our region. The resolution of the data is about 4km (roughly 2.5 miles) . Normal precipitation is derived from PRISM climate data. Hourly data is also available for most of the US.
NOAA's Storm Prediction Center (SPC) provides near-real-time (updated every 10 minutes) Storm Reports for the lower 48 states that includes reports on hail, high winds, and tornadoes. Information for the storm reports is provided by storm spotters, emergency managers, law enforcement and other individuals, and relayed from local National Weather Service Offices to the SPC. The National Climatic Data Center (NCDC) archives these reports, along with others such as extreme heat, extreme cold, lightning, fog, and more, in their Storm Events Database.
Storm Reports can be queried for an individual date for the contiguous 48 states, while the Storm Events Database can be queried by individual date or date range, plus county or zone within all 50 states.
Minneapolis, MN (Jan. 17-18) - Northeast Climate Science Center Stakeholder and Science Planning meeting at the University of Minnesota
The objective of the NECSC is to improve the way climate science informs resource management in the Northeast; to provide scientific information, tools, and techniques that managers and other parties interested in land, water, wildlife and cultural resources can use to anticipate, monitor, and adapt to climate change in the Northeast region. Dr. Beth Hall will be participating.
Ann Arbor, MI (Feb. 12) - National Climate Assessment Midwest Regional Town Hall Meeting at the University of Michigan
Mike Timlin will be participating in this town hall meeting which brings together approximately 100 climate change experts and users of climate change information, including participants from academia; local, state, tribal, and federal governments; non-profit organizations; and business and industry.
Normal, IL (Mar. 6-7) - Illinois Association of Floodplain and Stormwater Managers Conference
Zoe Zaloudek will be attending this annual conference. Speakers from federal, state, regional, and local agencies and the private sector will share their knowledge on current programs and the latest techniques. The conference provides both an excellent training forum and an opportunity to meet and talk with other floodplain and stormwater management professionals.
Email us your local climate impacts! We are constantly keeping a log of how climate is impacting
our region, and our information would not be complete with YOUR help!
Have something to share as a feature article in an upcoming The Climate Observer issue, or
interested in being contacted for an article interview? Please let us know!

 Departure")


 The 2009 Ice Storm was an historic one for the Lower Ohio River Valley. Even the governor of Kentucky called it “the biggest disaster in modern Kentucky history.” Many areas received 1-2 inches of ice which brought devastation to the area’s infrastructure and landscape. Almost every tree along the path of this storm sustained damage; some of the damage can still be seen today. People were without power for weeks and months. The piles of tree debris are gone, the power is back on, but the memory remains embedded within everyone who lived through the event.
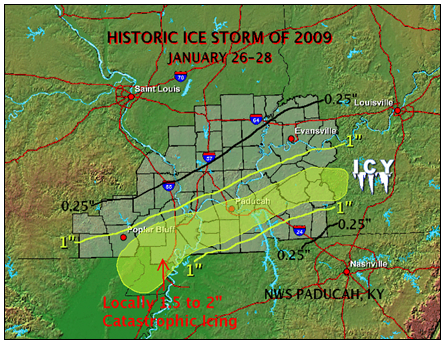 telling people to be prepared for power outages and dangerous driving conditions. Conference calls were made with area media outlets and Emergency Managers. The National Weather Service (NWS) in Paducah even held a press conference to alert anyone who would listen. Little did they know, at that time, how devastated the area would become.
 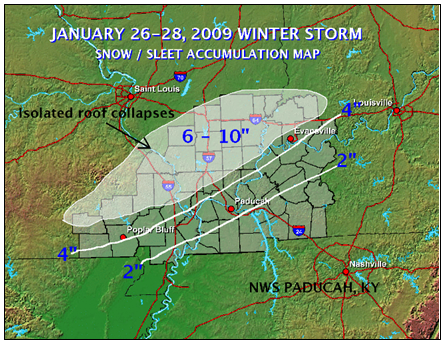 began falling down. By Tuesday evening, most of the area affected by the ice was without power. Residents reported “green lightning” which in reality was the electrical discharge due to destruction of power substations across the area as more and more ice accumulated.
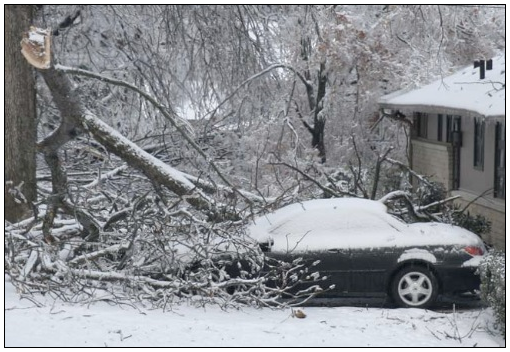
 Since 1989, the Illinois Climate Network (ICN) has provided timely, reliable weather and soil data to the citizens of the state. The network is a part of the Illinois State Water Survey’s Water and Atmospheric Monitoring (WARM) program, which consists of long-term water and climate networks that provide data to the state’s decision makers, whether they are government officials developing management plans or the individual farmer deciding when to fertilize his fields.
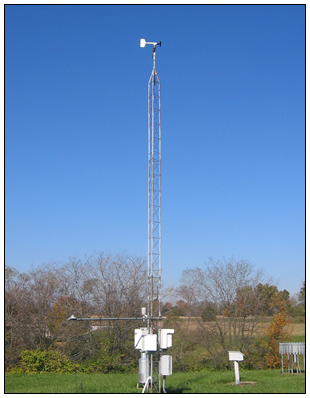 Data from ICN and other WARM networks are summarized monthly in the
 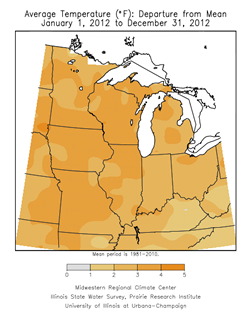 A warm December brought 2012 to a close, setting records for the warmest year. The nine-state Midwest region recorded the warmest year on record using NCDC data that goes back to 1895, including a new statewide record in Missouri and tied records in Illinois and Ohio. The other six states in the region recorded annual temperatures among the top three. Many locations broke annual temperature records, including at major cities in each of the states with records extending back prior to 1900.
 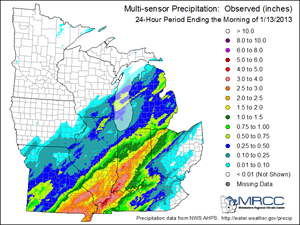 Multi-sensor precipitation is mapped for the
 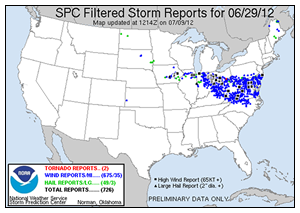 NOAA's Storm Prediction Center (SPC) provides near-real-time (updated every 10 minutes) Storm Reports for the lower 48 states that includes reports on hail, high winds, and tornadoes. Information for the storm reports is provided by storm spotters, emergency managers, law enforcement and other individuals, and relayed from local National Weather Service Offices to the SPC. The National Climatic Data Center (NCDC) archives these reports, along with others such as extreme heat, extreme cold, lightning, fog, and more, in their Storm Events Database.
 Minneapolis, MN (Jan. 17-18) - Northeast Climate Science Center Stakeholder and Science Planning meeting at the University of Minnesota