On the Road: WI - National Weather Assoc. Annual Meeting IL - Chicago National Weather Service Open House IN, OH, KY, IL - MRCC Fall Regional Roadtrip WI - Annual NIFC Predictive Services Workshop
Hurricane Isaac Brings Much-Needed Rain to Parts of the Midwest
Jim Angel, Illinois State Climatologist
The remnants of Hurricane Isaac passed over the Midwest over Labor Day weekend, providing much needed rainfall to drought-stricken Missouri, Illinois, Indiana, Ohio, and Kentucky. Rainfall amounts of 1 to 6 inches were common across the region. Some of the heaviest and most widespread amounts fell in Illinois.
Before the arrival of Isaac, the Midwest was in the grip of another major drought. According to the US Drought Monitor, 97% of Missouri, 70% of Illinois, and 39% of Indiana were in the two worst drought categories (D3 and D4). Western and central Kentucky and much of Ohio were experiencing drought conditions as well.
After Isaac, soil moisture has improved considerably. In fact, almost all the rain soaked into the ground, in part because it was spread out over three days in most areas. Calculations by an Illinois State Water Survey senior hydrologist, Vern Knapp, suggest that on average in Illinois only 0.1 inches of runoff was produced during the storm.
After the passage of Isaac, drought conditions eased with Missouri going from 97% to 25% in D3 and D4. Illinois went from 70% to 7%, a ten-fold reduction. Although considered too late to help the corn crop, the rains from Isaac provided some help for soybeans, pasture, and the prospects for winter wheat.
It is not unusual for tropical storms to make their way into the Midwest after striking the central Gulf Coast. Of course, by the time they reach the Midwest their winds are considerably reduced. But these large, slow-moving systems can produce lots of rain. Back in 2008, the remnants of Hurricanes Ike and Gustav dropped 6 to 12 inches across Missouri, Illinois, northern Indiana, and southern Michigan.
Perhaps a better comparison is with the drought of 2005. Like this year, portions of Illinois, Indiana, and Missouri were faced with drought while southern Indiana, Kentucky, and Ohio experienced abnormally dry conditions, according to the June 5, 2005 US Drought Monitor. However, the remains of four tropical systems brought needed rainfall into the region, especially along the Ohio River Valley. The four tropical systems were Tropical Storm Arlene in June, Hurricane Dennis in July, Hurricane Katrina in August, and Hurricane Rita in September. As a result, for the period from June 11th to September 26th of 2005, an additional 4 to 8 inches fell across southeastern Missouri, southern Illinois, western Kentucky, the southern half of Indiana, and central Ohio.
While tropical storms such as Hurricane Isaac can cause considerable damage along the Gulf Coast, they can provide beneficial rains as well. In the case of 2012, it provided a jump start to the normal recovery of the hydrologic system that occurs in the fall and winter across the Midwest.
Stephen Marien, Fire Weather Program Manager, Eastern Area Coordination Center
Wildfire activity is commonly believed to be a threat across the western U.S. However, wildfires also occur over the eastern half of the United States. Due to greater urban interface and less topography, wildfires across the central and eastern U.S. generally are shorter in duration.
Live and dead vegetation fuel moistures (how wet or dry the ignitable vegetation is) across the central and eastern U.S. are generally affected by short to medium weather trends. As a result, wildfire activity across the eastern U.S. is dictated by short to medium range weather trends as well. Smaller fuels such as grasses and small shrubs and plants are affected the greatest by short-term weather trends. Medium- to large-sized fuels are affected by both short and longer range weather trends.
The medium range drought which developed across much of the Mid-Mississippi Valley through the summer of 2012 created above normal fire potential and is indicated in the figure below (Figure 1). The grey dots displayed on the map represent large fires which occurred in the Mid-Mississippi Valley through August 2012. The areas highlighted in red represent forecasted above normal significant fire potential.
1000 hour or large sized vegetation fuel moistures during the summer of 2012 across southern Missouri were at record low levels due to the severe drought which developed (Figure 2). Lower fuel moisture levels represent a greater threat of wildfires.
Fire activity across portions of the Mid-Mississippi Valley increased as the summer of 2012 progressed due to the developing drought. This activity affected the region's ability to send wildfire resources such as personnel and engines to fires across the western U.S. As rainfall increased across portions of the Mid-Mississippi Valley through late August and early September, fire activity and overall fire potential decreased.
Short to medium range drought shifted to the Upper Mississippi Valley later in the summer and into the early fall of 2012. This drought is forecast to persist through the remainder of the fall fire season across this region, as indicated in the U.S. Seasonal Drought Outlook issued by NOAA's Climate Prediction Center on September 20, 2012 (Figure 3).
1000 hour fuel moistures decreased across portions of the Upper Mississippi Valley as a result of the drought development. Figure 4 below displays 1000 fuel moistures across northwestern Minnesota through the latter half of the summer of 2012 displayed in light blue. 1000 fuel moistures across northwestern Minnesota are considered critical below 17 percent. Large fuels become involved below this level as well as prolonged mop-up and containment of fires. Peat fires are also more common as 1000 fuel moistures decrease.
Until rainfall activity increases across the Upper Mississippi Valley, above normal fire potential is expected to persist into the fall of 2012.
September saw a wide contrast in precipitation from north to south. Most of Minnesota received less than an inch of rain while a few stations in southern Illinois topped 14” for the month. Minnesota had its driest September on record and Wisconsin its 9th driest while Ohio (4th wettest) and Kentucky (7th wettest) were very wet.
The Midwest was cooler than normal in September, ending a string of 11 straight months above normal. For the first month since January 2011, all nine statewide temperatures were at or below normal. Despite the cool month, each of the states in the region still rank 2012 as the warmest or second warmest January to September period on record.
The first fall freeze brings the growing season to an end each year and is monitored by NWS personnel, farmers, and gardeners. The MRCC fall freeze maps document the timing of the first fall freeze (32°F and 28°F thresholds) at several hundred of stations across the Midwest and High Plains. The maps are updated each day. Stations with sufficient data are noted by dots indicating either that a freeze has not yet occurred at that station or the approximate date of the first freeze. Additional maps show the median date of the first freeze for 1981-2010 for comparison with the current year. State maps can also be viewed by clicking on a state in any of the regional maps.
Just as the dashboard of a car gives you a quick look at the status of your vehicle, the Global Climate Dashboard from NOAA Climate.gov (scroll to the bottom of the page to access the dashboard) gives you a quick look at the status of Earth’s climate system. The interactive graphs let you explore climate-relevant measurements and the relationships among them for different time periods. The climate-relevant measurements you can explore include global temperature, carbon dioxide, sea level, Arctic sea ice, spring snow cover, ocean heat, sun’s energy, glaciers, and annual greenhouse gas index. You can also explore variables related to climate variability (e.g. El Niño/La Niña Index and Arctic Oscillation) and modeled climate projections.
Beth Hall and Allan Curtis will be traveling into Indiana, Ohio, Kentucky, and Illinois to meet with folks interested in climate data and analysis tools. If you're in any of these areas and would like for them to stop by, please let them know!
Milwaukee, WI (Nov. 12-15) - Annual NIFC Predictive Services Workshop
Beth Hall will be participating in the National Interagency Fire Center's (NIFC) annual Predictive Services Workshop that brings partners and agencies together to better predict and plan for the potential of wildfire outbreaks across the U.S.
Email us your local climate impacts! We are constantly keeping a log of how climate is impacting
our region, and our information would not be complete with YOUR help!
Have something to share as a feature article in an upcoming The Climate Observer issue, or
interested in being contacted for an article interview? Please let us know!


 amounts of 1 to 6 inches were common across the region. Some of the heaviest and most widespread amounts fell in Illinois.
  prospects for winter wheat.
 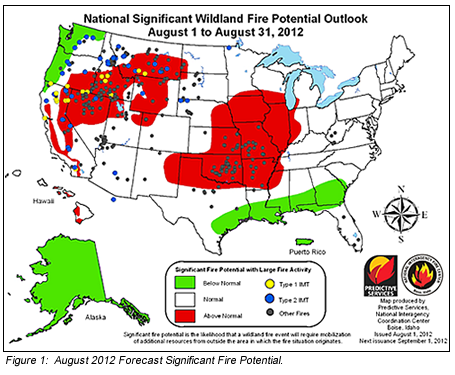 U.S. is dictated by short to medium range weather trends as well. Smaller fuels such as grasses and small shrubs and plants are affected the greatest by short-term weather trends. Medium- to large-sized fuels are affected by both short and longer range weather trends.
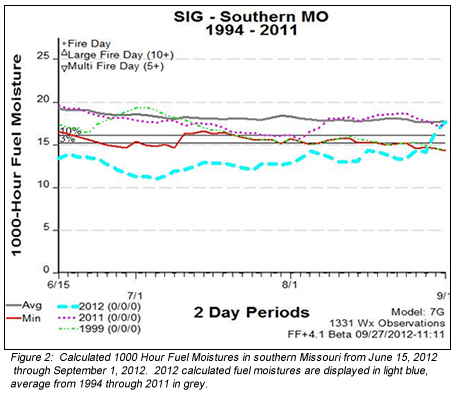 1000 hour or large sized vegetation fuel moistures during the summer of 2012 across southern Missouri were at record low levels due to the severe drought which developed (Figure 2). Lower fuel moisture levels represent a greater threat of wildfires.
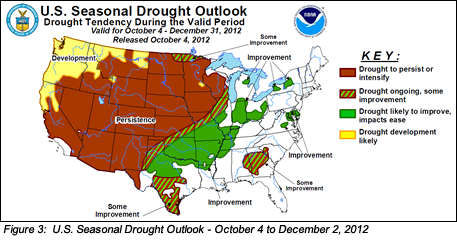 fire season across this region, as indicated in the U.S. Seasonal Drought Outlook issued by NOAA's Climate Prediction Center on September 20, 2012 (Figure 3).
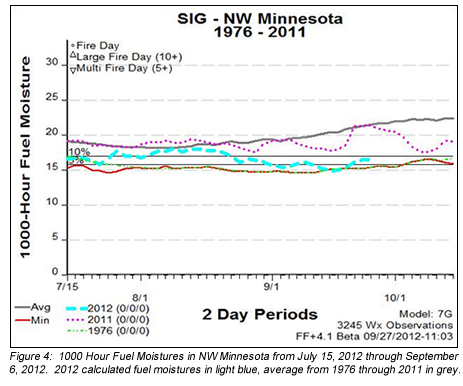

 September saw a wide contrast in precipitation from north to south. Most of Minnesota received less than an inch of rain while a few stations in southern Illinois topped 14” for the month. Minnesota had its driest September on record and Wisconsin its 9th driest while Ohio (4th wettest) and Kentucky (7th wettest) were very wet.
  Madison, WI (Oct. 6-11) - National Weather Association Annual Meeting