On the Road:
FL - AASC
IL, WI, MN, IA-
Road Trip
NY - ACIS
Workshop
Enviro-Weather: A Weather-based Information System for Pest,
Natural Resource, and Agricultural Production Management in
Michigan
Jeff Andresen, Larry Olsen, Beth Bishop, Tracy Aichele, Steve Marquie, Jim Brown,
Steve Miller, Aaron Pollyea, and Joy Landis - Michigan State University
The overarching mission of the Michigan State University-based Enviro-weather Project is the provision of relevant, dependable, and sustainable weather-based information to support agricultural pest, production, and natural resource management decision-making in Michigan. Such information allows for more efficient and profitable farming operations and for the state’s agricultural and green industries to remain competitive in global markets and economies. Enviro-weather collects, processes and archives detailed weather data from an automated meso-network across the state and provides a web-based framework for its use in a variety of applications and products. Continuing support for Enviro-weather is provided by Michigan AgBioResearch, Michigan State University Extension, the State of Michigan through the Generating Research and Extension to meet Economic and Environmental Needs (GREEEN) Project, external grants, the state’s various commodity groups, and from individual growers. The system is available for free public access on the worldwide web atwww.enviroweather.msu.edu.
The Enviro-weather Project began operation in 2006, the result of a joint effort of the Michigan Climatological Resources Program and the Michigan State University Integrated Pest Management Program. The major elements and functions of the system are environmental monitoring, model application, and integrated delivery of products and education in their usage. The primary source of environmental information for the system is an automated weather mesonetwork (formerly the Michigan Automated Weather Network), which has grown considerably from 6 sites at its formation in 1997 to more than 70 in 2012 (Figure 1). The system also integrates a substantial amount of weather forecast information from the National Weather Service via a dedicated Internet Data Distribution link. Geographical coverage of the network has also grown to additional areas of the state and to nearby sections of eastern Wisconsin. Enviro-weather stations (Figure 2) are designed with a variety of sensors required for diverse applications in agriculture and natural resources and include:
Air temperature and relative humidity (5-foot level)
Rainfall
Wind speed and direction (10-foot level)
Solar Radiation
Soil temperature (at 2” and 4” depths)
Volumetric Soil Moisture (at 0-12” and 12”-24” levels)
Leaf Wetness (at a 39” high reference location and in a specified crop canopy)
Observations at each station are taken automatically every 3-60 seconds (depending on sensor) and downloaded to a central computer via cellular-IP phone telemetry for dissemination to the public through via the www. Data are updated on a real-time basis throughout the growing season at 30-minute intervals and every 3 hours November through February. Data quality control procedures include automated data scans, visual data inspection by a project team member, and regularly scheduled preventative maintenance site visits. Raw station data can be accessed at www.agweather.geo.msu.edu/
mawn. At this page, select a station site of interest and select the ‘Custom Reports (Data on Demand)’utility for data extraction.
The number of weather-driven applications available on the Enviro-weather site has increased from 19 in 2007 to more than 50 today. The applications are generally organized by commodity type and function and range from forecasts of insect phenological stage to estimates of crop water use (there are two separate irrigation scheduling programs included on the site) to tabular comparisons of recent past weather conditions with previous years. After accessing the site, users select an observation site of interest and then are provided access to products and applications via pop-up menus. Many of the applications are interactive and some require user input (e.g. scouting observations, biofixes). All Enviro-weather applications were created for or have been validated for Michigan conditions, but are flexible enough for use outside of Michigan within the Great Lakes region. An example of a weather-driven application (apple scab disease risk) is given in Figure 3. In this case the output identifies leaf wetting events and the potential disease risk by day. The site also includes links for further information on the disease/pest of interest as well as treatment options. While the system was initially heavily-oriented towards fruit applications in the early years of the project, it has broadened significantly in scope and now includes a number of applications for other commodities (e.g. Landscape and Nursery operations, Field Crops, Vegetables, Turfgrass, and Christmas Trees). The website is modular in design to allow periodic expansion for new applications. Overall growth and development of the system is guided with on-going input from a project advisory committee, ad hoc industry working groups, commodity supporters, and users.
Use of the Enviro-weather site is growing rapidly. Since the inception of the site in 2006, use of the site has grown from less than 800 applications accessed per week initially to an average of almost 4000 per day during 2011. There is also increasing evidence of the value of detailed weather information. In 2011, the Enviro-weather Program conducted a survey of approximately 1000 cherry and apple growers across Michigan regarding their perceptions of Enviro-weather and the use of weather-related information in fruit production. Enviro-weather users reported significant reductions in their use of pesticides as a result of the information provided by the system (relative to non-users), including approximately 0.5 fewer total applications per grower per insect pest and approximately 0.3 to 0.5 fewer total applications per grower per disease. They also reported increases of more than 5% in both crop yield and quality. Collectively, the yearly economic impact associated with the use of Enviro-weather-based information for Michigan apple and cherry production including reduction in pesticide applications, increased yield and labor savings, was estimated to be more than $1.7 million dollars. This figure is a very conservative estimate of overall economic value of the system as it only considers two crops, does not include the economic impact of the increase in crop quality, and only considers the impacts of currently available disease and insect applications (9 total).
For questions or further information, please contact the Enviro-weather Project Coordinator at 517.432.6520 or bishop@msu.edu.
Jeff Andresen is the Michigan State Climatologist with the Department of Geography at Michigan State University. He can be reached at 517-432-4756 and andresen@msu.edu
Very dry conditions were impacting all of Missouri by the end of June, with nearly 90% of the state experiencing various levels of drought, ranging from moderate to extreme drought according to the U.S. Drought Monitor map. The dry spell, however, has not been exclusively a June phenomenon. Dryness first began to emerge in April over southeastern and west central sections of Missouri, where a few locations in the Bootheel reported less than 1-inch for the month.
As May progressed, the dryness spread northward to encompass much of the state by the end of the month. May precipitation was nearly 3 inches below normal statewide, with preliminary rainfall data indicating a statewide average monthly total of 2.20 inches, and guaranteeing a position in the “Top 10” driest Mays for Missouri.
Numerous sunny days during May (Figure 1), coupled with above normal temperatures and below normal relative humidity led to unusually high moisture loss from soils, vegetation and water surfaces for the month – a process known as evapotranspiration, or ETo (Figure 2). These conditions, in combination with lack of rainfall, resulted in a flash drought across much of the state as agricultural and horticultural impacts rapidly emerged. Reports of deteriorating pastures, declining soil moisture reserves, limited stock water supplies, and crop stress (Figures 3 and 4) increased as May progressed. Homeowners’ lawns began turning brown and irrigation was going at a summer-like pace in many locations. Several automated weather stations across the state estimated short crop ETo rates of 0.20”/day, and totals approached 6 inches for the month, more typical of summer.
Drought conditions persisted in June and preliminary data indicate a statewide average precipitation total of less than 2-inches, likely ranking in the “Top 10” driest Junes on record for Missouri (Figure 5). The combined May-June average rainfall for the state was just over 4-inches, ranking it the 6th driest May-June period on record and the driest since 1988. Highly unusual triple digit temperatures were also experienced throughout the state toward the end of the June, which was the earliest since 1988.
According to the Missouri Ag Statistics Service Field Office, 87% and 85% of the topsoil and subsoil moisture supplies, respectively, were in short to very short condition toward the end of June. Corn and soybean conditions were 26% and 35% poor to very poor, respectively. Pasture condition had declined to 58% poor to very poor. Hay and stock water supplies were also declining.
Historically, a dry May-June period does not bode well for Missouri. Figure 6 shows the Top 16 driest May-June periods on record for the state, and what happened the following July in regard to temperature and precipitation departures. Climatology indicates 60%, 27% and 13% were hotter, cooler, and near normal, respectively and 73%, 13%, and 13% were drier, wetter, and near normal, respectively.
Patrick Guinan is the Missouri State Climatologist with the Missouri Climate Center of the University of Missouri. He can be reached at 573-882-5908 and guinanp@missouri.edu.
June was another dry month for most of the Midwest. The southern two-thirds of the region saw a rapid spread and intensification of drought. During the month, areas in drought quadrupled while areas in Severe Drought increased from less than 2% to more than 15% and Extreme Drought was introduced to over 5% of the region. The upper Midwest was the only part of the region to get above normal rains. The adage “when it rains, it pours” applied to the area around Duluth, Minnesota on the 19th and 20th when rains of 6” to 10” caused flash flooding throughout the city and surrounding areas.
Temperatures fluctuated above and below normal for much of June, but in the waning days of the month a heat wave that had been baking the High Plains moved into the region. Temperatures soared into the triple digits across much of Missouri, Illinois, Indiana, Ohio, and Kentucky with many readings between 105°F and 110°F. Some all-time records were set and other locations recorded their warmest temperatures since the 1940s or 1950s. Read more...
The MRCC Drought Information web page is a compilation of drought-related climate products from the MRCC and other climate partners to provide users with a centralized resource for drought information. National, regional, and state-level drought products are available for decision-makers and drought enthusiasts to continuously monitor the current and potential magnitude of drought and drought-related parameters such as soil and crop moisture. Products developed by the MRCC include the gridded precipitation and soil moisture maps.
The Southeast Regional Climate Center has developed a highly informative, at-a-glance, web mapping and data summary tool. The tool provides daily surface weather information and puts the data into geographical and historical climate perspectives. Streaks, thresholds, and ranks are among the climate perspectives that this tool offers for individual stations displayed on regional maps. This tool provides information for the entire U.S. Click to see the Midwest.
Miramar Beach, FL (July 9-12) – American Association of State Climatologists (AASC) annual conference
Beth Hall, Mike Timlin, Nancy Westcott, and Molly Woloszyn will be gathering with many state and regional climatologists at the annual AASC meeting. This will be an opportunity to hear from many states about their climate, learn about new climate services, and network with a great group of climate scientists.
Beth Hall and Mike Timlin will be hitting the road for the second of three scheduled regional road trips of 2012. The goals of these road trips are to personally meet with our climate partners and network with anyone interested in climate data and products. Cities along this summer road trip include Dekalb, IL, Madison, WI, Lacrosse, WI Minneapolis-St. Paul, MN, Ames, IA, and Des Moines, IA.
Ithaca, NY (August 7-9) – Applied Climate Information System (ACIS) workshop
ACIS is one of the main climate data management systems that all of the regional climate centers (RCCs) use to deal with the complex flow of information from data storage systems to the end user of climate information in terms of products and tools. Accessing climate data through ACIS can be accomplished through the use of web system calls. Allan Curtis and Leslie Stoecker will be attending a training workshop to better understand and utilize these web calls to make accessing our climate tools more efficient.
Email us your local climate impacts! We are constantly keeping a log of how climate is impacting
our region, and our information would not be complete with YOUR help!
Have something to share as a feature article in an upcoming The Climate Observer issue, or
interested in being contacted for an article interview? Please let us know!


 Departure")


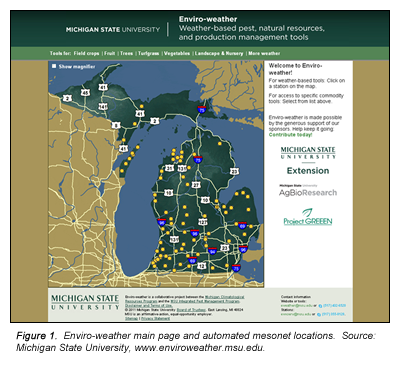 The Enviro-weather Project began operation in 2006, the result of a joint effort of the Michigan Climatological Resources Program and the Michigan State University Integrated Pest Management Program. The major elements and functions of the system are environmental monitoring, model application, and integrated delivery of products and education in their usage. The primary source of environmental information for the system is an automated weather mesonetwork (formerly the Michigan Automated Weather Network), which has grown considerably from 6 sites at its formation in 1997 to more than 70 in 2012 (Figure 1). The system also integrates a substantial amount of weather forecast information from the National Weather Service via a dedicated Internet Data Distribution link. Geographical coverage of the network has also grown to additional areas of the state and to nearby sections of eastern Wisconsin. Enviro-weather stations (Figure 2) are designed with a variety of sensors required for diverse applications in agriculture and natural resources and include:
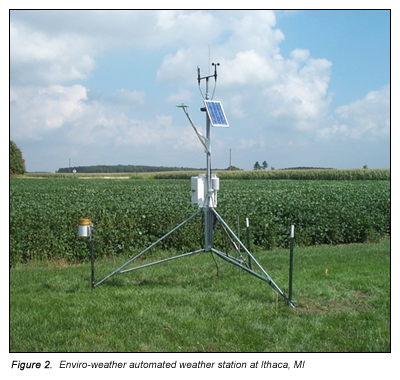 Observations at each station are taken automatically every 3-60 seconds (depending on sensor) and downloaded to a central computer via cellular-IP phone telemetry for dissemination to the public through via the www. Data are updated on a real-time basis throughout the growing season at 30-minute intervals and every 3 hours November through February. Data quality control procedures include automated data scans, visual data inspection by a project team member, and regularly scheduled preventative maintenance site visits. Raw station data can be accessed at
 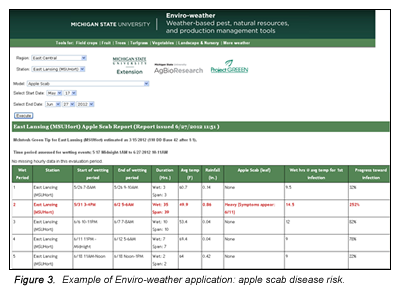 for Michigan conditions, but are flexible enough for use outside of Michigan within the Great Lakes region. An example of a weather-driven application (apple scab disease risk) is given in Figure 3. In this case the output identifies leaf wetting events and the potential disease risk by day. The site also includes links for further information on the disease/pest of interest as well as treatment options. While the system was initially heavily-oriented towards fruit applications in the early years of the project, it has broadened significantly in scope and now includes a number of applications for other commodities (e.g. Landscape and Nursery operations, Field Crops, Vegetables, Turfgrass, and Christmas Trees). The website is modular in design to allow periodic expansion for new applications. Overall growth and development of the system is guided with on-going input from a project advisory committee, ad hoc industry working groups, commodity supporters, and users.
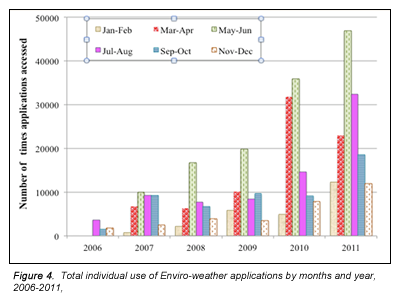 and the use of weather-related information in fruit production. Enviro-weather users reported significant reductions in their use of pesticides as a result of the information provided by the system (relative to non-users), including approximately 0.5 fewer total applications per grower per insect pest and approximately 0.3 to 0.5 fewer total applications per grower per disease. They also reported increases of more than 5% in both crop yield and quality. Collectively, the yearly economic impact associated with the use of Enviro-weather-based information for Michigan apple and cherry production including reduction in pesticide applications, increased yield and labor savings, was estimated to be more than $1.7 million dollars. This figure is a very conservative estimate of overall economic value of the system as it only considers two crops, does not include the economic impact of the increase in crop quality, and only considers the impacts of currently available disease and insect applications (9 total).

 June was another dry month for most of the Midwest. The southern two-thirds of the region saw a rapid spread and intensification of drought. During the month, areas in drought quadrupled while areas in Severe Drought increased from less than 2% to more than 15% and Extreme Drought was introduced to over 5% of the region. The upper Midwest was the only part of the region to get above normal rains. The adage “when it rains, it pours” applied to the area around Duluth, Minnesota on the 19th and 20th when rains of 6” to 10” caused flash flooding throughout the city and surrounding areas.
  Miramar Beach, FL (July 9-12) – American Association of State Climatologists (AASC) annual conference