Information on Spring Freeze Maps
The Spring Freeze map tracks freezing temperatures in the spring combined with baseline growing degree day (GDD) information. The map is updated daily. Each station on the map is marked by a small black dot. As long as a station records a minimum temperature equal to or less than 28 degrees F, it remains a small black dot. Once a station records at least one day with a minimum temperature greater than 28 degrees F, it is marked by a large dot filled with a color determined by the date of the last freeze. If a station has recorded a minimum temperature greater than 32 degrees F in each of the last 14 days, the station is marked by an open circle with the color representing the date of the last freezing temperature.
The changing station symbology is intended to de-emphasize the areas that are still freezing every day and those that have been above freezing for a period of time. It also makes it easier to determine if it has been some time since the last freeze. The map includes shading to indicate those areas that have accumulated 150 GDD. The implication is that plant development may have occurred in these areas to the extent that another freeze could cause damage to vegetation.
An Example of the Spring Freeze Map – April 2007
In the spring of 2007 unseasonably warm weather the last ten days of March and the first few days of April was followed by record-breaking cold weather. While freezing weather is not at all unusual in early April, the warm weather of late March promoted rapid development and plants and tree buds. Temperatures remained below freezing in some areas for several days, and a hard freeze (temperatures less than 24 degrees F) occurred over the entire region on April 7, with subfreezing temperatures well south of the Ohio River. The damage and impacts to agriculture in the eastern half of the country exceeded 2 billion dollars.
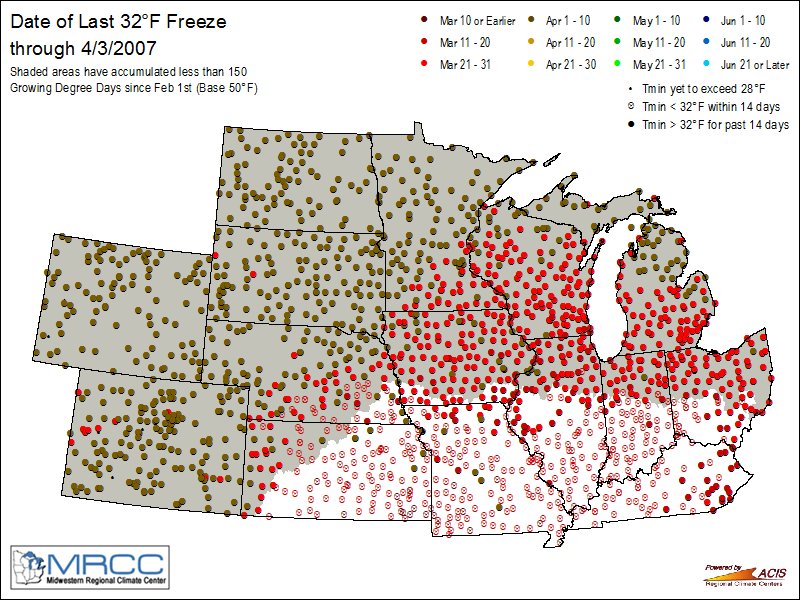
This map shows the map for April 3, 2007, prior to the devastating freeze. The open red circles across the southern half of the region indicate where it has been at least 14 days since the last freezing temperatures. The gray shading shows the area where 150 or more growing degree days (GDD) have accumulated. Vegetation within the gray-shaded area would be most susceptible to freezing temperatures. Growing degree days are calculated using a base of 50°F and are accumulated beginning February 1.
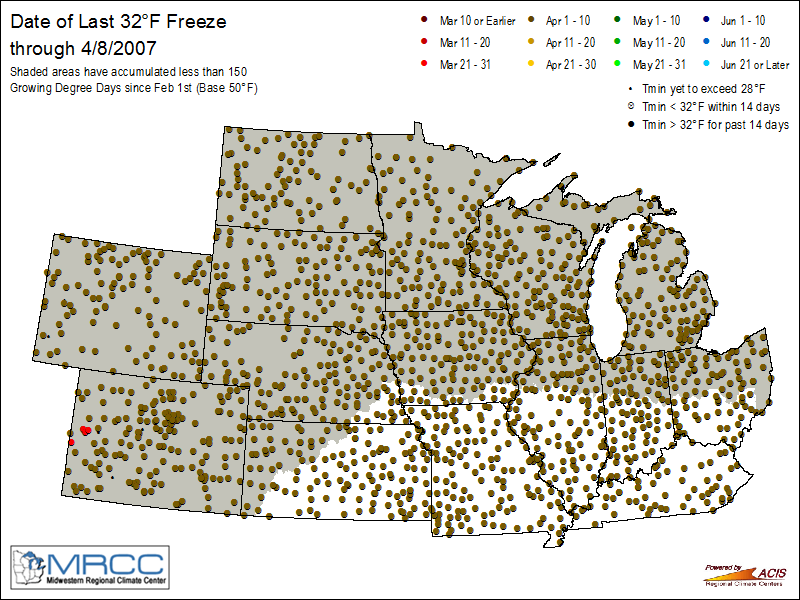
The dark brown dots on the map on this map for April 8, 2007 indicate that freezing temperatures have occurred since April 3.
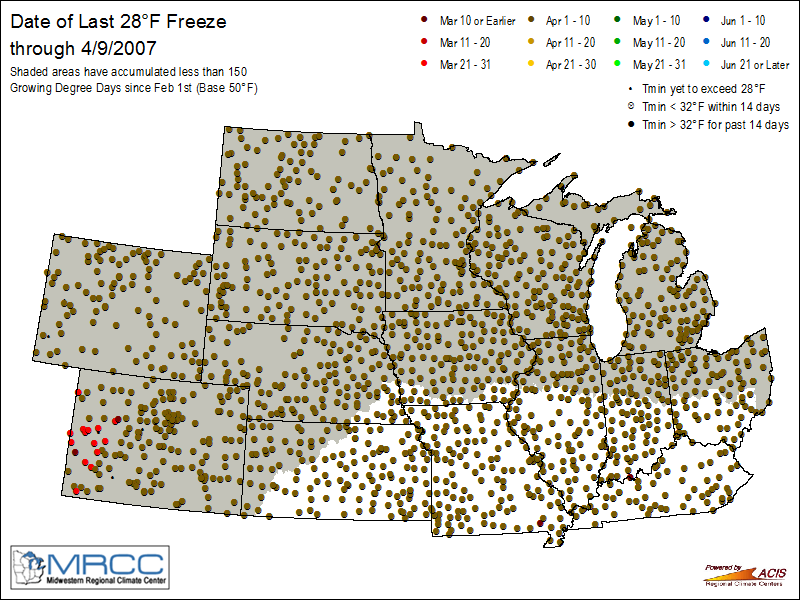
This map for April 9, 2007 shows that temperatures of 28 degrees F have occurred across the entire Midwest and Plains since April 3.
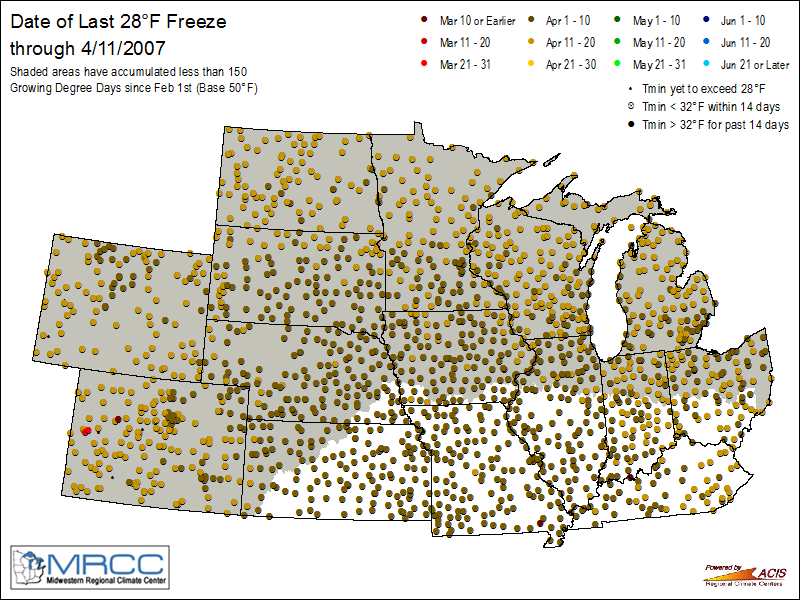
This map shows the locations that have experienced freezing temperatures of 28 degrees F. The dark brown dots indicate that these temperatures occurred between April 1 and April 10. The light brown dots indicate that these temperatures occurred the morning of April 11th.
[ close ]