Information on Fall Freeze Maps
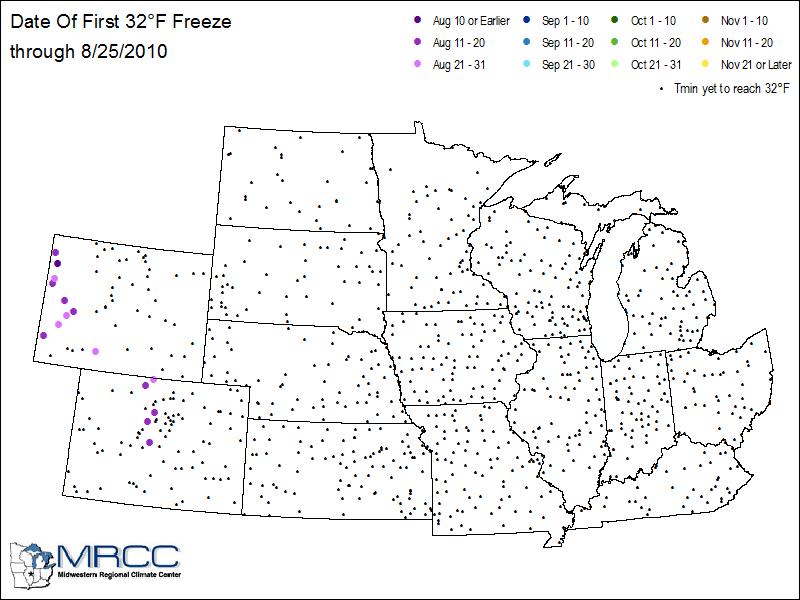
The Fall Freeze map tracks the date of the first freeze event in the fall. The map is updated daily. Each station on the map is marked by a small black dot. Each station is noted with a small black dot prior to reaching the freeze threshold (32°F or 28°F). Once a station records at least one day with a minimum temperature at or below the freeze threshold, it is marked by a large dot filled with a color determined by the date of the first freeze.
An Example of the Fall Freeze Map – December 2010
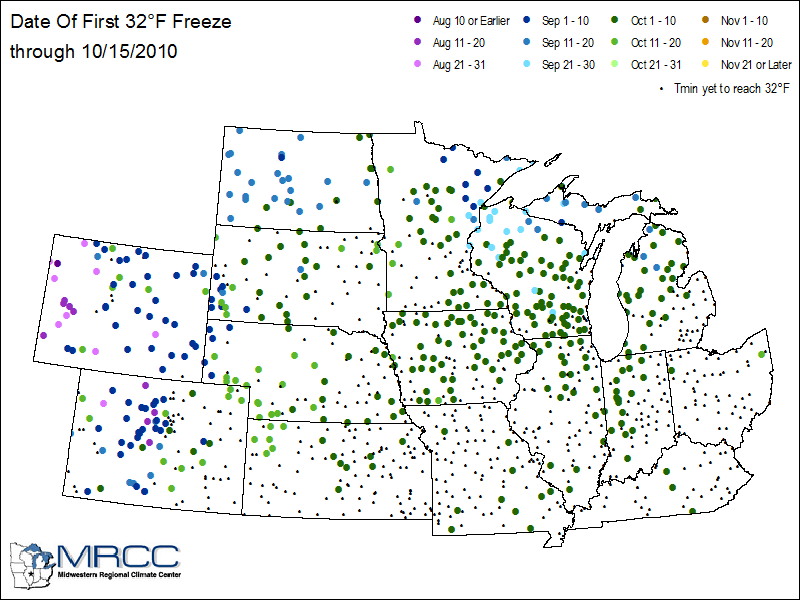
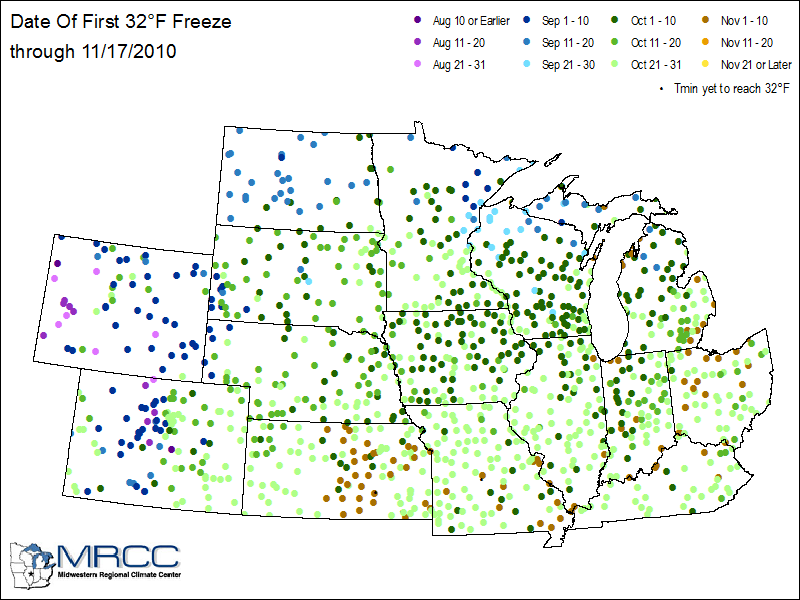
Using the fall of 2010 as an example, the development of the freeze maps through the season is shown in the three panels below. In the first panel, most stations have not yet observed a freezing temperature so they are noted with a small black dot. As the season progresses, more and more stations record a freeze event. After each station records freeze event, the station dot is larger and colored to designate the date of the first freeze.
[ close ]